

Analys
The self-destructive force of unregulated solar power

Modifications

Solar and wind power production has increased rapidly over the latest years as LCOE costs have fallen sharply while government support schemes have given it an extra boost as well. Solar and wind power production is totally unregulated supply. They produce whenever they produce. Fossil power supply on the other hand is fully dispatchable to the degree that we tend to take it for granted. As such we have naturally tended to underestimate the consequences of not having dispatchability in solar and wind power.
When you start out with a large, fossil-based power system it is fairly easy to add unregulated power supply from solar and wind because it can piggyback on the dispatchability and flexibility of the fossil power system. But as the share of unregulated renewable energy rises to a larger and larger share of production, the flexibility in the fossil part of the system naturally gets smaller and smaller. This problem is accentuated further by the fact that solar power production has a very high concentration of production where 80% of production in a year is produced in only 20% of the hours in the year. Thus fossil flexibility and dispatchability is eroded much faster during these 20% hours.
Power prices typically collapse to zero or negative when demand is fully met or saturated by unregulated power supply. That again implies that solar power profitability collapse as well. And the result of that of course is that the exponential growth in solar power production which we now take for granted and which we expect will lead us all the way to zero emissions could come to a full stop as well.
This is already a rapidly increasing problem in California where more and more renewable energy is denied access to the grid because there simply isn’t enough demand for it just then or because the grid cannot handle it. But it is also becoming an increasing problem in Germany where the strong growth and high concentration of solar power increasingly is destroying the power prices just when they produce the most.
The need for biiiig, cheeeeap grid batteries are now becoming increasingly critical for the the exponential growth in solar and wind power to continue.
We fear that the self-destructive force on power prices, of exponential growth in unregulated solar power, is some kind of Solar-hara-kiri process with respect to its own profitability. And that it has the potential to develop along a curve of ”first gradually, then suddenly”. And when/if that happens the exponential growth in unregulated solar power production should naturally come to a screeching halt.
The resolution of the problem is of course the eventual arrival of biiiig, cheeeap grid batteries which then again will sett solar power production free to resume its exponential growth.
Feeding solar and wind power supply into a fossil system is easy to start with. Then very difficult. It is easy to build unregulated solar and wind power supply into a flexible fossil system. It is easy to infuse unregulated power supply (Solar and Wind) into a power system where there is lots and lots of fossil based power. Fossil supply can then back-off and make room for solar and wind power whenever the sun is shining or the wind is blowing and then ramp up again when it suddenly disappear. But when unregulated, renewable energy supply keeps growing it becomes harder and harder to infuse yet more of it into the system as the fossil flexibility is increasingly eroded. That’s when yet more supply of solar and wind is no longer pushing aside fossil supply but instead is starting to destroy their own prices.
Solar power produces 80% of its production during 20% of the hours in the year. Solar power has however a much more tightly focused production profile than wind. In Germany in 2023 some 80% of all solar power production was concentrated on only 20% of the hours of the year. For wind power the 80% share of production was spread out over 50% of the hours in the year. The reason is of course that the wind can blow both summer and winter and night and day. Solar power is instead focused during the day and during summer. It has a much higher concentration of production.
Power prices tend to collapse when demand is fully covered by unregulated power supply. When solar power production grows rapidly in a given power system then its high production concentration will eventually lead to full saturation during certain hours of the year. Demand during these hours will then be fully supplied and covered by unregulated power like solar, wind, run-of-river hydro and other unregulated supply. That is great as it means that the fossil share in these hours then are close to zero.
The problem is that power markets, more than any other commodity market in the world, are extremely sensitive to imbalances in supply and demand. A little bit too little supply and the power price can spike up to close to infinity. A little bit too much supply and the price crashes to zero or negative.
When unregulated power supply reaches full demand saturation during certain hours then power prices tend to collapse because it is so easy to get a little bit too much supply.
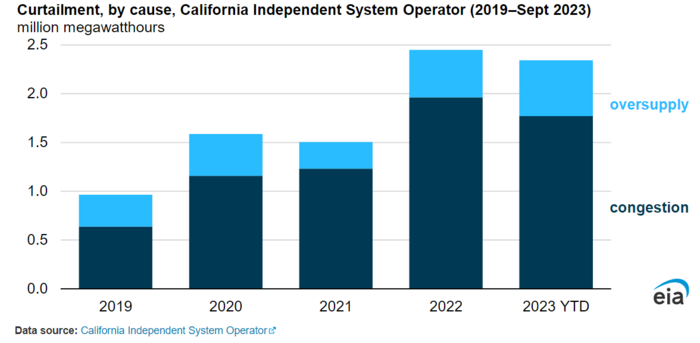
It is not a problem when power prices collapse for just a few hours per year. But the number of hours affected is growing rapidly many places. The US EIA highlighted in October 2023 (”Solar and wind power curtailments are rising in California”) that this is becoming a bigger and bigger problem in California. Since 2019 the power system operator there has been forced to curtail supply of unregulated power more and more. There simply isn’t enough demand in certain hours to meet the spikes in unregulated supply or the grid isn’t up to the task of distributing the unregulated supply in the system.
So when producers of unregulated supply produces the most they increasingly are denied access to sell it into the grid or if they are allowed to sell it into the grid the price is close to zero or even negative.
US EIA: Solar and wind power curtailments are rising in California
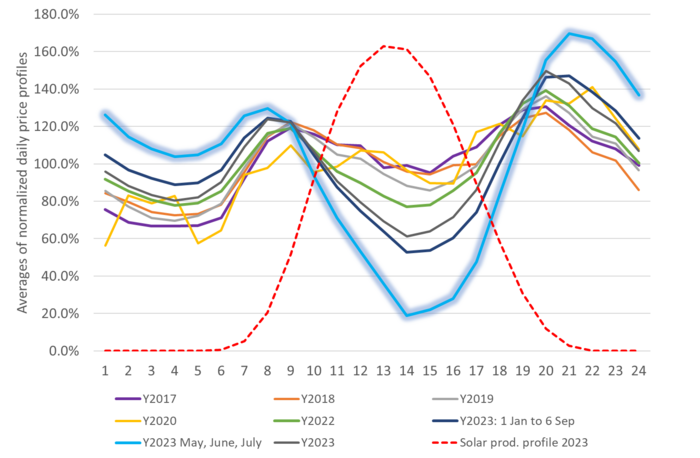
Germany is increasingly affected as booming solar production is depressing prices more and more. This is now also a rapidly increasing problem in Germany where rapid growth in supply of solar and wind power together increasingly are forcing power prices lower just when they produce the most.
Average German power prices for hour 1 to 24 for certain periods and years. Highly concentrated supply of solar power during summer and during the day is increasingly forcing power prices towards zero during these periods
It is like ”Solar hara-kiri” when increasing supply of solar power is killing its own prices and profits. It was not a big problem economically when only a few hours are affected. But as more and more hours are affected it is becoming an increasing problem. It is like ”Solar hara-kiri” where rapidly rising supply of solar power is increasingly killing its own prices. With that it is killing its profits. And if profits are killed than new-build and growth in supply will typically slow down rapidly as well.
This is probably not a big problem globally yet as the global power system is still predominantly fueled by fossil fuels which can back off when renewable energy spikes up. But in certain pockets of the world where penetration of unregulated power supply has reached high levels it is becoming an increasing problem. Like in California and in Germany.
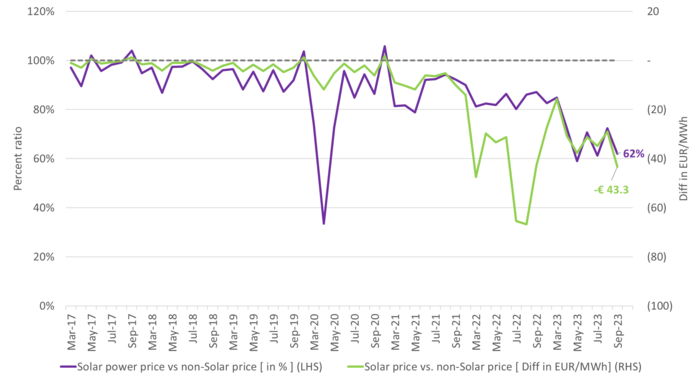
The volume weighted solar power price in September 2023 in Germany had a 38% discount to power prices during non-solar power hours. And the discount looks like it is rapidly getting bigger and bigger.
The monthly average volume weighted solar power price versus the average volume weighted non-solar power price weighted by the inverse profile. In Germany in September 2023 solar power producers only achieved 62% of the average price during hours of the day when the sun wasn’t shining.
First gradually, then suddenly. There is a clear risk here that this progresses along a process of ”first gradually, then suddenly”. This is already what we have seen over the past couple of years: The discount for what solar power earns when it produces power versus what the power price is when it is not producing is increasing rapidly as more and more unregulated power supply hits right into the ”demand ceiling”. The inflicted pain from this process so far has to a large degree been masked by incredibly high natural gas prices. So even if the profitability for solar power has been eroding, the average power price in the system has been much higher than usual due to high natural gas and CO2 prices.
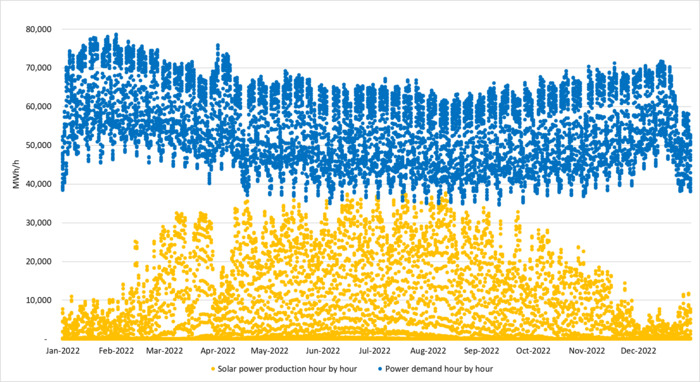
Graphing all the individual hourly data for solar power and power demand in Germany in 2022 we see that solar power alone is not yet reaching full saturation versus demand.
Germany 2022: Hourly German power demand and solar power supply in 2022. A total of 8760 hours for each in consecutive order. Her showing only Demand and Solar power production
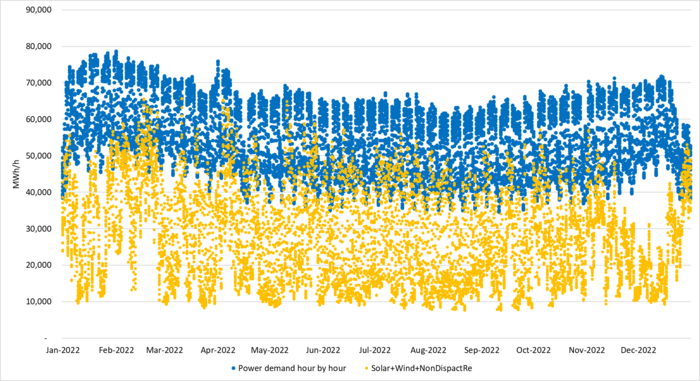
The unregulated power supply is increasingly hitting the ”demand ceiling”. If we now add all the other sources of unregulated power supply, predominantly offshore and onshore wind and run of river, then we get the following picture where we see that unregulated German power supply increasingly is hitting right up and into the ”demand ceiling”. In those instances there will be no, flexible fossil power supply left to back off and that is typically when power prices collapse or go negative.
Germany 2022: Hourly German power demand (blue dots) and unregulated supply (solar, wind, run of river,…) in orange dots. A total of 8760 hours for each in consecutive order.
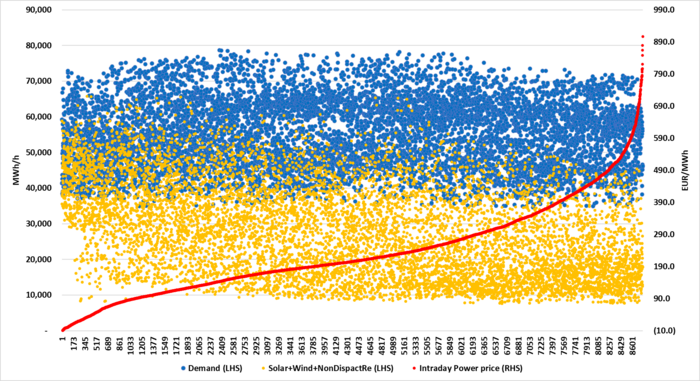
High unregulated power supply saturation vs demand implied lower power prices in 2022. Sorting 8760 individual power prices in Germany from Y2022 from lowest to highest shows that power German power prices were strongly related to the penetration of unregulated power supply. In the following graph, we have sorted the data from the lowest price to the highest price in the year 2022. Prices were ireasingly depressed when unregulated power penetrated up and into the ”demand ceiling”. Natural gas prices were extreme in 2022 and overall power prices were exceptionally high for that reason as well. But the tendency of price destruction in relation to high levels of unregulated power vs demand is clear.
Germany 2022: Hourly German power demand (blue dots) and unregulated supply (solar, wind, run of river,…) in orange dots. A total of 8760 hours. Sorted according to how hourly power prices were from lowest to highest.
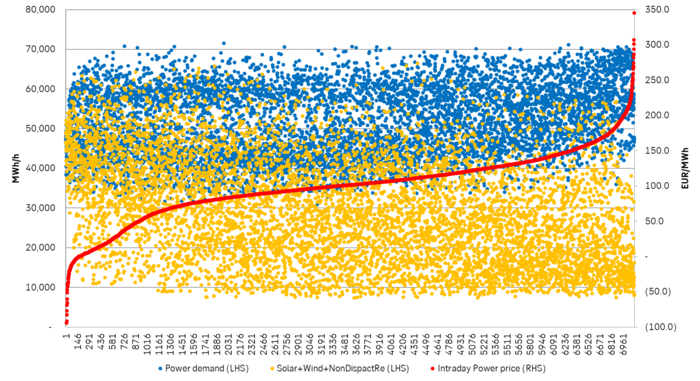
The unregulated power supply penetrating vs demand was even deeper in 2023. If we make the same graph for the year 2023 from 1 Jan to 20 Oct, we can see how the unregulated power is penetrating deeper and deeper into the power ”demand ceiling”. As a result the solar power discount vs. non-solar power hours from March to September in 2023 reached an even higher discount in 2023 than in 2022.
2023 year to 20 October: Hourly German power demand (blue dots) and unregulated supply (solar, wind, run of river,…) in orange dots. A total of 8760 hours. Sorted according to how hourly power prices were from lowest to highest. German power demand was down 8.3% YoY in H1-2023 due to the European energy crisis and still very high power prices
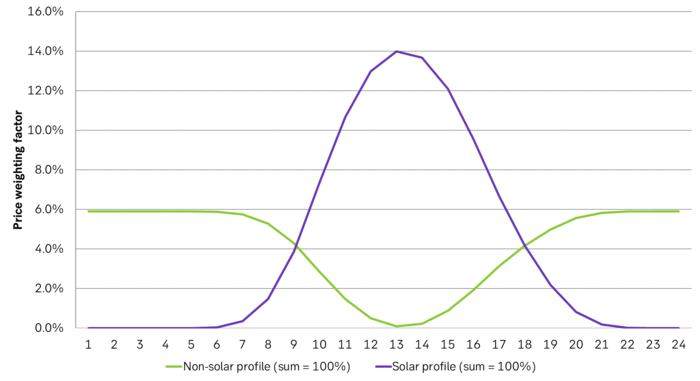
Solar power hours and non-solar power hours is not given as a clear cut-off, but a gradual one. In the following graph given as average profiles of the year from hour 1 to hour 24. First calculated explicitly for solar power production and then the inverse is calculated from that one. These solar power profiles can then be calculated for each individual day in the year giving individual inverse-curves on a daily basis.
The daily ”solar power production profiles” and the ”non-solar power production profiles” typically looks like this graph but calculated individually per day as solar power production varies from day to day and through the seasons. The solar power production profile is explicitly given by the actual solar power production that day while the non-solar power profile is derived directly from this and the inverse of it on a daily basis.
The exponential growth in solar and wind power is likely to slow down in the years to come as grid constraints and lack of power cables is holding up growth in renewable energy with waiting times for access of 5-10 years:
”Offshore wind auction’s lack of bids must be ‘wake-up call’ for UK, says RWE chief”
FT: ”Gridlock: how a lack of power lines will delay the age of renewables”
FT: ”Will there be enough cables for the clean energy transition?”
Brent is climbing higher. Front-month is at USD 106.3/bl this morning, close to a weekly high and a USD 9/bl jump from Mondays open. This is the move we flagged as a risk earlier in the week: the market shifting from ”a deal is around the corner” to ”this is going to take longer than we thought”.

Analyst Commodities, SEB
During April, rest-of-year Brent remained remarkably stable around USD 90/bl. A stability which rested on one single assumption: the SoH reopens around 1 May. That assumption is now slowly falling apart.
As we highlighted yesterday: every week of delay beyond 1 May adds (theoretically) ish USD 5/bl to the rest-of-year average, as global inventories draw 100 million barrels per week. i.e., a mid-May reopening implies rest-of-year Brent closer to USD 100/bl, and anything pushing into June or July takes us meaningfully higher.
What’s changed in the last 48 hours:
#1: The US military has formally warned that clearing suspected sea mines from SoH could take up to six months. That is a completely different timescale from what the financial market is pricing. Even a political deal tomorrow does not immediately reopen the strait.
#2: Trump has shifted his tone from urgency to ”strategic patience”. In yesterday’s press conference: ”Don’t rush me… I want a great deal.” The market is reading this as a president no longer feeling pressured by timelines, with the naval blockade running in the background.
#3: So far, the military activity is escalating, not de-escalating. Axios reports Iran is laying more mines in SoH. The US 3rd carrier strike group (USS George H.W. Bush) is arriving with two countermine vessels. Trump yesterday ordered the US Navy to destroy any Iranian boats caught laying mines. While CNN reports that the Pentagon is actively drawing up plans to strike Iranian SoH capabilities and individual Iranian military leaders if the ceasefire collapses. i.e., NOT a attitude consistent with an imminent deal!
Spot crude and product prices eased off the early-April highs on a combination of system rerouting and deal optimism. Both now weakening. Goldman estimates April Gulf output is reduced by 14.5 mbl/d, or 57% of pre-war supply, a number that keeps getting worse the longer this drags on.
Demand-side adaptation is ongoing: S. Korea has cut its Middle East crude dependence from 69% to 56% by pulling more from the Americas and Africa, and Japan is kicking off a second round of SPR releases from 1 May. But SPRs are finite.
Ref. to the negotiations, we should not bet on speed. The current Iranian leadership is dominated by genuine hardliners willing to absorb economic pain and run the clock to extract concessions. That is not a setup for a rapid resolution. US/Israeli media briefings keep framing the delay as ”internal Iranian divisions”, the reality is more complicated and points toward weeks and months, not days.
Our point is that the complexity is large, and higher prices have only just started (given a scenario where the negotiations drag out in time). The market spent April leaning on the USD 90/bl rest-of-year assumption; that case is diminishing by the hour. If ”early May reopening” is replaced by ”June, July or later” over the next week or two, both crude and products have meaningful room to reprice higher from here. There is a high risk being short energy and betting on any immediate political resolution(!).
Down on Friday. Up on Monday. The Brent June crude oil contract traded down 5.1% last week to a close of $90.38/b. It reached a high of $103.87/b last Monday and a low of $86.09/b on Friday as Iran announced that the Strait of Hormuz was fully open for transit. That quickly changed over the weekend as the US upheld its blockade of Iranian oil exports while Iran naturally responded by closing the SoH again. The US blew a hole in the engine room of the Iranian ship TOUSKA and took custody of the ship on Sunday. Brent crude is up 5.6% this morning to $95.4/b.

The cease-fire is expiring tomorrow. The US has said it will send a delegation for a second round of negotiations in Islamabad in Pakistan. But Iran has for now rejected a second round of talks as it views US demands as unrealistic and excessive while the US is also blocking the Strait of Hormuz.
While Brent is up 5% this morning, the financial market is still very optimistic that progress will be made. That talks will continue and that the SoH will fully open by the start of May which is consistent with a rest-of-year average Brent crude oil price of around $90/b with the market now trading that balance at around $88/b.
Financial optimism vs. physical deterioration. We have a divergence where the financial market is trading negotiations, improvements and resolution while at the same time the physical market is deteriorating day by day. Physical oil flows remain constrained by disrupted flows, longer voyage times and elevated freight and insurance costs.
Financial markets are betting that a US/Iranian resolution will save us in time from violent shortages down the road. But every day that the SoH remains closed is bringing us closer to a potentially very painful point of shortages and much higher prices.
The US blockade is also a weapon of leverage against its European and Asian allies. When Iran closed the SoH it held the world economy as a hostage against the US. The US blockade of the SoH is of course blocking Iranian oil exports. But it is also an action of disruption directed towards Europe and Asia. The US has called for the rest of the world to engaged in the war with Iran: ”If you want oil from the Persian Gulf, then go and get it”. A risk is that the US plays brinkmanship with the global oil market directed towards its European and Asian allies and maybe even towards China to force them to engage and take part. Maybe unthinkable. But unthinkable has become the norm with Trump in the White House.
Wild moves yesterday. Brent crude traded to a high of $114.43/b and a low of $96.0/b and closed at $99.94/b yesterday.
US – Iran negotiations ongoing or not? What a day. Donald Trump announced that good talks were ongoing between Iran and the US and that the 48 hour deadline before bombing Iranian power plants and energy infrastructure was postponed by five days subject to success of ongoing meetings. Iranian media meanwhile stated that no meetings were ongoing at all.
Today we are scratching our heads trying to figure out what yesterday was all about.
Friends and family playing the market? Was it just Trump and his friends and family who were playing with oil and equity markets with $580m and $1.46bn in bets being placed by someone in oil and equity markets just 15 minutes before Trump’s announcement?
Was Trump pulling a TACO as he reached his political and economic pain point: Brent at $112/b, US Gas at $4/gal, SPX below 200dma and US 10yr above 4.4%?
Different Iranian factions with Trump talking with one of them? Are there real negotiations going on but with the US talking to one faction in Iran while another, the hardliners, are not involved and are denying any such negotiations going on?
Extending the ultimatum to attack and invade Kharg island next weekend? Or, is the five day delay of the deadline a tactical decision to allow US amphibious assault ships and marines to arrive in the Gulf in the upcoming weekend while US and Israeli continues to degrade Iranian military targets till then. And then next weekend a move by the US/Israel to attack and conquer for example the Kharg island?
We do not really know which it is or maybe a combination of these.
We did get some kind of TACO ydy. But markets have been waiting for some kind of TACO to happen and yesterday we got some kind of TACO. And Brent crude is now trading at $101.5/b as a result rather than at $112-114/b as it did no the high yesterday.
But what really matters in our view is the political situation on the ground in Iran. Will hardliners continue to hold power or will a more pragmatic faction gain power?
If the hardliners remain in power then oil pain should extend all the way to US midterm elections. The hardliners were apparently still in charge as of last week. Iran immediately retaliated and damaged LNG infrastructure in Qatar after Israel hit Iranian South Pars. The SoH was still closed and all messages coming out of Iran indicated defiance. Hardliners continues in power has a huge consequence for oil prices going forward. The regime has played its ’oil-weapon’ (closing or chocking the Strait of Hormuz). It is using it to achieve political goals. Deterrence: it needs to be so politically and economically expensive to attack Iran that it won’t happen again in the future. Or at least that the US/Israel thinks 10-times over before they attack again. The highest Brent crude oil closing price since the start of the war is $112.19/b last Friday. In comparison the 20-year inflation adjusted Brent price is $103/b. So Brent crude last Friday at $112.19/b isn’t a shockingly high price. And it is still far below the nominal high of $148/b from 2008 which is $220/b if inflation adjusted. So once in a lifetime Iran activates its most powerful weapon. The oil weapon. It needs to show the power of this weapon and it needs to reap political gains. Getting Brent to $112/b and intraday high of $119.5/b (9 March) isn’t a display of the power of that weapon. And it is not a deterrence against future attacks.
So if the hardliners remain in power in Iran, then the SoH will likely remain chocked all the way to US midterm elections and Brent crude will at a minimum go above the historical nominal high of $148/b from 2008.
Thus the outlook for the oil price for the rest of the year doesn’t depend all that much of whether Trump pulls a TACO or not. Stops bombing or not. It depends more on who is in charge in Iran. If it is the hardliners, then deterrence against future attacks via chocking of the SoH and high oil prices is the likely line of action. It is impacting the world but the Iranian ’oil-weapon’ is directed towards the US president and the the US midterm elections.
If a pragmatic faction gets to power in Iran, then a very prosperous future is possible. However, if power is shifting towards a more pragmatic faction in Iran then a completely different direction could evolve. Such a faction could possibly be open for cooperation with the US and the GCC and possibly put its issues versus Israel aside. Then the prosperity we have seen evolving in Dubai could be a possible future also for Iran.
So far it looks like the hardliners are fully in charge. As far as we can see, the hardliners are still fully in control in Iran. That points towards continued chocking of the SoH and oil prices ticking higher as global inventories (the oil market buffers) are drawn lower. And not just for a few more weeks, but possibly all the way to the US midterm elections.


Solkraften pressar elpriserna dagtid

Michel Gubel ger sin syn på oljemarknaden

Svag vårflod dubblar elpriserna
Brent crude up USD 9/bl on the week… ”deal around the corner” narrative fades
Market Still Betting on Timely Resolution, But Each Day Raises Shortage Risk

Det fysiska spotpriset på brentolja har slagit nytt rekord

Marknaden måste börja betrakta de höga kopparpriserna som det nya normala

Christian Kopfer om läget för oljan
Market Still Betting on Timely Resolution, But Each Day Raises Shortage Risk
Brent crude up USD 9/bl on the week… ”deal around the corner” narrative fades
-
 Nyheter4 veckor sedan
Det fysiska spotpriset på brentolja har slagit nytt rekord
-
 Nyheter4 veckor sedan
Marknaden måste börja betrakta de höga kopparpriserna som det nya normala
-
 Nyheter3 veckor sedan
Christian Kopfer om läget för oljan
-
Analys2 veckor sedan
Market Still Betting on Timely Resolution, But Each Day Raises Shortage Risk
-
Analys1 vecka sedan
Brent crude up USD 9/bl on the week… ”deal around the corner” narrative fades
-
 Nyheter6 dagar sedan
Michel Gubel ger sin syn på oljemarknaden
-
Nyheter6 dagar sedan
Svag vårflod dubblar elpriserna
-
 Nyheter4 dagar sedan
Solkraften pressar elpriserna dagtid