

Analys
SEB – Råvarukommentarer, 11 februari 2013

Rekommendationer
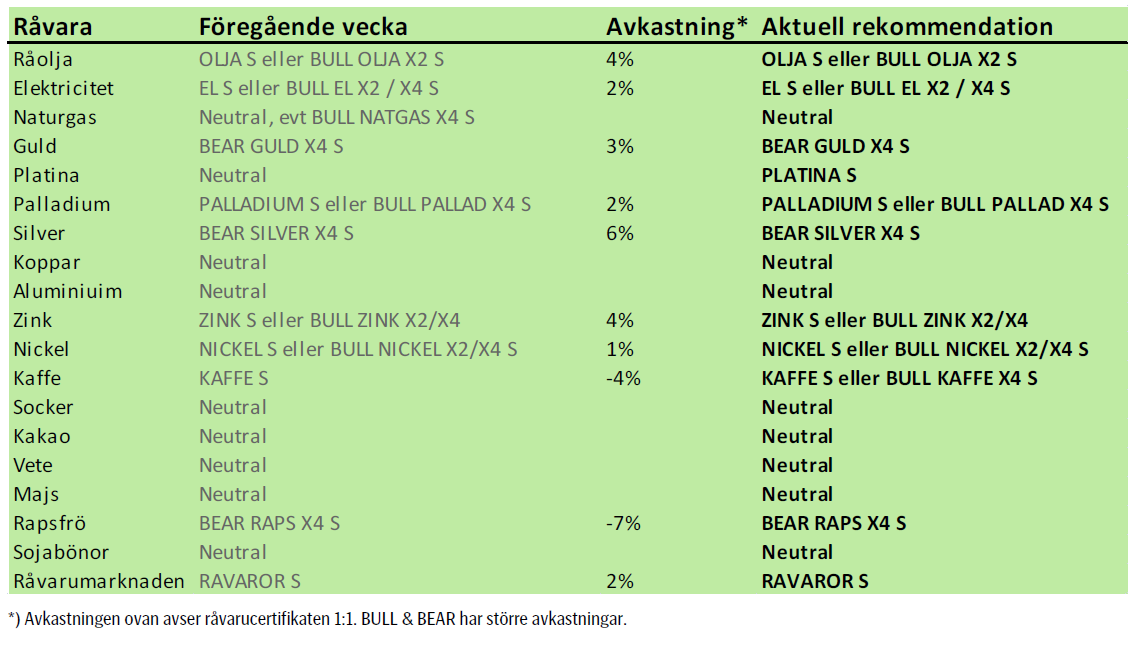
Inledning
Råvaruindex i svenska kronor steg med 2%, vilket medförde att råvaruindex-certifikatet RAVAROR S steg lika mycket. Aktiemarknaden hade däremot en blandad vecka, där i synnerhet råvarubolaget SSAB:s rapport fick aktien på fall. Råvaror och aktier är inte samma sak, som bekant.
Oljepriset fortsatte att stiga med stöd av tecken på en starkare konjunktur i kombination med att produktionen kortsiktigt stryps av Saudiarabien och på grund av hoten om våld även i Algeriet och Libyen.
Som väntat steg elpriset på Nordpool, vilket fick BULL EL X4 S att stiga med 9% på en vecka. Vi tror att det kan komma en rekyl nedåt, men i ett större perspektiv verkar det som om elpriserna håller på att förbereda sig för en fas av prisuppgång. Såväl marknaden för kol, som utsläppsrätter stärktes i veckan som gick; under stöd av starkare global konjunktur.
I fredags publicerade USDA sina månadsvisa estimat (gissningar) om produktion, konsumtion och utgående lager för vete, majs och sojabönor, bland annat. Det var något av en icke-händelse med endast marginella förändringar i siffrorna.
Kaffepriset föll i veckan, men orosmolnen hopar sig för produktionen i Mellanamerika. I International Coffee Organisations senaste månadsrapport lyfts svampsjukdomarna fram som mycket värre än vad marknaden hittills uppfattat. Samma svampangrepp fick för hundra år sedan ön Ceylon att byta från kaffe till te.
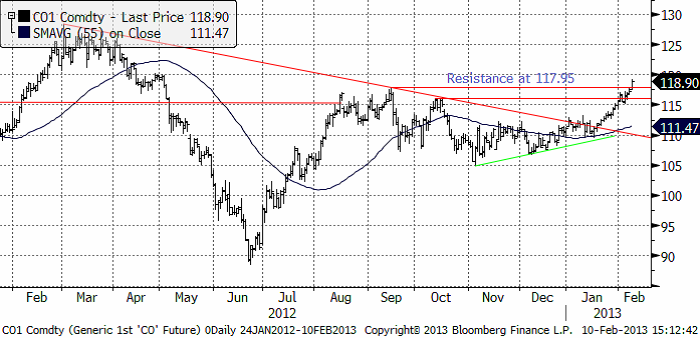
Råolja – Brent
Råoljepriset har brutit alla närliggande tekniska motstånd och har fritt upp till 125 dollar. Vi fortsätter att rekommendera köp av olja. Bäst är om man kan komma in lite billigare efter en rekyl.
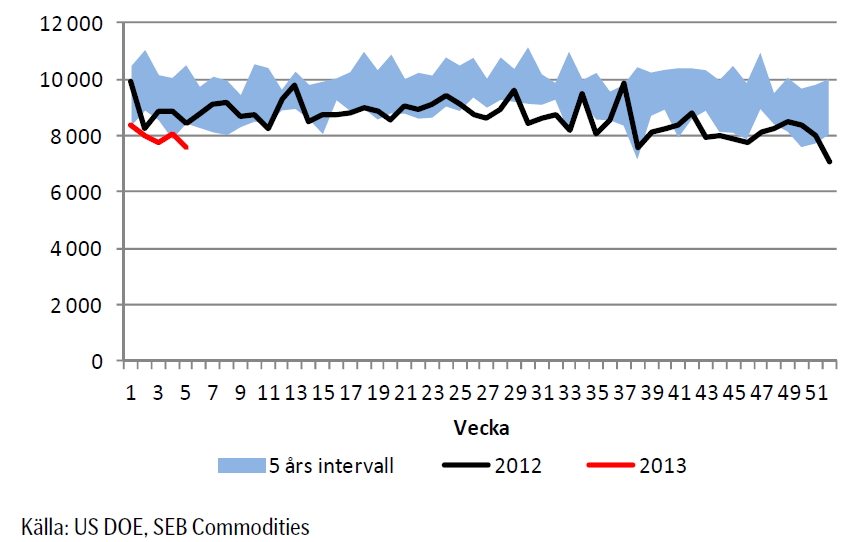
Lagren och lagerförändringarna i USA per för den senaste avrapporterade veckan, enligt Department of Energy och American Petroleum Institute visas nedan.
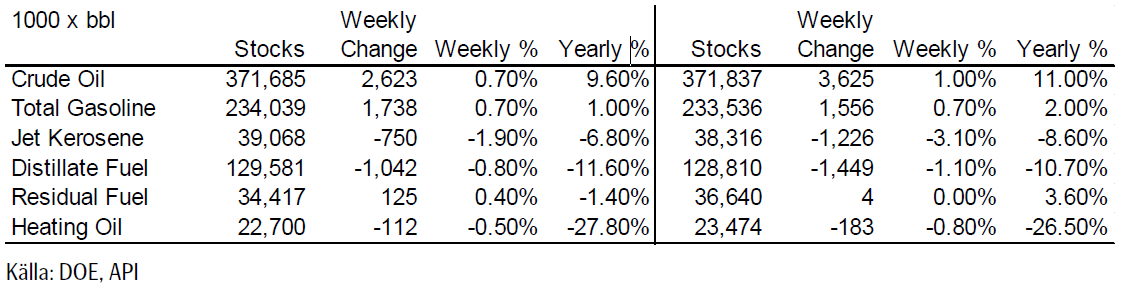
Lagren för destillat och heating oil, som redan låg under förra årets nivå, forsätter att minska. Detta är stödjande.
Råoljelagren fortsatte att byggas på. Nedan ser vi amerikanska råoljelager enligt DOE i tusen fat. Den svarta kurvan är 2012 års lagernivåer vecka för vecka och den lilla röda linjen är 2013 års nivå. Vi ser att lagernivåerna fortsätter att vara högre än de varit sedan 2007 för den här tiden på året.
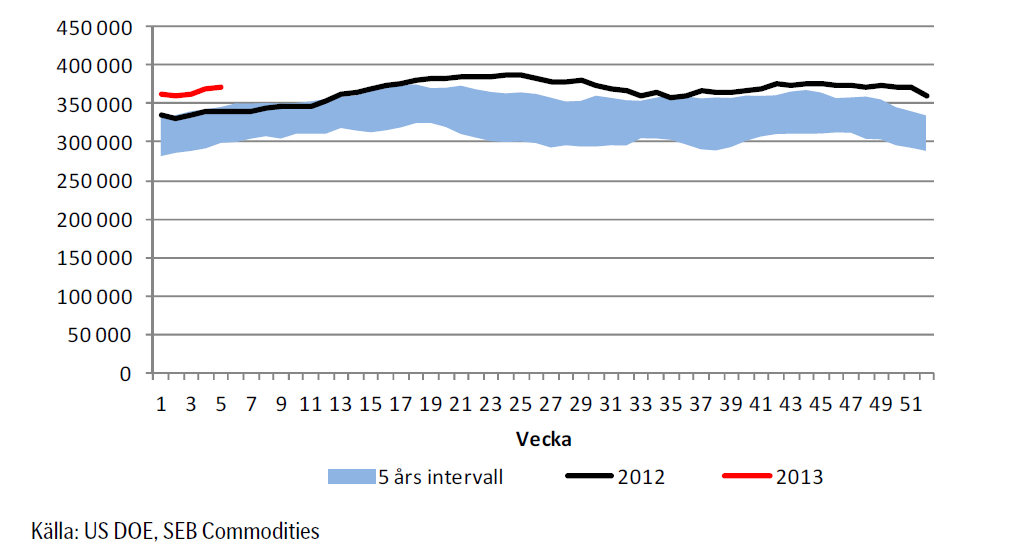
Lagren ökar samtidigt som vi ser att importen av råolja till USA fortsätter att minska. Man kan ana att konjunktur och den nya ”fracking” tekniken ligger bakom.
Sammanfattningsvis: Köprekommendationen forsätter.
Elektricitet
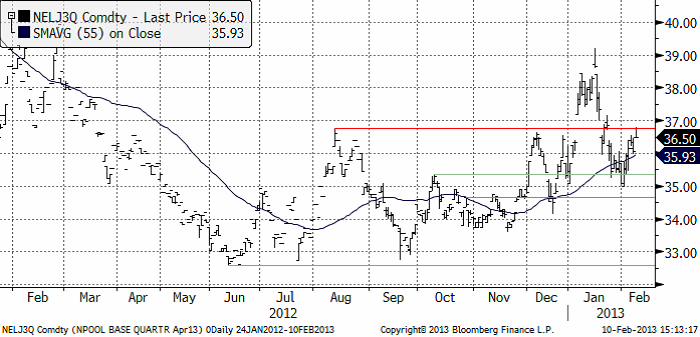
Elpriset steg snabbt i veckan och stötte på motstånd där det fanns ett i väntan sedan tidigare. Det kan komma en rekyl nedåt. Vi tror att det i så fall är ett köptillfälle. Vi håller fast vid vår rekommendation att köpa EL S eller någon av BULL EL X2 S och BULL EL X4 S, för dem som är villiga att ta mer risk. Prisuppgången i veckan för BULL EL X4 S var hela 9%. Elpriset har kommit ner så pass, till 35 euro per ton, att de kan vara en god idé att försöka köpa BULL EL X2 eller X4 S på de här nivåerna.
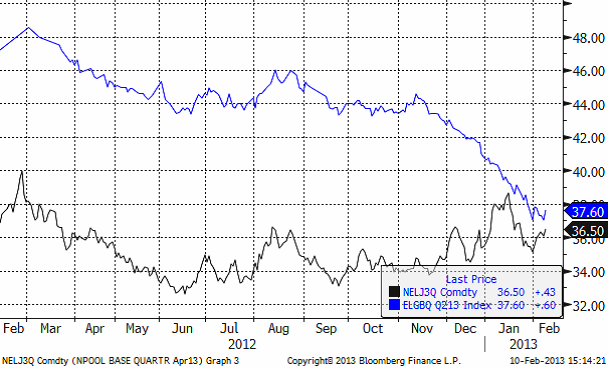
Elpriset i Tyskland (den blåa linjen nedan) gjorde verkar ha stabiliserat sig i veckan som gick, som vi ser i diagrammet nedan.
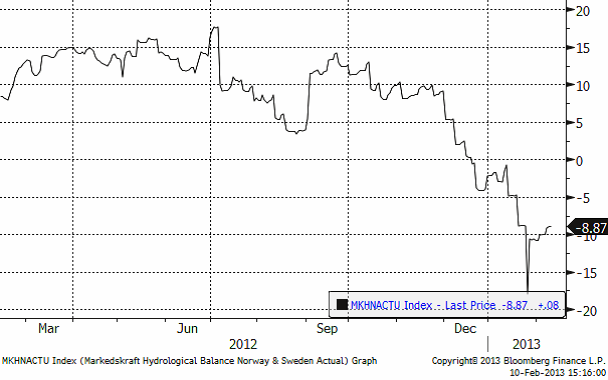
Den hydrologiska balansen för NordPools börsområde gick i veckan från ett underskott på 10 TWh till ett underskott på -8.87 TWh. Det är ”bullish”.
Sammanfattningsvis. Vi tror att det finns goda möjligheter för ytterligare prisuppgång, eventuellt efter en liten rekyl, och rekommenderar en köpt position i el.
Naturgas
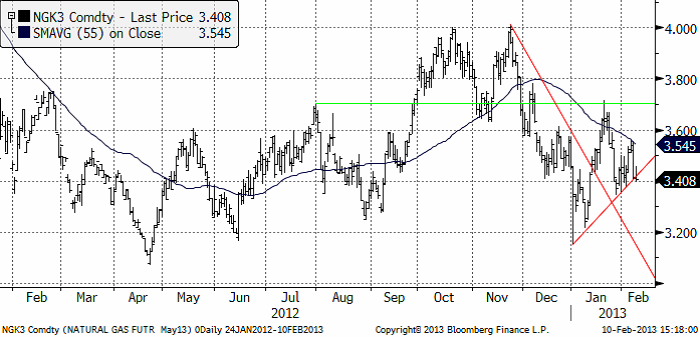
Naturgasterminen på NYMEX (mars 2013) gick först upp i början av förra veckan, och föll sedan tillbaka ner. Veckans uppgång nådde inte lika långt som uppgången innan. Det är ett svaghetstecken. Den uppåtgående stödlinjen bröts sedan i fredags. Det är bara precis ett brott, och kanske inte ska säljas på rakt av. Men skulle priset falla under 3.40 i början av veckan som nu börjar, får vi nog tolka det som en kortsiktig säljsignal från den tekniska analysen.
Guld och Silver
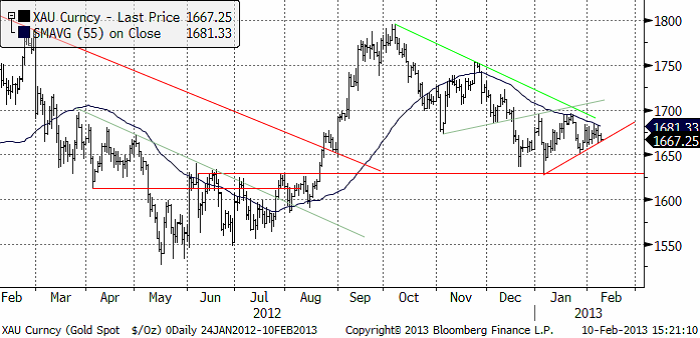
Guldpriset orkade som väntat inte ta sig över föregående topp. Mot slutet av veckan vände priset ner igen. Fredagens handel stannade precis på det kortsiktiga stödet, som vi ser i diagrammet nedan. Får vi ett brott nedåt i veckan som kommer så ger det en förnyad säljsignal.
Vi noterar också att guldmarknaden forsätter att bilda ”trianglar” i sin pendling uppåt och nedåt. Det innebär att ett brott uppåt omedelbart genererar en köpsignal. Skulle priset med andra ord gå upp till över 1700 dollar, har vi en köpsignal. Just nu är dock den senaste signalen en säljsignal. Med reservation för att det kan bli en snabb rekommendationsförändring, håller vi fortfarande fast vid den säljrekommendation vi haft sedan december.
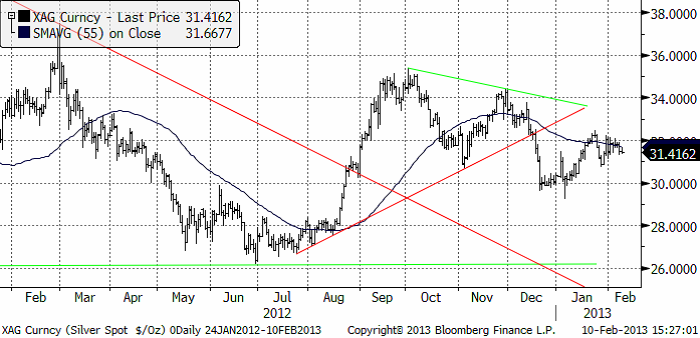
Nedan ser vi kursdiagrammet för silver i dollar per troy ounce. Situationen är snarlik den för guld. Rekyl ner till 30 dollar är att vänta. Kortsiktig BEAR-rekommendation för silver också.
Platina & Palladium
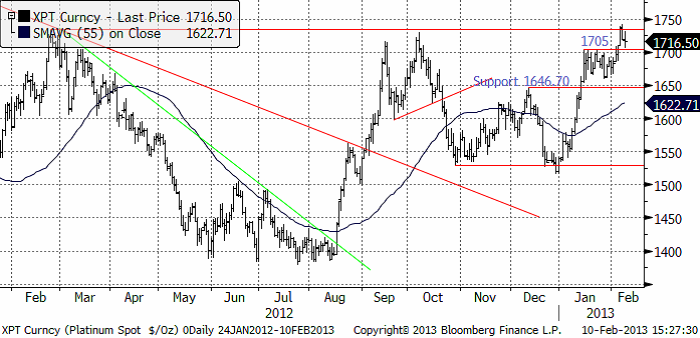
Platina bröt uppåt efter en tids konsolidering. Priset gick upp till motståndet på 1734 dollar och stötte i där, som du kunde läsa förra veckan. Nu är 1705 dollar ett tekniskt stöd. Det här är ett spännande läge, för att konsolideringen mellan 1650 och 1705 kan betraktas som en ”flagga” på vägen upp. Dessa brukar dyka upp halvvägs upp i en uppgångsfas. Därmed skulle priset kunna gå upp till 1850. Det som behövs är att motståndet på 1734 dollar definitivt bryts. Vi fortsätter att rekommendera köp av Plantina, t ex med PLATINA S eller BULL PLATIN X4 S.
Palladium fortsatte stiga i början på förra veckan, men föll sedan tillbaka på vinsthemtagningar. Det ser ut som om uppgångsfasen från 700 dollar till 750 kan tänkas behöva en konsolidering vid dessa nya nivåer, innan priset kan fortsätta upp. Men trenden är definitivt uppåtriktad och rekyler bör hellre betraktas som köptillfällen, än som en orsak att lämna marknaden.
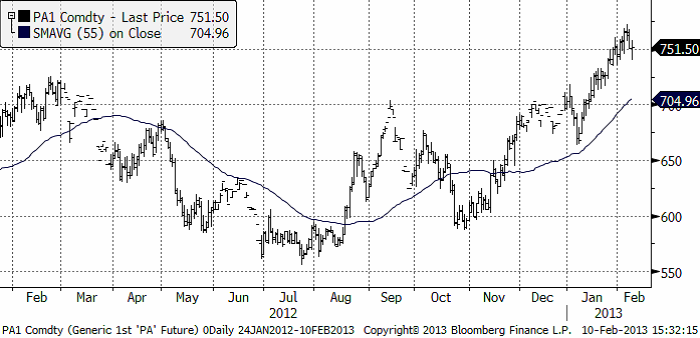
Vi rekommenderar en köpt position i palladium, t ex med certifikatet PALLADIUM S eller med BULL PALLAD X4 S, för den som önskar ta mer risk.
Basmetaller
Efter summering av veckans stängningspriser ser det inte ut att ha hänt så mycket. Metallerna är i de flesta fall i princip oförändrade från måndag morgon till fredag kväll. Rörelserna har ändå varit stora däremellan. Vi varnade för en rekyl efter den starka uppgången veckan dessförinnan. Det var just det som skedde. Börser och råvaror fick sig en törn inledningsvis, ökad Europaoro får väl tillskrivas den huvudsakliga orsaken. Men ibland behövs också korrigeringar för att ge ny kraft.
Priserna föll 2-3 % för att under torsdagen och fredagen återhämta, och således stänga oförändrade. Undantaget är favoriten zink som trots en rejäl rekyl stänger upp 1,6 %. Marknaden fick en extra impuls av fredagens handelssiffror från Kina som visade en 25 % -ig ökning av exporten i januari. Importsiffrorna var också starka med en ökning med 28 %, det senare och beror säkert på att ”bokningar” gjorts före det kinesiska nyårsfirandet nästa vecka. Med många kinesiska aktörer på ledighet nästa vecka förväntas volymerna vara begränsade, vilket i sig kan skapa lite oförutsedda prisrörelser. Men troligast är avvaktande handel.
Koppar
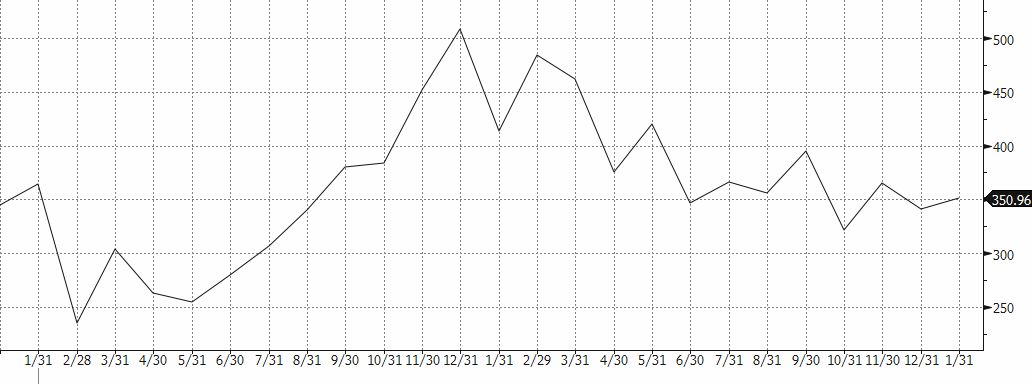
Kinas importsiffror för koppar kom in på 350 958 ton, + 2,9 % i januari jämfört med december. Jämfört med januari förra året föll importen med 15,2 % (se månadsstatistiken nedan). Trenden är fallande under året. Möjligtvis anas en tendens till ”urbottning”. Det blir också intressant hur den utvecklas framöver, efter det kinesiska nyåret. Förra året tog det fart under våren.
Kinas kopparimport (1000-tals ton)
Tekniskt sett ser det relativt positivt ut. Efter brottet ur den stora ”triangelformationen”, rekylerade marknaden ned i veckan. Intressant att notera är ”utbrottsnivån” testades och det vände upp exakt på linjen (se nedan). Det brukar vara ett positivt tecken. Om priset lyckas ta sig över toppen för 2 veckor sen kring $8350, öppnas det upp för en uppgång i trendkanalen upp mot nivåer kring $8600.
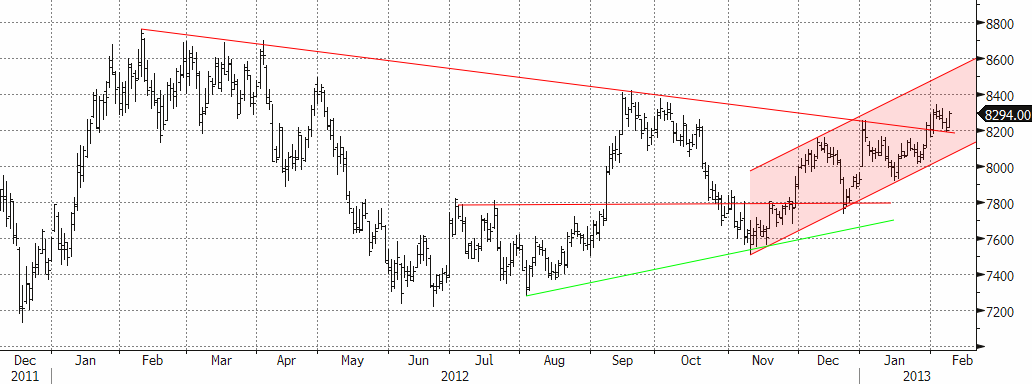
Som vi skrivit tidigare tyder mycket på ökat utbud för koppar, vilket ökar risken för en lite trögare marknad. Vi ser inte den stora potentialen på koppar på uppsidan just nu. Vi rekommenderar därför en fortsatt neutral position i koppar.
Aluminium
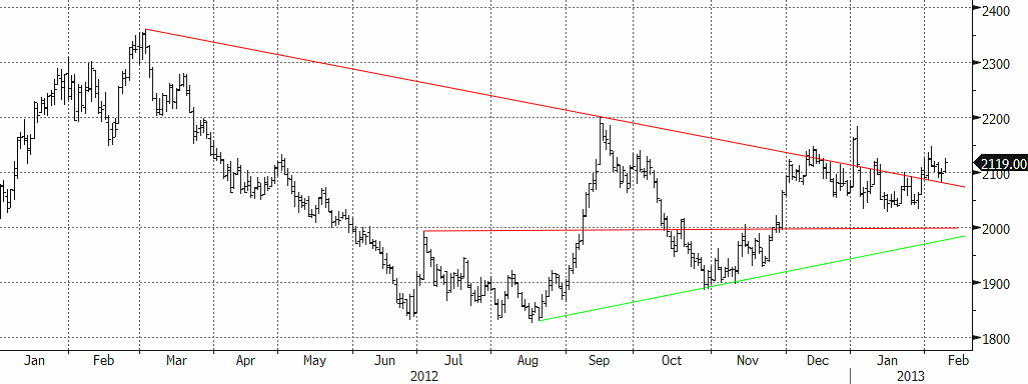
Tekniskt sett liknar bilden den för koppar. ”Utbrottspunkten” tangerades exakt. Om förra veckans topp på $2150 passeras öppnar det upp för ytterligare uppgång. Som vi tidigare skrivit begränsar det överhängande lagret möjligheterna för stora uppgångar. Vi rekommenderar därför fortsättningsvis en neutral position i aluminium.
Zink
Vi varnade för en rekyl, och den kom, men kanske inte så omfattande som väntat. Den stoppade vid $2150. Om vi jämför den tekniska bilden med koppar och aluminium, så kom aldrig priset ned till utbrottspunkten, och det är ett styrketecken. Tekniskt sett får vi en mycket stark stängning som talar för fortsatt uppgång. Vi kvarstår med vår bedömning att marknaden håller på att ”omvärdera” zinken på förväntan om att den fundamentala balansen håller på att svänga om (från stora överskott till mer balanserat). Den ökande produktionen i Kina förra året har väntats minska under Q1. Den senaste statistiken gällande Kinas gruvproduktion visar en fortsatt ökning, vilket riskerar att försena scenariot något.
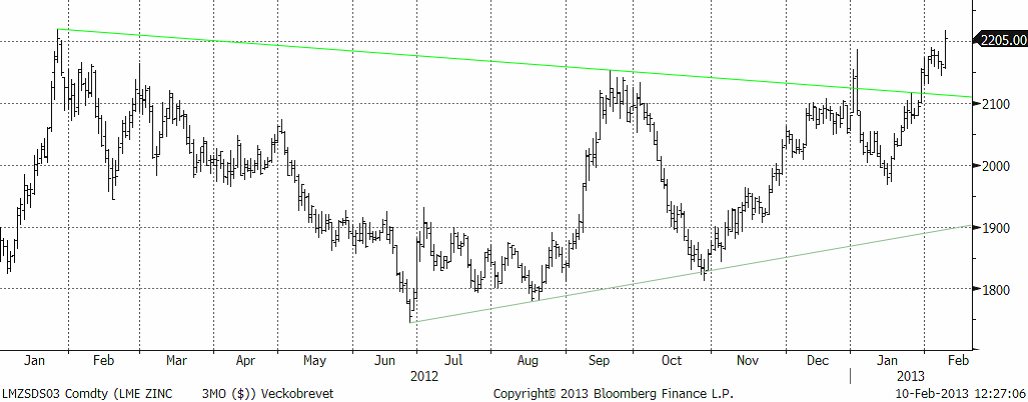
Vi rekommenderar köp av ZINK S eller BULL ZINK X2 / X4 S för den som vill ta mer risk. Efter de senaste veckornas kraftiga uppgång finns fortfarande risk för en rekyl. För nya köp bör man avvakta en eventuell rekyl ned mot intervallet $2000-$2100.
För den som köpt bör man avvakta veckans inledning för att se om marknaden orkar igenom toppen från januari 2011 på $2020 (i fredags handlades $2018 som högst!). På lite längre sikt är potentialen stor med målet $2400 på 1-2 månaders sikt.
Nickel
Rekylen blev relativt kraftig för nickel, med ett fall från $18760 ned till $18150 som lägst. Priset återhämtade sig, men inte riktigt som övriga metaller. Marknaden är fortsatt tveksam till den fundamentala situationen. Kommentarer från den fysiska marknaden indikerar att ”det finns gott om nickel”, samtidigt som rapporter gör gällande att exporten av nickelmalm från Indonesien till Kina ökar igen, vilket riskerar att öka utbudet av s.k. Nickel Pig Iron i Kina (vilket i sin tur minskar efterfrågan på nickelbärande skrot och primärnickel). Som vi tidigare skrivit kan dock nickel erfarenhetsmässigt ofta överraska. Den tekniska bilden är väldigt tydlig med nästa motståndsnivå vid $19000 och därefter $22000. För den som följde rådet att ta hem vinst i början av veckan, kan det vara värt att gå in igen kring ”utbrottspunkten” $18000 med ett nytt köp.
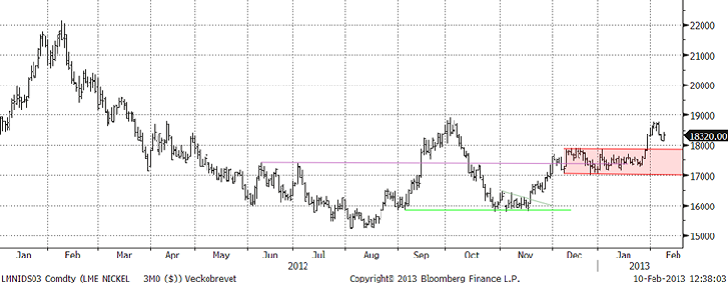
Vi rekommenderar köp av NICKEL S eller BULL NICKEL X2 / X4 S för den som vill ta mer risk. Efter de senaste veckornas kraftiga uppgång finns risk för en rekyl. För nya köp bör man avvakta en eventuell rekyl ned mot ”utbrottsnivån” $18000. För den som köpt tidigare bör man kortsiktigt ta hem vinst vid motståndsnivån $19000. På lite längre sikt är potentialen större med målet $22 000 på 1-2 månaders sikt.
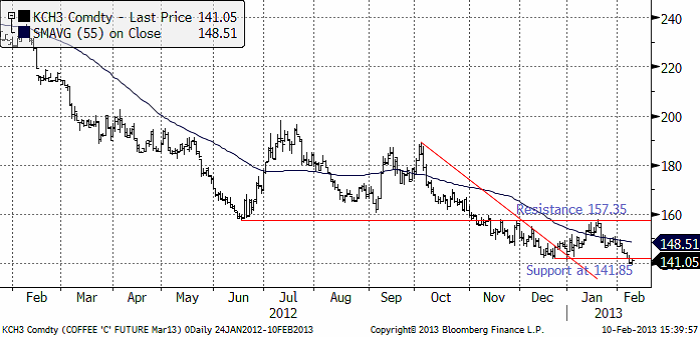
Kaffe
Kaffepriset föll oväntat i veckan som och studsade på 140 cent per pund. ”Stödet” på 141.85 fungerar nu som motstånd. Vi tror trots allt att marknaden befinner sig i en vändningsfas efter två års kraftigt prisfall. Den jämna prisnivån 140 cent fungerar också som ett stöd i sig. Det finns säkerligen en hel del köpordrar lagda på den nivån. Men vi skulle vilja se priset stiga över stödnivån på 141.85 cent för att förtroendet för att vändningsfasen ska ske på den här nivån ska stärkas.
Det har kommit ännu mer information som borde ge stöd för marknaden. International Coffee Organisation (”ICO”) publicerade den senaste månadsrapporten i torsdags. Där står att marknaden just nu tyngs av stora säljintressen i robusta. Om krisen i Mellanamerika, som vi tidigare rapporterat om står:
”In Central America, outbreaks of coffee leaf rust have now been reported in all major coffeeproducing countries. Authorities in Costa Rica have declared a state of emergency in order to tackle the spread of the fungus. In Guatemala and El Salvador, there are reports that rust could have affected 40_50% of all coffee plants, with both countries enacting programmes to provide fungicide to coffee farmers. Nicaragua has also recently launched a campaign to train experts and growers against the spread, while Honduras has declared a phytosanitary emergency. Coffee leaf rust has also been reported in certain parts of Mexico. This outbreak could have serious long_term implications for the production of Washed Arabicas in Central America, with the region potentially losing around 2.5 to 3 million bags of coffee.”
I diagrammet nedan ser vi lite längre prishistorik på kaffe. I den nedre delen av diagrammet ser vi en priscykel om lite drygt fyra år. Den verkar finnas där (statistiskt säkerställd). Kanske har den sitt ursprung i vartannatårs-karaktären av skördens storlek från arabica-busken, i kombination med hur lantbrukarna reagerar på den och prisförändringarna. Enligt den här pris-cykeln, är priset nära en cyklisk botten nu.
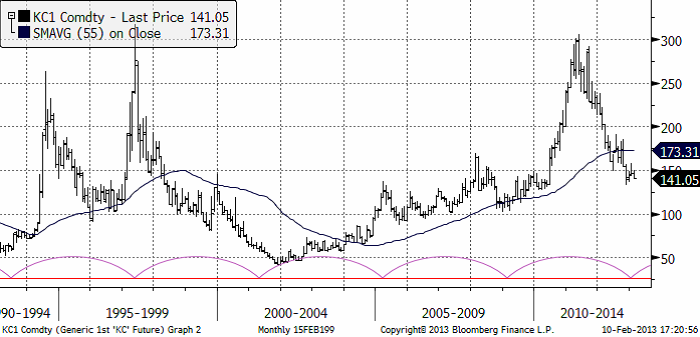
Vi fortsätter att rekommendera köp av KAFFE S eller BULL KAFFE X4 S för den som vill ta mer risk.
Socker
Sockerpriset (mars 2013) föll kraftigt i början av veckan. Den förra botten från januari på 18 cent, fungerade nu som ett stöd. I fredags stängde mars-kontraktet på 18.14 cent per pund. Det är strax över stödet på 18 cent. Trenden är nedåtriktad och kraften av den rörelsen ”bör” enligt beprövad erfarenhet få stödet att brytas, kanske redan i veckan.
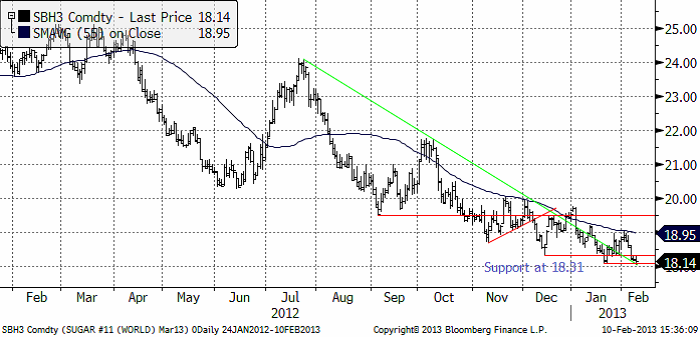
Vi fortsätter med neutral rekommendation på socker, i avvaktan på mer tecken på att prisfallet är över.
[box]SEB Veckobrev Veckans råvarukommentar är producerat av SEB Merchant Banking och publiceras i samarbete och med tillstånd på Råvarumarknaden.se[/box]
Disclaimer
The information in this document has been compiled by SEB Merchant Banking, a division within Skandinaviska Enskilda Banken AB (publ) (“SEB”).
Opinions contained in this report represent the bank’s present opinion only and are subject to change without notice. All information contained in this report has been compiled in good faith from sources believed to be reliable. However, no representation or warranty, expressed or implied, is made with respect to the completeness or accuracy of its contents and the information is not to be relied upon as authoritative. Anyone considering taking actions based upon the content of this document is urged to base his or her investment decisions upon such investigations as he or she deems necessary. This document is being provided as information only, and no specific actions are being solicited as a result of it; to the extent permitted by law, no liability whatsoever is accepted for any direct or consequential loss arising from use of this document or its contents.
About SEB
SEB is a public company incorporated in Stockholm, Sweden, with limited liability. It is a participant at major Nordic and other European Regulated Markets and Multilateral Trading Facilities (as well as some non-European equivalent markets) for trading in financial instruments, such as markets operated by NASDAQ OMX, NYSE Euronext, London Stock Exchange, Deutsche Börse, Swiss Exchanges, Turquoise and Chi-X. SEB is authorized and regulated by Finansinspektionen in Sweden; it is authorized and subject to limited regulation by the Financial Services Authority for the conduct of designated investment business in the UK, and is subject to the provisions of relevant regulators in all other jurisdictions where SEB conducts operations. SEB Merchant Banking. All rights reserved.

Selling down on a ”deal”. Brent crude fell 6.2% last week with accelerated weakness towards the end of the week. Close of the week at $87.33/b and low of the week (and on Friday) of $85.8/b. Brent is falling another 4% this morning to $83.7/b on confirmation by Iran that a MoU text has been reached and that it will be signed on Friday this week.

So what is this ”deal” worth? Talk on the desk here this morning is that it is much like ”putting lipstick on a pig” where Trump has to sell this at home as a victory where ”the SoH has reopened”, the nuclear issue will be ironed out over the coming 60 days (or maybe 600 days?) and US consumers are getting a lower gasoline price and maybe US republicans survives the midterm elections.
The importance for Iran is that it emerges as the defacto winner of this war in the eyes of the non-US public world. That Iran now onwards is the ”ruler of the SoH” (combo of geography and new weapons systems like drones) or more softer: ”the guarantor of safe passage through the SoH”.
Iran doesn’t need nuclear weapons any more. Nuclear deterrence doesn’t work any more. Ukraine has made many attacks deep into Russia without being nuked in return. Plenty of Iranian ballistic rockets blasts over Israel but Iran wasn’t nuked in return.
There is no trust between the US and Iran. We don’t know all the details yet of the MoU. But what we do know is that there is no trust between the US and Iran what so ever. This is probably more like a descriptive text on how they can cooperate in a way where both sides keeps tactical leverage. Neither side makes irreversible concessions. Violations can be punished quickly. Cooperation produces immediate benefits.
This is a fragile structure. It can easily break down. There may be details which cannot be overcome. To be seen on Friday. The US has to show that it is willing put enough force behind managing and restraining Israel versus Hezbollah in Lebanon. We have seen that Netanyahu hasn’t listened all that much to Trump’s directives and wishes. This could be a major obstacle.
A gradual reopening is tactically preferable for Iran. A tactical leverage for Iran right now is that global oil stocks have been drawn down towards painful and increasingly dangerous levels with increasing risks for oil price spikes in mid-July to August. This together with US midterm elections on 3 November gives tactical leverage to Iran. Iran probably doesn’t want to fully give up on that leverage. A rapid, full reopening where global stocks are able to refill over the coming 60 days will significantly erode that leverage. If Iran reinstates a closure of the SoH after 60 days (if talks break down again), then the effect won’t be that impactful in terms of prices and the US midterm elections.
So a gradual and partial reopening where global markets gets the oil they need while they are unable to rebuild stocks could be a practical middle way for both parties. Trump can sell it as ”the SoH has reopened” and get affordable gasoline for US consumers. Iran can sell it as ”the SoH has fully reopened, but there is some friction” so flow is only 60-80% of normal.
Not much real demand destruction below $100/b. What we do know is that there is not much real price pain demand destruction for oil globally at an oil price below $100/b. A lot of demand-shock destruction. Fear. But demand should now come roaring back towards normal with fear for exceptionally high prices now is rapidly receding.
Sudden China demand destruction due to EVs? Bullocks. EV share of total Chinese carpool now around 13%. Share of new sales of EVs has reached 50%. This is a very gradual process. It doesn’t make oil demand fall like a rock over night. When EV new sales share reaches 100%, then the gasoline car pool will contract by some 5-10% per year. But that is only gasoline. Sudden reduction in Chinese oil demand is more about shock and risk.
Chinese crude oil imports will come roaring back. At what price? Today’s ”neutral” oil price is $70/b. That is the five year price which has steadily traded around the $70/b mark over the past 3-4 years. With still a risky picture one would think that China and the rest of the world will be big buyers of oil in the range of $70-85/b.
Global demand will likely snap back towards normal, forecasted demand and growth at such prices.
Physical reopening is a gradual process. The physical and practical reopening of the SoH will likely be gradual rather than sudden. And that probably suites Iran tactically as well.
Brent M1 price versus the Brent 5-yr (today’s ”normal” price)

Market is starting to take US/Iran headlines with a pinch of salt. Brent crude rose $2.8/b yesterday to an official close of $112.1/b. But after that it traded as low as $108.05/b before ending late night at around $109.7/b. Through the day it traded in a range of $106.87 – 112.72/b amid a flurry of news or rumors from Iran and the US. ”US temporary sanctions during negotiations” (falls alarm). ”We will bomb Iran” (not anyhow),… etc. While the market is still fluctuating to this kind of news flow, it is starting to take such headlines with a pinch of salt.
We’ll see. Maybe, maybe not. The Brent M1 contract is trading at $110.2/b this morning which very close to the average ticks through yesterday of $110.4/b.
Trump with bearish, verbal intervention whenever Brent trades above $110/b it seems. What seems to be a pattern is that Trump states something like ”very good negotiations going on with Iran”, ”New leaders in Iran are great,..”, ”Great progress in negotiations,…”, ”Deal in sight,..” etc whenever the Brent M1 contract trades above $110/b. An effort to cool the market. These hot air verbal interventions from Trump used to have a heavy bearish impact on prices, but they now seems to have less and less effect unless they are backed by reality.
As far as we can see there has been no real progress in the negotiations between the US and Iran with both sides still standing by their previous demands.
Iran is getting stronger while the cease fire lasts making a return to war for Trump yet harder. Iran is naturally in constant preparation for a return to war given Trump’s steady threats of bombing Iran again. Iran is naturally doing what ever is possible to prepare for a return to war. And every day the cease fire lasts it is better prepared. This naturally makes it more and more difficult and dangerous for the US to return to warring activity versus Iran as the consequences for energy infrastructure in the Persian Gulf will be more and more severe the longer the cease fire lasts. Israel seems to see it this way as well. That the war is not won and that current frozen state of a cease fire gives Iran opportunity to rebuild military and politically.
Global inventories are drawing down day by day. How much? In the meantime the Strait of Hormuz stays closed. There is varying measures and estimates of how much global inventories are drawing down. Our rough estimate, back of the envelope, is that global inventories are drawing down by at least some 10 mb/d or about 300 mb/d in a balance between loss of supply versus demand destruction. Other estimates we see are a monthly draw of 250-270 mb/d. The IEA only ’measured’ a draw in global observable stocks of 117 mb in April with oil on water rising 53 mb while on shore stocks fell 170 mb. But global stocks are hard to measure with large invisible, unmeasured stocks. As such a back of the envelope approach may be better.
Oil products is what the world is consuming. Oil product prices likely to rise while product stocks fall. Strategic Petroleum Reserves (SPR) are predominantly crude oil. Discharging oil from OECD SPR stocks, a sharp reduction in Chinese crude imports and a reduction in global refinery throughput of 6-7 mb/d has helped to keep crude oil markets satisfactorily supplied. But global inventories are drawing down none the less. And oil products is really what the world is consuming. So if global refinery throughput stays subdued, then demand will eventually have to match the supply of oil products. The likely path forward this summer is a steady draw down in jet fuel, diesel and gasoline. Higher prices for these. Then, if possible, higher refinery throughput and higher usage of crude in response to very profitable refinery margins. And lastly sharper draw in crude stocks and higher prices for these. But some 6 mb/d of oil products used to be exported through the Strait of Hormuz. And it may not be so easy to ramp up refinery activity across the world to compensate. Especially as Ukraine continues to damage Russian refineries as well as Russian crude production and export facilities.
Watch oil product stocks and prices as well as Brent calendar 2027. What to watch for this summer is thus oil product inventories falling and oil product premiums to crude rising. Another measure to watch is the Brent crude 2027 contract as it rises steadily day by day as the Strait of Hormuz stays closed and global oil inventories decline. The latter is close to the highest level since the start of the war and keeps rising.
The Brent M1 contract and the Brent 2027 prices and current price of jet fuel in Europe (ARA). All in USD/b

Our back of the envelope calculation of the global shortage created by the closure of the Strait of Hormuz. Note that 3.5 mb/d of discharge from SPR is also a draw. Note also that ’Forced demand loss’ of 2.5 mb/d is probably temporary and will fall back towards zero as logistics are sorted out leaving ’Price demand loss’ to do the job of balancing the market. Thus a shortfall of at least 9 mb/d created by the closure. More if SPR discharge is included and more if Forced demand loss recedes.

Brent is climbing higher. Front-month is at USD 106.3/bl this morning, close to a weekly high and a USD 9/bl jump from Mondays open. This is the move we flagged as a risk earlier in the week: the market shifting from ”a deal is around the corner” to ”this is going to take longer than we thought”.

Analyst Commodities, SEB
During April, rest-of-year Brent remained remarkably stable around USD 90/bl. A stability which rested on one single assumption: the SoH reopens around 1 May. That assumption is now slowly falling apart.
As we highlighted yesterday: every week of delay beyond 1 May adds (theoretically) ish USD 5/bl to the rest-of-year average, as global inventories draw 100 million barrels per week. i.e., a mid-May reopening implies rest-of-year Brent closer to USD 100/bl, and anything pushing into June or July takes us meaningfully higher.
What’s changed in the last 48 hours:
#1: The US military has formally warned that clearing suspected sea mines from SoH could take up to six months. That is a completely different timescale from what the financial market is pricing. Even a political deal tomorrow does not immediately reopen the strait.
#2: Trump has shifted his tone from urgency to ”strategic patience”. In yesterday’s press conference: ”Don’t rush me… I want a great deal.” The market is reading this as a president no longer feeling pressured by timelines, with the naval blockade running in the background.
#3: So far, the military activity is escalating, not de-escalating. Axios reports Iran is laying more mines in SoH. The US 3rd carrier strike group (USS George H.W. Bush) is arriving with two countermine vessels. Trump yesterday ordered the US Navy to destroy any Iranian boats caught laying mines. While CNN reports that the Pentagon is actively drawing up plans to strike Iranian SoH capabilities and individual Iranian military leaders if the ceasefire collapses. i.e., NOT a attitude consistent with an imminent deal!
Spot crude and product prices eased off the early-April highs on a combination of system rerouting and deal optimism. Both now weakening. Goldman estimates April Gulf output is reduced by 14.5 mbl/d, or 57% of pre-war supply, a number that keeps getting worse the longer this drags on.
Demand-side adaptation is ongoing: S. Korea has cut its Middle East crude dependence from 69% to 56% by pulling more from the Americas and Africa, and Japan is kicking off a second round of SPR releases from 1 May. But SPRs are finite.
Ref. to the negotiations, we should not bet on speed. The current Iranian leadership is dominated by genuine hardliners willing to absorb economic pain and run the clock to extract concessions. That is not a setup for a rapid resolution. US/Israeli media briefings keep framing the delay as ”internal Iranian divisions”, the reality is more complicated and points toward weeks and months, not days.
Our point is that the complexity is large, and higher prices have only just started (given a scenario where the negotiations drag out in time). The market spent April leaning on the USD 90/bl rest-of-year assumption; that case is diminishing by the hour. If ”early May reopening” is replaced by ”June, July or later” over the next week or two, both crude and products have meaningful room to reprice higher from here. There is a high risk being short energy and betting on any immediate political resolution(!).


Vattenfalls och Industrikrafts kärnkraftsbolag Videberg Kraft har valt Rolls-Royce SMR
Selling down on a ”deal”

Sommarväder skapar prisrally på elbörsen
Oil product price pain is set to rise as the Strait of Hormuz stays closed into summer

Solkraften pressar elpriserna dagtid
Oil product price pain is set to rise as the Strait of Hormuz stays closed into summer
Sommarväder skapar prisrally på elbörsen
Vattenfalls och Industrikrafts kärnkraftsbolag Videberg Kraft har valt Rolls-Royce SMR
Selling down on a ”deal”
-
Analys4 veckor sedan
Oil product price pain is set to rise as the Strait of Hormuz stays closed into summer
-
Nyheter2 veckor sedan
Sommarväder skapar prisrally på elbörsen
-
 Nyheter2 dagar sedan
Vattenfalls och Industrikrafts kärnkraftsbolag Videberg Kraft har valt Rolls-Royce SMR
-
Analys2 dagar sedan
Selling down on a ”deal”