Analys
Swede Resources – Från mygga till jätte?
 I och med förvärvet av flera leaseområden på Texas Gulfkust har Swede Resources sadlat om helt; från producerande bolag till leaseägare. Chansen finns nu för en kraftig intäktsökning som bygger på andras investering i brunnar på leaseområdet. Detta är extremt lönsamt för Swede Resources då de teoretiskt sett kan undanhålla sig från egna investeringar på leaseområdet och passivt samla in leaseavgifter från investerare i brunnar på området. Upplägget ser ut som sådant att Swede Resources och övriga leaseägare har rätt till hela 25% av vinsten från eventuella brunnar på området, och i nuläget kontrollerar Swede Resources 83,2% av leaserna.
Vår prognos innebär en negativ EBITDA för 2012, ett år som emellertid bör ses som ett mellanår. Till följd av en höjd investeringstakt samt bortfall av avskrivningar stiger vinsten och EBITDA kraftigt 2013. Bolaget värderas till P/E 9,1 och 3,3 för 2013 respektive 2014. Potentialen kan tyckas liten sett till vinsten för 2013, men i förhållande till den kraftiga tillväxten, samt det faktum att bolaget bygger upp en relativt stadig intäktsbas som inte kräver några egna investeringar är bolaget en extremt intressant investering på lång sikt. Axiers DCF-analys av utdelningar 2012 och framåt ger ett motiverat värde på 1,63 SEK per aktie.
Beskrivning av verksamheten
Swede Resources är ett gas- och oljebolag verksamt i USA och Ungern. Bolaget grundades 2001, och vid denna tidpunkt varierade andelarna i de olika projekten mellan 0,25-0,5%. De senaste åren har andelarna vuxit till mellan 5% och 10 %. I USA har bolaget ett starkt kontaktnät, och det är följaktligen där bolaget har större delen av sin verksamhet. Verksamheten i Ungern utgörs främst av gasprojektet Péneszlek, med producerande brunnar PEN-101 och PEN-105. Emellertid är inte längre rena investeringar i brunnar den mest intressanta delen av Swede Resources. Under sommaren 2011 inledde bolaget förvärv av leaseområden vid Texas Gulfkust. Till en början förvärvades 5 leaseområden uppgående till 50 acres, och i dagsläget kontrollerar bolaget 312,5 acres. Den första borrningen på leaseområdet väntas börja under våren/sommaren.
Swede Resources har i nuläget inga anställda. Bolaget drivs istället på konsultbasis av Ulrich & Co – ett av VD Ulrich Andersson helägt bolag. I nuläget har Swede Resources därmed i stort sett obefintliga personalkostnader. Det krävs därför inget större genombrott för att bolaget ska redovisa en jämförelsevis hög vinst.
Axier Review
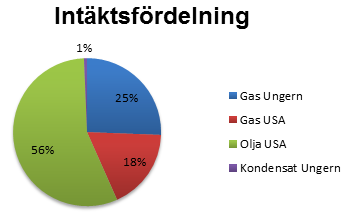
Rapporten för det fjärde kvartalet 2011 visade på en viss nedgång i intäkter för Swede Resources, något som till stor del består på tillfälliga faktorer. Delvis har gaspriset rasat i USA, men oljepriset och det ungerska gaspriset har hållit sig stabilt eller stigit under perioden. Det sjunkande gaspriset i USA har minskat bolagets viktning mot gasproduktion i USA, och större delen av bolagets intäkter beror i nuläget på oljepriset (det ungerska gaspriset baseras på historiska oljepris).
USA – leasområdena i fokus
Arbetet med Swede Resources leaseområden på High Island på Texas Gulfkust fortlöper och i slutet på 2011 tecknades bland annat ett operatörsavtal med CasKids Operating Company. Swede Resources har fortfarande en andel på 83,2% i leaserna, och väntas kunna bibehålla denna trots ökande kapitalbehov. Under 2011 avyttrades 16,8% av leaserna för ca 3,4 MSEK med en reavinst på 3,2 MSEK. Det innebär att leaserna i dagsläget innehar ett dolt övervärde på knappt 16 MSEK (totalt värde på ca 17 MSEK). Det är ett relativt lättrealiserat värde, vilket innebär en buffert mot kapitalbrist för bolaget.
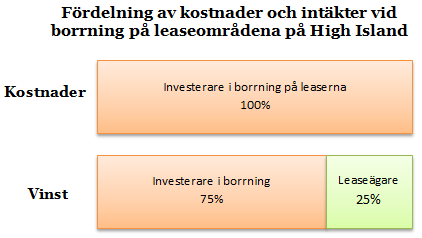
Borrningar är extremt kostsamma och vid årsskiftet hade Swede Resources enbart 2,2 MSEK i kassan. Det ska emellertid sägas att Swede Resources kan göra en aktiv avvägning kring hur stor andel bolaget vill ha i brunnar på det egna leaseområdet. Bolagets kapitalbehov för leaseutvecklingen är således avhängigt hur stora andelar de väljer att ta i borrningarna på området, så länge intresse kan väckas för investering i borrningarna. Att ta steget från att vara investerare i enstaka brunnar till att agera leaseägare är ett stort steg för Swede Resources. Det kan dessutom bli en väldigt lönsam saga, som ändrar hela bolagets affärsupplägg. Ägare av leaserna har rätt till 25% av vinsten från eventuella borrningar på leaseområdet. Övriga 75% går till investerare i den specifika brunnen. Dessa investerare måste emellertid stå för 100% av kostnaderna.
I nuläget utgör borrstart på leaseområdena på High Island den största triggern i Swede Resources, men bolaget driver även en del amerikanska projekt vid sidan lease-projektena. Produktionstesterna från borrningen av brunnen Mc Kee #1 som genomfördes under sommaren 2011 är fortfarande inte klara, och kan tänkas dra ut på tiden. Arbetet har bland annat förskjutits till följd av ett operatörsbyte. Mc Kee #1 förväntades vid borrstart nå en produktion på 120 fat olja och 3000 mcf gas per dag. För Swede Resources med sin andel på 1% skulle detta innebära intäkter på ca 400 000 – 450 000 kronor per år. Det är ingen enorm summa, men skulle innebära ett relativt kraftigt lyft i förhållande till förra årets omsättning på 2,9 MSEK. Emellertid finns en risk för att hela projektet går i sank.
Tidigare var Swede Resources paradprojekt i USA investeringen i ett blandat olje- och gasprojekt i Cimarron County Oklahoma. Den första av borrningarna var Jenkins 1-14 vilken genomfördes under sommaren 2010. Efter mycket problem ligger denna brunn nu i startgroparna för att börja producera. Produktionstillstånd har skickats in till myndigheterna i Oklahoma och ett godkännande är allt som krävs för att starta produktionen. Tidigare har Swede Resources uttryckt höga förväntningar på Jenkins 1-14, och förhoppningsvis kommer ett godkännande för produktionsstart inom kort. Ägarandelen i brunnen är 2,5%. Faller allting väl ut kommer Jenkins 1-14 att följas av fler borrningar på området.
Ungern – temporärt produktionstapp
Mot slutet av 2011 började produktionen från Péneszlek-området i Ungern att falla. I slutet av året låg produktionen från fältet på 400-500 mcf/månad mot ca 1 000 mcf/månad vid årets början. Detta beror i hög grad på att en förkastning stängt in en gasreservoar i PEN-105, den ena av bolagets två brunnar på området. I slutet på mars inleddes borrningen av ett sidetrack till brunnen. Borrningen resulterade i frigörandet av en indikerad gasficka, vilket ökade produktionen samt förlängde livslängden på brunnen. Initialt producerade 982 mcf/dag efter borrningen av sidetracket, av vilket ca 600 mcf/månad tillfaller Swede Resources. Det innebär att produktionen bör kunna återgå till nivån som rådde under början av 2011. Till skillnad från gaspriset i USA har dito i Ungern dessutom fortsatt att stiga i slutet på 2011 och början på 2012, och ligger i nuläget på ca 14 USD/mcf. Detta är betydligt högre än de cirka 2 USD/mcf producenter erhåller för gas i USA, och beror på det faktum att gaspriset i Ungern är kopplat till oljepriset.
Ytterligare ett intressant projekt i Ungern är Swede Resources andel i det 1990 kvadratkilometer stora området Igal-II. Genom bolaget Pelsolaj kft kontrollerar Swede Resources hela 10% av projektet.
Stora dolda värden
Swede Resources är svårt att värdera utifrån oljereserver i och med att bolaget inte tillgängliggörs sådana siffror från sina projekt i USA. Bolagets oljeprojekt redovisas som materiella anläggningstillgångar, och är där enbart värderade till den investerade summan minus avskrivningar. Misslyckade investeringar skrivs av direkt vilket innebär att redovisade tillgångar generellt sett har ett verkligt värde över det investerade. Vid årsskiftet uppgick redovisade materiella anläggningstillgångar till drygt 18 MSEK, vilket trots dolda övervärden är en bit över dagens värdering av Swede Resources. Det dolda värdet i High Island-leaserna bör dessutom vid värdering av Swede Resources adderas till tillgångarna då avyttring av andelar i leaserna inte är ett alltför stort arbete. Enligt denna modell uppgick substansvärdet på bolagets tillgångar till drygt 36 MSEK vid årsskiftet. Substansrabatten i och med dagens värdering av Swede Resources på 13,6 MSEK ligger därmed på hela 63%. Swede Resources värderas till 0,62 gånger det egna kapitalet, vilket innebär att tillgångarna värderas lågt även med övervärdet i leaserna borträknat.
Prognoser och värdering
EBITDA och resultat var som väntat negativt under det fjärde kvartalet 2011, och kommer troligtvis att ligga på liknande nivåer fram till det tredje kvartalet i år. Siffrorna för det sista kvartalet 2011 ser dessutom ovanligt dystra ut till följd av ett tillfälligt fall i nettomarginalen för bolagets produktion. Delvis har ett kraftigt fallande gaspris i USA påverkat marginalerna negativt, men till stor del beror marginalfallet på sådant som det tillfälliga produktionstappet i Ungern, oväntade underhållsarbeten och dylikt. Vi har inte gjort några större justeringar i våra prognoser baserat på rapporten för det fjärde kvartalet 2011. En viss justering har gjorts för det temporära produktionsfallet i Ungern. Utöver en viss justering för återhämtning av produktionen i Ungern bygger våra prognoser enbart på utveckling av leaseområdena på High Island.
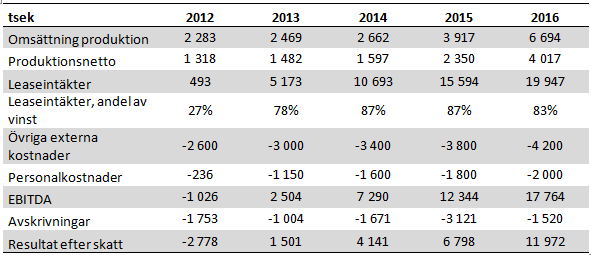
Inledningsvis väljer vi att vara relativt försiktiga i våra prognoser (se tabell ovan). Vi har valt att anta enbart en borrning på leaserna per kvartal jämfört med väntade 1-2. Sker borrningarna i en snabbare takt kommer våra prognoser att behöva revideras upp kraftigt. Det bör även nämnas att Swede Resources på sikt kan belåna investeringarna och på så vis nå högre avkastning.
Prognos 2012 – 2015
Något som inte kommer att förbättra kassaflödet men däremot resultatet efter skatt kraftigt är den slutförda avskrivningen av ägarandelen i det ungerska bolaget Petro Pequnia. Tillgången skrivs av under en treårsperiod och kommer att vara fullt avskriven i mitten på 2012. Denna avskrivning har belastat resultatet med knappt 2 miljoner årligen. I förhållande till dagens värdering av Swede Resources på 13,6 miljoner kronor kommer detta avskrivningsbortfall att ha betydande effekt på resultatet, något som syns tydligt i 2013 års siffror.
2012 kommer att bli ett mellanår för Swede Resources i och med att borrprogrammet på leaseområdet High Island tar fart först under årets andra halva. 2013 lyfter resultatet, men det är på sikt den stora potentialen finns i Swede Resources. Att bolaget bygger upp ett stadigt intäktsflöde från andras investeringar på det egna leaseområdet har potential att skapa en snöbollseffekt. Intäktsbasen kommer att öka kontinuerligt, med förbehåll för eventuella mekaniska problem eller ett sjunkande oljepris. Att de ökande intäkterna i teorin inte kräver investeringar från Swede Resources sida ger potential till stora utdelningar när snöbollen väl har satts i rullning.
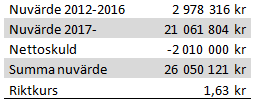
Swede Resources har ännu inte beslutat om framtida utdelningar. Ovan har vi räknat med att 40% av vinsten delas ut från och med 2014 (2013 års vinst), och beräknad WACC är 15%. Vår riktkurs sätts till 1,63 SEK vilket innebär en potential på drygt 90%. Notera att detta enbart är baserat på potentiell utdelning och inte fritt kassaflöde.
TO 4B
Under 2011 gav Swede Resources ut vederlagsfria teckningsoptioner, vilket innebär att det idag finns två sätt att investera i bolaget. 5 teckningsoptioner ger rätt till att teckna 1 ny aktie i Swede Resources till genomsnittskursen under 2012-02-01 – 2012-04-27 minus 20%.
Teckningsperioden är 1 – 31 maj 2012. Totalt kan 3 226 214 B-aktier komma att tecknas för, vilket ytterligare innebär en kapitalbuffert för bolaget. I nuläget kostar en teckningsoption 3 öre, vilket innebär att kostnaden för rätten att teckna en aktie är 15 öre.
Axiers bedömning
Swede Resources värderas i nuläget till en rabatt på eget kapital på knappt 40%. Detta trots betydande övervärden i bolagets projekt – framförallt i bolagets nyförvärvade lease där det dolda övervärdet ligger på cirka 16 MSEK, enbart detta en bit över dagens värdering av Swede Resources. Vår DCF-värdering av utdelningar från 2012 och framåt ger oss en riktkurs på 1,63 SEK per aktie, en bra bit över dagens kurs. Det ska emellertid sägas att någon utdelning med högsta sannolikhet inte kommer att bli aktuell förrän i början på 2014, således om två år.
Brunnar i närliggande områden till Swede Resources lease i Texas håller i stort sett en konstant produktionsnivå vilket innebär att en relativt stadig intäktsbas från leaseintäkter kommer att byggas upp under kommande år. Intäkter från leaseägandet medför dessutom knappt några kostnader för Swede Resources. Att bolaget kan välja att ta små andelar i de första borrningarna på leaseområdet stärker vår tro på att Swede Resources kommer att klara hela utvecklingsarbetet utan kapitaltillskott, och Swede Resources bör till och med kunna vidmakthålla sin nuvarande andel i leaserna.
Med dagens höga oljepris har brunnar på leaseområdet på High Island en återbetalningstid på 3-5 år samt relativt stabil avkastning under 20 år, vilket innebär att investeringsviljan inte torde vara något problem. Faller den första borrningen på området väl ut kommer resten att flyta på av sig självt för Swede Resources. Den lilla oljemyggan har på några års sikt möjlighet att bli en etablerad oljeaktör. Axier rekommenderar köp delvis på kort sikt då borrningsstart på leaseområdet kommer att innebära en skjuts upp för aktien, men framförallt kan Swede Resources bli en exceptionellt bra investering på lång sikt.
[hr]
Axier Equities har av styrelsen i Swede Resources anlitats för att underlätta kommunikationen med svenska kapitalplacerare och nyhetsmedier. En av de uppgifter som Axier Equities har är att vara styrelsen behjälplig att kommunicera nyheter och rapporter till placerarkollektivet, bland annat i form av denna analys.
Vare sig Axier Equity eller någon av Axiers anställda eller frilansande analytiker äger aktier i Swede Resources. Samtliga eventuella förändringar av innehav i Swede Resources kommer att rapporteras löpande.
Analys
Tightening fundamentals – bullish inventories from DOE

The latest weekly report from the US DOE showed a substantial drawdown across key petroleum categories, adding more upside potential to the fundamental picture.

Commercial crude inventories (excl. SPR) fell by 5.8 million barrels, bringing total inventories down to 415.1 million barrels. Now sitting 11% below the five-year seasonal norm and placed in the lowest 2015-2022 range (see picture below).
Product inventories also tightened further last week. Gasoline inventories declined by 2.1 million barrels, with reductions seen in both finished gasoline and blending components. Current gasoline levels are about 3% below the five-year average for this time of year.
Among products, the most notable move came in diesel, where inventories dropped by almost 4.1 million barrels, deepening the deficit to around 20% below seasonal norms – continuing to underscore the persistent supply tightness in diesel markets.
The only area of inventory growth was in propane/propylene, which posted a significant 5.1-million-barrel build and now stands 9% above the five-year average.
Total commercial petroleum inventories (crude plus refined products) declined by 4.2 million barrels on the week, reinforcing the overall tightening of US crude and products.


Analys
Bombs to ”ceasefire” in hours – Brent below $70

A classic case of “buy the rumor, sell the news” played out in oil markets, as Brent crude has dropped sharply – down nearly USD 10 per barrel since yesterday evening – following Iran’s retaliatory strike on a U.S. air base in Qatar. The immediate reaction was: “That was it?” The strike followed a carefully calibrated, non-escalatory playbook, avoiding direct threats to energy infrastructure or disruption of shipping through the Strait of Hormuz – thus calming worst-case fears.

After Monday morning’s sharp spike to USD 81.4 per barrel, triggered by the U.S. bombing of Iranian nuclear facilities, oil prices drifted sideways in anticipation of a potential Iranian response. That response came with advance warning and caused limited physical damage. Early this morning, both the U.S. President and Iranian state media announced a ceasefire, effectively placing a lid on the immediate conflict risk – at least for now.
As a result, Brent crude has now fallen by a total of USD 12 from Monday’s peak, currently trading around USD 69 per barrel.
Looking beyond geopolitics, the market will now shift its focus to the upcoming OPEC+ meeting in early July. Saudi Arabia’s decision to increase output earlier this year – despite falling prices – has drawn renewed attention considering recent developments. Some suggest this was a response to U.S. pressure to offset potential Iranian supply losses.
However, consensus is that the move was driven more by internal OPEC+ dynamics. After years of curbing production to support prices, Riyadh had grown frustrated with quota-busting by several members (notably Kazakhstan). With Saudi Arabia cutting up to 2 million barrels per day – roughly 2% of global supply – returns were diminishing, and the risk of losing market share was rising. The production increase is widely seen as an effort to reassert leadership and restore discipline within the group.
That said, the FT recently stated that, the Saudis remain wary of past missteps. In 2018, Riyadh ramped up output at Trump’s request ahead of Iran sanctions, only to see prices collapse when the U.S. granted broad waivers – triggering oversupply. Officials have reportedly made it clear they don’t intend to repeat that mistake.
The recent visit by President Trump to Saudi Arabia, which included agreements on AI, defense, and nuclear cooperation, suggests a broader strategic alignment. This has fueled speculation about a quiet “pump-for-politics” deal behind recent production moves.
Looking ahead, oil prices have now retraced the entire rally sparked by the June 13 Israel–Iran escalation. This retreat provides more political and policy space for both the U.S. and Saudi Arabia. Specifically, it makes it easier for Riyadh to scale back its three recent production hikes of 411,000 barrels each, potentially returning to more moderate increases of 137,000 barrels for August and September.
In short: with no major loss of Iranian supply to the market, OPEC+ – led by Saudi Arabia – no longer needs to compensate for a disruption that hasn’t materialized, especially not to please the U.S. at the cost of its own market strategy. As the Saudis themselves have signaled, they are unlikely to repeat previous mistakes.
Conclusion: With Brent now in the high USD 60s, buying oil looks fundamentally justified. The geopolitical premium has deflated, but tensions between Israel and Iran remain unresolved – and the risk of missteps and renewed escalation still lingers. In fact, even this morning, reports have emerged of renewed missile fire despite the declared “truce.” The path forward may be calmer – but it is far from stable.
Analys
A muted price reaction. Market looks relaxed, but it is still on edge waiting for what Iran will do

Brent crossed the 80-line this morning but quickly fell back assigning limited probability for Iran choosing to close the Strait of Hormuz. Brent traded in a range of USD 70.56 – 79.04/b last week as the market fluctuated between ”Iran wants a deal” and ”US is about to attack Iran”. At the end of the week though, Donald Trump managed to convince markets (and probably also Iran) that he would make a decision within two weeks. I.e. no imminent attack. Previously when when he has talked about ”making a decision within two weeks” he has often ended up doing nothing in the end. The oil market relaxed as a result and the week ended at USD 77.01/b which is just USD 6/b above the year to date average of USD 71/b.

Brent jumped to USD 81.4/b this morning, the highest since mid-January, but then quickly fell back to a current price of USD 78.2/b which is only up 1.5% versus the close on Friday. As such the market is pricing a fairly low probability that Iran will actually close the Strait of Hormuz. Probably because it will hurt Iranian oil exports as well as the global oil market.
It was however all smoke and mirrors. Deception. The US attacked Iran on Saturday. The attack involved 125 warplanes, submarines and surface warships and 14 bunker buster bombs were dropped on Iranian nuclear sites including Fordow, Natanz and Isfahan. In response the Iranian Parliament voted in support of closing the Strait of Hormuz where some 17 mb of crude and products is transported to the global market every day plus significant volumes of LNG. This is however merely an advise to the Supreme leader Ayatollah Ali Khamenei and the Supreme National Security Council which sits with the final and actual decision.
No supply of oil is lost yet. It is about the risk of Iran closing the Strait of Hormuz or not. So far not a single drop of oil supply has been lost to the global market. The price at the moment is all about the assessed risk of loss of supply. Will Iran choose to choke of the Strait of Hormuz or not? That is the big question. It would be painful for US consumers, for Donald Trump’s voter base, for the global economy but also for Iran and its population which relies on oil exports and income from selling oil out of that Strait as well. As such it is not a no-brainer choice for Iran to close the Strait for oil exports. And looking at the il price this morning it is clear that the oil market doesn’t assign a very high probability of it happening. It is however probably well within the capability of Iran to close the Strait off with rockets, mines, air-drones and possibly sea-drones. Just look at how Ukraine has been able to control and damage the Russian Black Sea fleet.
What to do about the highly enriched uranium which has gone missing? While the US and Israel can celebrate their destruction of Iranian nuclear facilities they are also scratching their heads over what to do with the lost Iranian nuclear material. Iran had 408 kg of highly enriched uranium (IAEA). Almost weapons grade. Enough for some 10 nuclear warheads. It seems to have been transported out of Fordow before the attack this weekend.
The market is still on edge. USD 80-something/b seems sensible while we wait. The oil market reaction to this weekend’s events is very muted so far. The market is still on edge awaiting what Iran will do. Because Iran will do something. But what and when? An oil price of 80-something seems like a sensible level until something do happen.
-

 Nyheter4 veckor sedan
Uppgången i oljepriset planade ut under helgen
-

 Nyheter3 veckor sedan
Mahvie Minerals växlar spår – satsar fullt ut på guld
-

 Nyheter4 veckor sedan
Låga elpriser i sommar – men mellersta Sverige får en ökning
-

 Nyheter2 veckor sedan
Oljan, guldet och marknadens oroande tystnad
-

 Nyheter2 veckor sedan
Jonas Lindvall är tillbaka med ett nytt oljebolag, Perthro, som ska börsnoteras
-

 Analys4 veckor sedan
Very relaxed at USD 75/b. Risk barometer will likely fluctuate to higher levels with Brent into the 80ies or higher coming 2-3 weeks
-

 Analys3 veckor sedan
A muted price reaction. Market looks relaxed, but it is still on edge waiting for what Iran will do
-

 Nyheter2 veckor sedan
Domstolen ger klartecken till Lappland Guldprospektering


