

Analys
SEB – Råvarukommentarer, 7 april 2014

Rekommendationer
Kort sammanfattning
Ädelmetaller, med palladium och platina som främsta val, är de vi är mest positiva till just nu. Ädelmetaller gynnas när tillväxten i världen är svagare än vad centralbankerna hoppats på, vilket innebär att (monetära) stimulanser fortsätter att vara aktuella. Platina och palladium gynnas dessutom extra av dålig lönsamhet i den sydafrikanska gruvproduktionen och arbetsmarknadskonflikterna, samt av oron för utbudet från Ryssland.
Prospective Plantings-rapporten från USDA i måndags för en vecka sedan gör att spannmål, främst majs, men även vete, bör vara väl understödda prismässgt under året 2014/15 som kommer. Jordbruksprodukterna går nu in i sin mest känsliga fas. Vädret under april, maj och juni brukar ha en avgörande inverkan på priserna under året.
SEB har noterat nya BULL och BEAR med fem gångers hävstång, ”X5”. De är för placerare som vill ta ännu mer risk än vad X4:orna erbjuder.
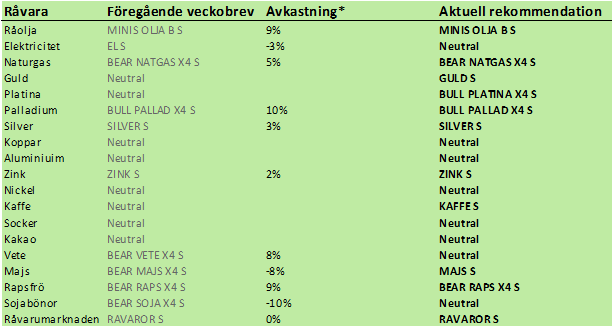
Råolja – Brent
Oljepriset föll ner till 104 dollar i veckan, men rekylerade sedan upp, till vad vi tror är ett nytt säljtillfälle. I Libyen har man återigen kommit till en slags samförstånd. Oljemarknaden närmar sig den säsongsmässigt svagaste tiden på året.
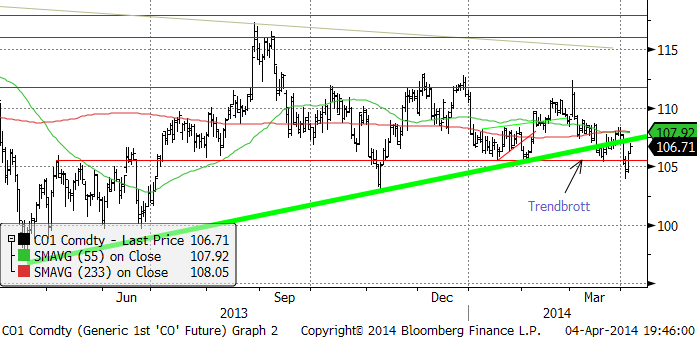
På lite längre sikt hopar sig molnen för oljepriset. Antalet borr-riggar i USA, statistik som Baker Hughes publicerar klockan 19 CET varje fredag, steg i fredags till den högsta nivån sedan slutet av 2012. Sedan förra veckobrevet har antalet riggar ökat från 1803 till 1818.
Råoljelagren minskade något i USA i veckans DOE-rapport. Importen sjönk däremot till en ny bottennivå.
Vi rekommenderar en kort position i olja, t ex med MINIS OLJA B S eller MINIS OLJA A S.
Elektricitet
Vändningen uppåt kom återigen på skam och en ny teknisk säljsignal registrerades under fredagens handel. Väderleksprognosen visar fortsatt nederbörd över det normala över Skanderna de kommande två veckorna. Temperaturen är mild. Hydrologisk balans är något över det normala, men det beror på att vattnet i rask takt omvandlas till kraft. Under årets första 13 veckor är nettoexporten från Sverige 6.8 TWh. Det är den största exporten åtminstone sedan elmarknaden avreglerades år 1996. Exporten är dubbelt så stor som motsvarande period förra året.
Phelix Baseload för det tredje kvartalet, Tysklands motsvarande kontrakt som tredje kvartalet på Nasdaq Commodities, ligger nu 34% över det nordiska. Det är alltså den nordiska marknaden som är ovanligt billig.
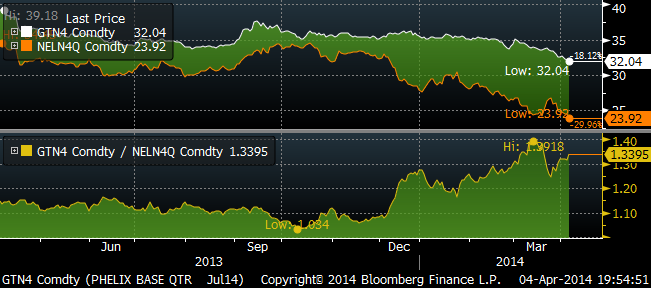
Priset på utsläppsrätter har kollapsat efter den politiskt drivna prisuppgången i början av året. I januari steg priset från 4.75 till 7.41 euro per ton som högst i början på mars. Därefter, kanske på grund av Rysslands angrepp på Ukraina och det uppvaknande detta är för energipolitiken i EU, föll priset i mars till under 4 euro som lägst. Just nu hänger priset på 4.74 euro per ton, men tekniskt ser det ut som om de som sålde ner rätterna till under 4 euro har mer rätt.
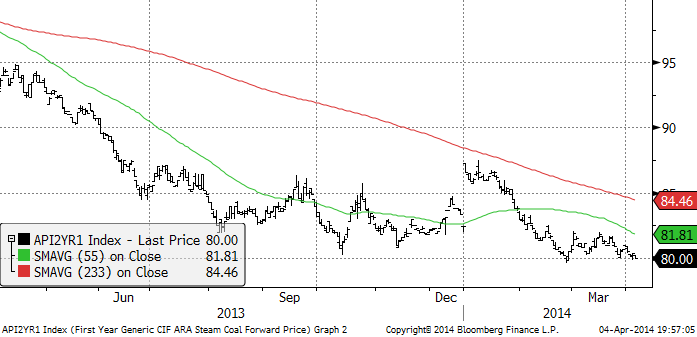
Priset på kol har stabiliserat sig på 80 dollar, som är en teknisk stödnivå. Lägre toppar med 80 som stöd varnar dock om att sentimentet är negativt.
På kort sikt ser elpriset ut att kunna gå ännu lägre, därför går vi över till neutral rekommendation igen. Vi vill inte rekommendera en kort position, därför att priset är så lågt i ett historiskt perspektiv.
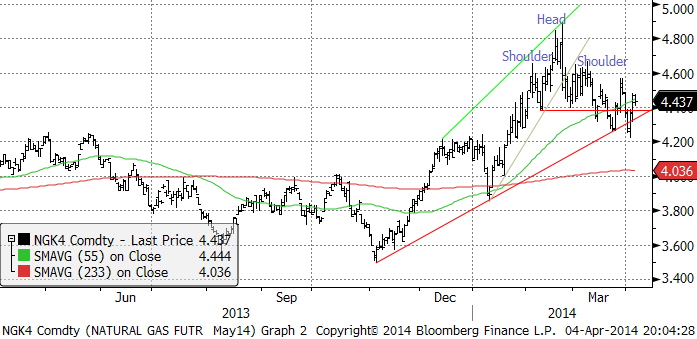
Naturgas
Den tekniska ”huvud-skuldra” formation som vi skrev om i det förra veckobrevet har inte utvecklat sig som det skulle. Istället har marknaden gått in i en konsolideringsfas på en nivå något under toppnoteringen. Än är det dock lite för tidigt att ändra uppfattning. Det ser fortfarande ut som om trenden är nedåtriktad.
Koppar
Kopparpriset fortsatte att rekylera uppåt för den tredje veckan i rad, men rekylen är nog just en sådan. De flesta tvivlar på den underliggande styrkan i marknaden. I fredags handlade marknaden svag inför stängning, vilket faktiskt medförde att börsen stängde på en lägre nivå än veckan innan. Skulle det bli en ytterligare uppgång, kommer aktörer att utnyttja tillfället för att sälja.
Inte ens veckans jordbävning i Chile kunde påverka priset mer än marginellt. Även om inga skador tycks ha vållats kopparproduktionen, skulle en sådan händelse haft en större påverkan i en mer positiv marknad. Chile står för drygt 20% av global kopparproduktion. Den lama reaktionen måste tolkas som ett svaghetstecken. Andra produktionsstörningar som kommer att påverka marknaden de kommande månaderna (runt 80 kt enligt Metal Bulletin), struntar marknaden i. Det är dock en fråga om hur lågt kineserna kan låta priset gå. På föregående nerställ av den här magnituden har kinesiska konsumenter tagit tillfället i akt och köpt på sig reserver, eftersom koppar är en så strategisk resurs för landet. Kanske spelar kreditproblemen i Kina in den här gången, men eventuella köp från kinesiskt håll är en faktor att beakta. Med det sagt, ser den tekniska bilden sådan ut att ett nytt test av bottennoteringen i mars kan vara nära förestående.
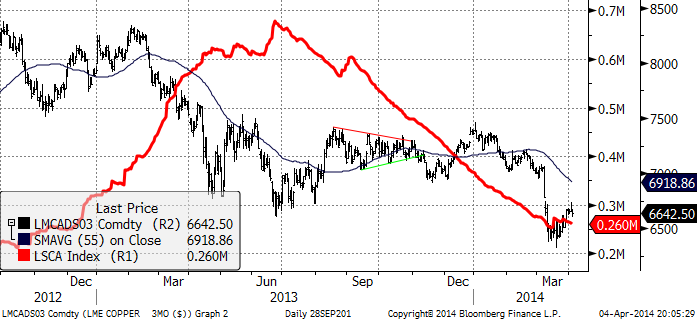
Vi rekommenderar kortsiktigt sälj på koppar.
Aluminium
LME:s förslag för att minska väntetiden för att plocka ut metall från LME:s lagerhus klandrades i domstol av lagerhusen. Den 27 mars föll domen. Sedan dess har terminspriset på aluminium gått upp med 100 dollar på LME. Orsaken är den kortsiktiga effekten på utbudet (från lagerhusen), snarare än en förändring i den långsiktiga fundamentala balansen. Nu är det fortfarande oklart vad som kommer att hända och marknaden väntar på besked från LME. Ingenting har hörts än. De flesta observatörer anser dock att det är osannolikt att lagerhusen kommer att försöka attrahera ännu mer metall. Så när allt kommer omkring har ingenting förändrats. Intressant nog har den fysiska premien inte förändrats. Det finns bara en liten höjning för fysisk metall i Mellanvästern.
Förra veckan besked om produktionsneddragningar i Brasilien (150 kt / år) föll i skuggan av fokuset på lagerproblematiken, men återspeglar den successiva minskning av produktionen som påverkar marknaden på längre sikt. Vi tror dock att det är lite för tidigt för en uppgång av större betydelse i priset.
Tekniskt ser utvecklingen mer positiv ut, men priset balanserar på ett tekniskt stöd i den långsiktiga fallande trenden. Somliga analytiker pekar på att 200-dagars glidande medelvärde har brutits och fäster stor vikt vid det. Vi håller med om att en trendförändring kan vara förestående, men tror det är mer sannolikt med en kortsiktig rekyl mot 1,800 dollar.
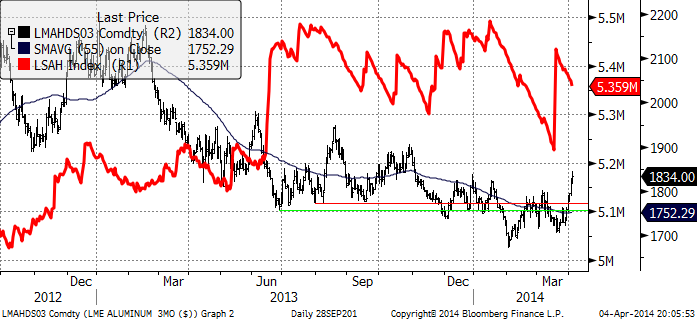
Vi fortsätter med neutral rekommendation på aluminium.
Zink
Zinkmarknaden har handlats omotiverat svagt. Zink har i viss utsträckning infekterats av utvecklingen i kopparmarknaden. Det kan bero på att båda metallerna hålls som pant i finansieringsaffärer i Kina, även om det för zink sker i mycket mindre utsträckning. I veckan som gick påminde ILZSG om den förbättrande fundamentala balansen. ILZSG förutspår en produktionsökning med 4.4% till 13.41 mt under 2014. Användningen ökar med 4.5% till 13.58 mt. Detta innebär att det blir ett underskott på 117 kt. Detta är i linje med den trend vi har sett den senaste tiden och som också återspeglar sig i den kontinuerliga minskningen av LME-lagren. Den senaste tiden har dock material också kommit till ytan, förmodligen material som lämnar finansieringsaffärer när terminskurvans contango minskat. Det kommer att bli intressant att se lagerrörelserna runt den 3:e onsdagen i april – om korta terminspositioner kommer att levereras på, eller rullas framåt. Säsongsmässigt ökande aktivitet i byggsektorn borde gynna zinkpriset de kommande månaderna, men om kopparmarknaden fortsätter att utvecklas svagt, ska man vara varse att det finns en smitta, omotiverat eller inte, från den marknaden till zink.
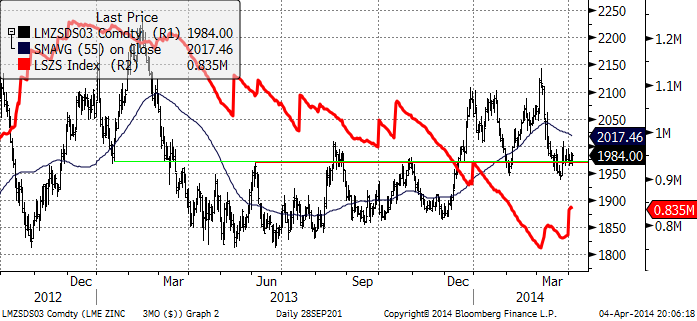
Vi rekommenderar köp av ZINK S eller BULL ZINK X4 S.
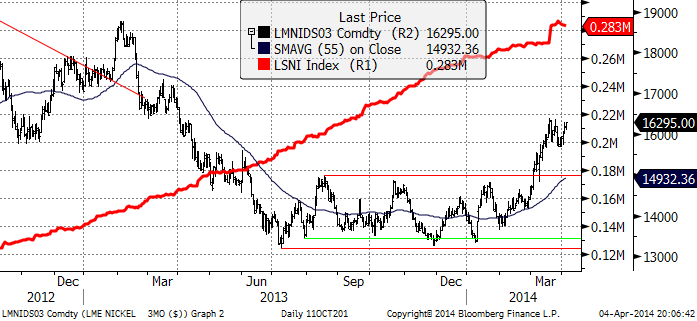
Nickel
Rekylen i priset tillbaka till 15,900 dollar per ton var tydligen tillräckligt. Det generella positiva sentimentet i början av veckan lyfte priset till över 16,000 dollar. Det har inte funnits några nickel-specifika nyheter. De två positiva faktorer som ger marknaden stöd, för det första Indonesiens exportförbud och risken för sanktioner mot Ryssland, fortsätter att påverka marknaden. Vi tror dock att den sistnämnda har försumbar risk att påverka marknaden. Däremot har kostnaderna för att producera nickel i Ryssland stigit, eftersom kapitalkostnaden gått upp för investeringar i Ryssland. Detta är dock inte något som syns i aktiekursen för Norilsk Nickel, som utvecklats positivt. För det fall EU och USA inför någon slags importförbud av nickel från Ryssland kan Norilsk skeppa till Kina istället. I fredags stängde marknaden på en ny årshögsta på 16,590, men tappade momentum inför stängningen. Vi tycker att den här marknaden rusar allt för långt framför fundamenta, även om det finns utsikter för en väsentligt ”tightare” balans senare i år.
Guld
Antalet nyanställda i USA steg mindre än väntat och det fick guldpriset att stiga i fredags, efter en vecka med dalande kurs. Antalet nyanställda i USA ökkade med 192,000 jobb, vilket var mindre än de 200,000 som väntades. Arbetsmarknaden fortsätter alltså att utvecklas mindre väl än vad FED väntade sig när de inledde nedtrappningen (”tapering”) av QE3 strax före Jul. Det har fått den nya centralbankschefen Janet Yellen att säga att den amerikanska ekonomin kommer att behöva monetär stimulans ”någon” tid. Janet Yellen gjorde sitt mest hök-aktiga uttalande när on svors in. Det har sagts om henne att hon påminner om en svärmor, en sådan person som aldrig ändrar sig. Hon har alltid varit en ”duva” i monetära sammanhang och det får hon nu allt mer chansen att vara. Detta innebär också att räntehöjningarna som kommer efter att QE3 är avvecklat, har skjutits upp ytterligare.
Priset på guld har rekylerat ner sedan mitten av mars, efter att spänningarna mellan EU / USA och Ryssland nådde sin varmaste nivå sedan det Kalla Kriget tog slut för 20 år sedan. Det är efterfrågan på fysiskt guld som gynnas av den sortens faktor. Importen till Indien fördubblades i mars i förhållande till februari. Att USA, nu allt mer EU (som pratiskt taget har deflation) och nu även Kina annonserat mer statlig stimulans, gynnar guldpriset.
Tekniskt ser vi att guldpriset vände uppåt precis på en känd stödnivå och nu ligger precis under ett tekniskt motstånd. Om det bryts på uppsidan i veckan, kan uppgången fortsätta.
Guld pekas ut som den sämsta metallen att äga i år i en enkätundersökning som Barclays genomförde på sitt seminarium för råvaruinvesterare den 27 mars. Ett så solitt negativt sentiment kan också tolkas som ett köptillfälle enligt ”contrary opionion”-synsättet. Det gäller bara att vänta på den riktiga ”triggern” för en uppgång.
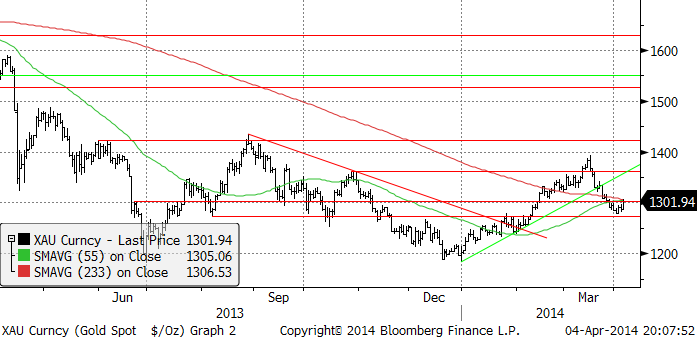
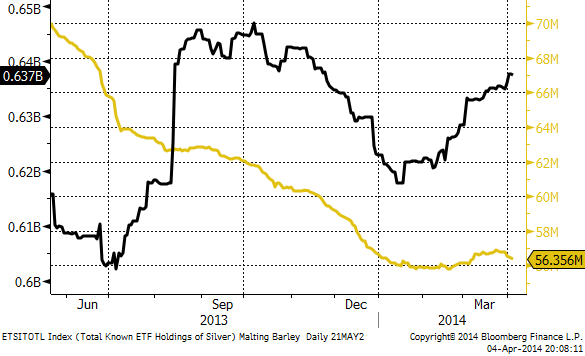
ETF-investerare har återigen sålt ETF:er på guld. Däremot har de fortsatt att köpa silver – den svarta kurvan nedan, vilket vi kan förstå.
Vi har tidigare skrivit att vi skulle vilja köpa guld om det kom en rekyl och det har det gjort. Så vi går alltså över till köprekommendation på guld och rekommenderar köp av GULD S.
Silver
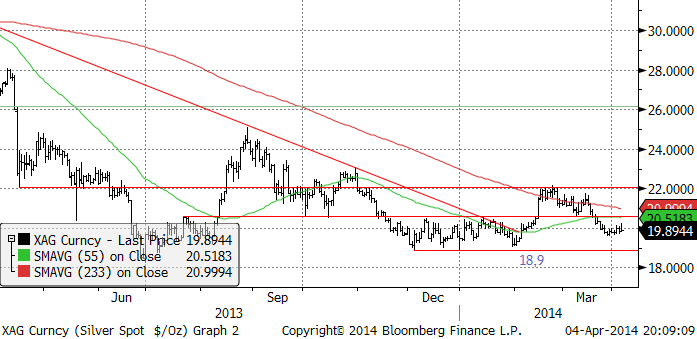
Silverpriset har fallit ner till den gamla konsolideringsnivån mellan 18.90 och 20 dollar per fin-uns. Vi tycker att silver ser mer köpvärt ut än guld, främst för att guld handlas på ett högt pris i silvertermer.
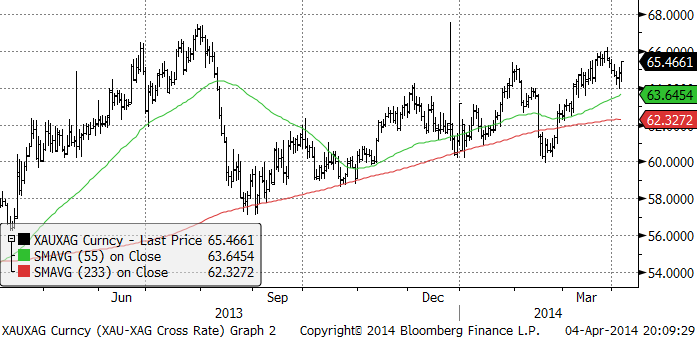
Nedan ser vi ett diagram över priset på guld uttryckt i silver. Det går alltså över 65 finuns silver på varje fin-uns av guld. Som vi ser är det en hög nivå, dvs silver är billigt i förhållande till guld.
Vi anser att silver är mer köpvärt än guld och skulle vilja köpa på de här nivåerna, i synnerhet efter den rekyl som inträffat de senaste veckorna.
Platina & Palladium
70.000 gruvarbetare strejkar i Sydafrika sedan den 23 januari. Gruvbolagen går med förlust och kan rimligtvis inte betala högre löner. I veckan fick vi rapporter om att gruvbolagens reservlager av metall håller på att ta slut. Man överväger att köpa platina på marknaden för att kunna fullfölja sina leveranskontrakt.
Mer eller mindre officiella källor i Sydafrika uppmanar till skapandet av den kartell som föreslogs av Ryssland för något år sedan, för att minska utbudet av metall. Ryssland och Sydafrika står för 80% av global produktion av PGM-metallerna och Sydafrika står för det mesta av det.
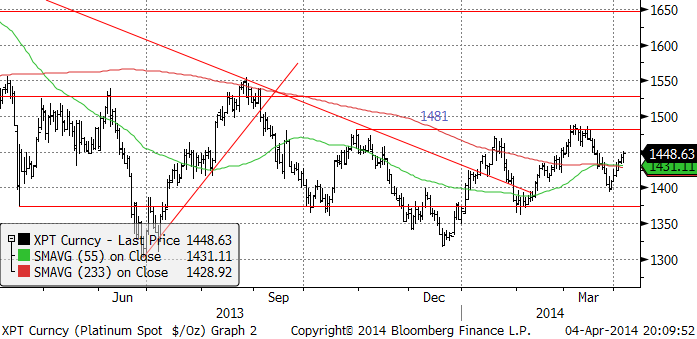
Priset på palladium, som bröt den stora triangelformationen, ser ut att snart bryta 800 dollar per fin-uns. Vi har säkert en stor ”bull market” framför oss i palladium också.
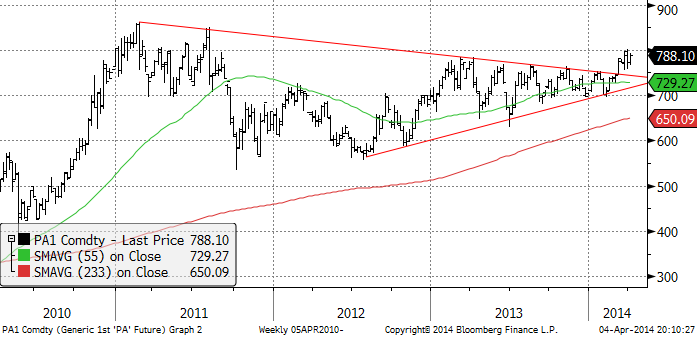
Vi rekommenderar köp av PLATINA S och PALLADIUM S, eller BULL PLATINA X4 S eller BULL PALLAD X4 S.
Sedan förra veckan finns även BULL och BEAR ”X5”, dvs fem gångers hävstång på platina och palladium.
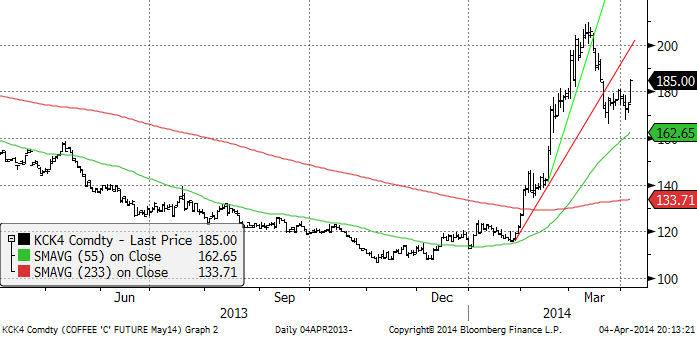
Kaffe
Kaffepriset tog ett rejält kliv upp under fredagens handel. Bakom tycks det första estimatet på den brasilianska skörden efter torkan ligga. Den brasilianska odlarföreningen CNC skrev i ett email i fredags att skörden ser ut att hamn i intervallet 40.1 – 43.3 miljoner säckar. Brasiliens skörd förra året var 53.7 miljoner säckar och väntades bli 53.1 miljoner i år enligt USDA eller 46.5 – 50.2 enligt CONAB i januari (innan torkan slog till). CNC:s uppgifter återspeglar verkligen en skördekatastrof och motiverar ett högre pris.
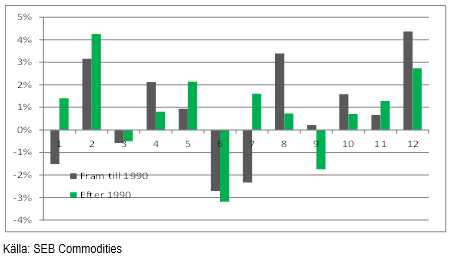
Den historiska månadsavkastningen indikerar att mars är en svag månad och april en uppgångsmånad, som vi ser av tabellen nedan, som visar genomsnittlig månadsavkastning för respektive månad från tidigt 70-tal fram till 1990 och dito åren efter 1990.
Vi går över till köprekommendation (KAFFE S) från neutral.
Kakao
Priset på kakao i New York stängde upp ganska kraftigt i fredags. Den allmänna bilden är dock att prisuppgången tappat momentum. De två senaste månaderna har priset legat stabilt under den tekniska motståndsnivån 3000 dollar.
Leveranserna av kakaobönor till hamnarna i Elfenbenskusten, den största producenten i världen, steg med 8.2% under perioden 1 oktober – 30 mars, jämfört med förra året. Leveranserna är de största sedan åtminstone 2004/05, det första året som man började föra statistik på leveranserna till hamnarna. Dessa data har sammanställts av Commodities Risk Analysis och är baserat på antalet lastbilar som setts anlända till hamnarna. Det är knappast en nyhet som kan driva priset på kakao högre.
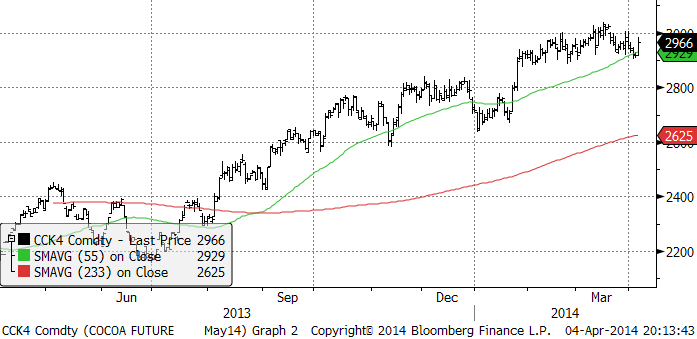
Vi rekommenderar en neutral position vid dagens situation.
För analyser på fler jordbruksråvaror se SEBs analysbrev från tidigare idag.
[box]SEB Veckobrev Veckans råvarukommentar är producerat av SEB Merchant Banking och publiceras i samarbete och med tillstånd på Råvarumarknaden.se[/box]
Disclaimer
The information in this document has been compiled by SEB Merchant Banking, a division within Skandinaviska Enskilda Banken AB (publ) (“SEB”).
Opinions contained in this report represent the bank’s present opinion only and are subject to change without notice. All information contained in this report has been compiled in good faith from sources believed to be reliable. However, no representation or warranty, expressed or implied, is made with respect to the completeness or accuracy of its contents and the information is not to be relied upon as authoritative. Anyone considering taking actions based upon the content of this document is urged to base his or her investment decisions upon such investigations as he or she deems necessary. This document is being provided as information only, and no specific actions are being solicited as a result of it; to the extent permitted by law, no liability whatsoever is accepted for any direct or consequential loss arising from use of this document or its contents.
About SEB
SEB is a public company incorporated in Stockholm, Sweden, with limited liability. It is a participant at major Nordic and other European Regulated Markets and Multilateral Trading Facilities (as well as some non-European equivalent markets) for trading in financial instruments, such as markets operated by NASDAQ OMX, NYSE Euronext, London Stock Exchange, Deutsche Börse, Swiss Exchanges, Turquoise and Chi-X. SEB is authorized and regulated by Finansinspektionen in Sweden; it is authorized and subject to limited regulation by the Financial Services Authority for the conduct of designated investment business in the UK, and is subject to the provisions of relevant regulators in all other jurisdictions where SEB conducts operations. SEB Merchant Banking. All rights reserved.

Market is starting to take US/Iran headlines with a pinch of salt. Brent crude rose $2.8/b yesterday to an official close of $112.1/b. But after that it traded as low as $108.05/b before ending late night at around $109.7/b. Through the day it traded in a range of $106.87 – 112.72/b amid a flurry of news or rumors from Iran and the US. ”US temporary sanctions during negotiations” (falls alarm). ”We will bomb Iran” (not anyhow),… etc. While the market is still fluctuating to this kind of news flow, it is starting to take such headlines with a pinch of salt.

We’ll see. Maybe, maybe not. The Brent M1 contract is trading at $110.2/b this morning which very close to the average ticks through yesterday of $110.4/b.
Trump with bearish, verbal intervention whenever Brent trades above $110/b it seems. What seems to be a pattern is that Trump states something like ”very good negotiations going on with Iran”, ”New leaders in Iran are great,..”, ”Great progress in negotiations,…”, ”Deal in sight,..” etc whenever the Brent M1 contract trades above $110/b. An effort to cool the market. These hot air verbal interventions from Trump used to have a heavy bearish impact on prices, but they now seems to have less and less effect unless they are backed by reality.
As far as we can see there has been no real progress in the negotiations between the US and Iran with both sides still standing by their previous demands.
Iran is getting stronger while the cease fire lasts making a return to war for Trump yet harder. Iran is naturally in constant preparation for a return to war given Trump’s steady threats of bombing Iran again. Iran is naturally doing what ever is possible to prepare for a return to war. And every day the cease fire lasts it is better prepared. This naturally makes it more and more difficult and dangerous for the US to return to warring activity versus Iran as the consequences for energy infrastructure in the Persian Gulf will be more and more severe the longer the cease fire lasts. Israel seems to see it this way as well. That the war is not won and that current frozen state of a cease fire gives Iran opportunity to rebuild military and politically.
Global inventories are drawing down day by day. How much? In the meantime the Strait of Hormuz stays closed. There is varying measures and estimates of how much global inventories are drawing down. Our rough estimate, back of the envelope, is that global inventories are drawing down by at least some 10 mb/d or about 300 mb/d in a balance between loss of supply versus demand destruction. Other estimates we see are a monthly draw of 250-270 mb/d. The IEA only ’measured’ a draw in global observable stocks of 117 mb in April with oil on water rising 53 mb while on shore stocks fell 170 mb. But global stocks are hard to measure with large invisible, unmeasured stocks. As such a back of the envelope approach may be better.
Oil products is what the world is consuming. Oil product prices likely to rise while product stocks fall. Strategic Petroleum Reserves (SPR) are predominantly crude oil. Discharging oil from OECD SPR stocks, a sharp reduction in Chinese crude imports and a reduction in global refinery throughput of 6-7 mb/d has helped to keep crude oil markets satisfactorily supplied. But global inventories are drawing down none the less. And oil products is really what the world is consuming. So if global refinery throughput stays subdued, then demand will eventually have to match the supply of oil products. The likely path forward this summer is a steady draw down in jet fuel, diesel and gasoline. Higher prices for these. Then, if possible, higher refinery throughput and higher usage of crude in response to very profitable refinery margins. And lastly sharper draw in crude stocks and higher prices for these. But some 6 mb/d of oil products used to be exported through the Strait of Hormuz. And it may not be so easy to ramp up refinery activity across the world to compensate. Especially as Ukraine continues to damage Russian refineries as well as Russian crude production and export facilities.
Watch oil product stocks and prices as well as Brent calendar 2027. What to watch for this summer is thus oil product inventories falling and oil product premiums to crude rising. Another measure to watch is the Brent crude 2027 contract as it rises steadily day by day as the Strait of Hormuz stays closed and global oil inventories decline. The latter is close to the highest level since the start of the war and keeps rising.
The Brent M1 contract and the Brent 2027 prices and current price of jet fuel in Europe (ARA). All in USD/b

Our back of the envelope calculation of the global shortage created by the closure of the Strait of Hormuz. Note that 3.5 mb/d of discharge from SPR is also a draw. Note also that ’Forced demand loss’ of 2.5 mb/d is probably temporary and will fall back towards zero as logistics are sorted out leaving ’Price demand loss’ to do the job of balancing the market. Thus a shortfall of at least 9 mb/d created by the closure. More if SPR discharge is included and more if Forced demand loss recedes.

Brent is climbing higher. Front-month is at USD 106.3/bl this morning, close to a weekly high and a USD 9/bl jump from Mondays open. This is the move we flagged as a risk earlier in the week: the market shifting from ”a deal is around the corner” to ”this is going to take longer than we thought”.

Analyst Commodities, SEB
During April, rest-of-year Brent remained remarkably stable around USD 90/bl. A stability which rested on one single assumption: the SoH reopens around 1 May. That assumption is now slowly falling apart.
As we highlighted yesterday: every week of delay beyond 1 May adds (theoretically) ish USD 5/bl to the rest-of-year average, as global inventories draw 100 million barrels per week. i.e., a mid-May reopening implies rest-of-year Brent closer to USD 100/bl, and anything pushing into June or July takes us meaningfully higher.
What’s changed in the last 48 hours:
#1: The US military has formally warned that clearing suspected sea mines from SoH could take up to six months. That is a completely different timescale from what the financial market is pricing. Even a political deal tomorrow does not immediately reopen the strait.
#2: Trump has shifted his tone from urgency to ”strategic patience”. In yesterday’s press conference: ”Don’t rush me… I want a great deal.” The market is reading this as a president no longer feeling pressured by timelines, with the naval blockade running in the background.
#3: So far, the military activity is escalating, not de-escalating. Axios reports Iran is laying more mines in SoH. The US 3rd carrier strike group (USS George H.W. Bush) is arriving with two countermine vessels. Trump yesterday ordered the US Navy to destroy any Iranian boats caught laying mines. While CNN reports that the Pentagon is actively drawing up plans to strike Iranian SoH capabilities and individual Iranian military leaders if the ceasefire collapses. i.e., NOT a attitude consistent with an imminent deal!
Spot crude and product prices eased off the early-April highs on a combination of system rerouting and deal optimism. Both now weakening. Goldman estimates April Gulf output is reduced by 14.5 mbl/d, or 57% of pre-war supply, a number that keeps getting worse the longer this drags on.
Demand-side adaptation is ongoing: S. Korea has cut its Middle East crude dependence from 69% to 56% by pulling more from the Americas and Africa, and Japan is kicking off a second round of SPR releases from 1 May. But SPRs are finite.
Ref. to the negotiations, we should not bet on speed. The current Iranian leadership is dominated by genuine hardliners willing to absorb economic pain and run the clock to extract concessions. That is not a setup for a rapid resolution. US/Israeli media briefings keep framing the delay as ”internal Iranian divisions”, the reality is more complicated and points toward weeks and months, not days.
Our point is that the complexity is large, and higher prices have only just started (given a scenario where the negotiations drag out in time). The market spent April leaning on the USD 90/bl rest-of-year assumption; that case is diminishing by the hour. If ”early May reopening” is replaced by ”June, July or later” over the next week or two, both crude and products have meaningful room to reprice higher from here. There is a high risk being short energy and betting on any immediate political resolution(!).
Down on Friday. Up on Monday. The Brent June crude oil contract traded down 5.1% last week to a close of $90.38/b. It reached a high of $103.87/b last Monday and a low of $86.09/b on Friday as Iran announced that the Strait of Hormuz was fully open for transit. That quickly changed over the weekend as the US upheld its blockade of Iranian oil exports while Iran naturally responded by closing the SoH again. The US blew a hole in the engine room of the Iranian ship TOUSKA and took custody of the ship on Sunday. Brent crude is up 5.6% this morning to $95.4/b.
The cease-fire is expiring tomorrow. The US has said it will send a delegation for a second round of negotiations in Islamabad in Pakistan. But Iran has for now rejected a second round of talks as it views US demands as unrealistic and excessive while the US is also blocking the Strait of Hormuz.
While Brent is up 5% this morning, the financial market is still very optimistic that progress will be made. That talks will continue and that the SoH will fully open by the start of May which is consistent with a rest-of-year average Brent crude oil price of around $90/b with the market now trading that balance at around $88/b.
Financial optimism vs. physical deterioration. We have a divergence where the financial market is trading negotiations, improvements and resolution while at the same time the physical market is deteriorating day by day. Physical oil flows remain constrained by disrupted flows, longer voyage times and elevated freight and insurance costs.
Financial markets are betting that a US/Iranian resolution will save us in time from violent shortages down the road. But every day that the SoH remains closed is bringing us closer to a potentially very painful point of shortages and much higher prices.
The US blockade is also a weapon of leverage against its European and Asian allies. When Iran closed the SoH it held the world economy as a hostage against the US. The US blockade of the SoH is of course blocking Iranian oil exports. But it is also an action of disruption directed towards Europe and Asia. The US has called for the rest of the world to engaged in the war with Iran: ”If you want oil from the Persian Gulf, then go and get it”. A risk is that the US plays brinkmanship with the global oil market directed towards its European and Asian allies and maybe even towards China to force them to engage and take part. Maybe unthinkable. But unthinkable has become the norm with Trump in the White House.


Sommarväder skapar prisrally på elbörsen
Oil product price pain is set to rise as the Strait of Hormuz stays closed into summer

Solkraften pressar elpriserna dagtid

Michel Gubel ger sin syn på oljemarknaden