

Analys
SEB – Råvarukommentarer, 29 april 2013

Rekommendationer
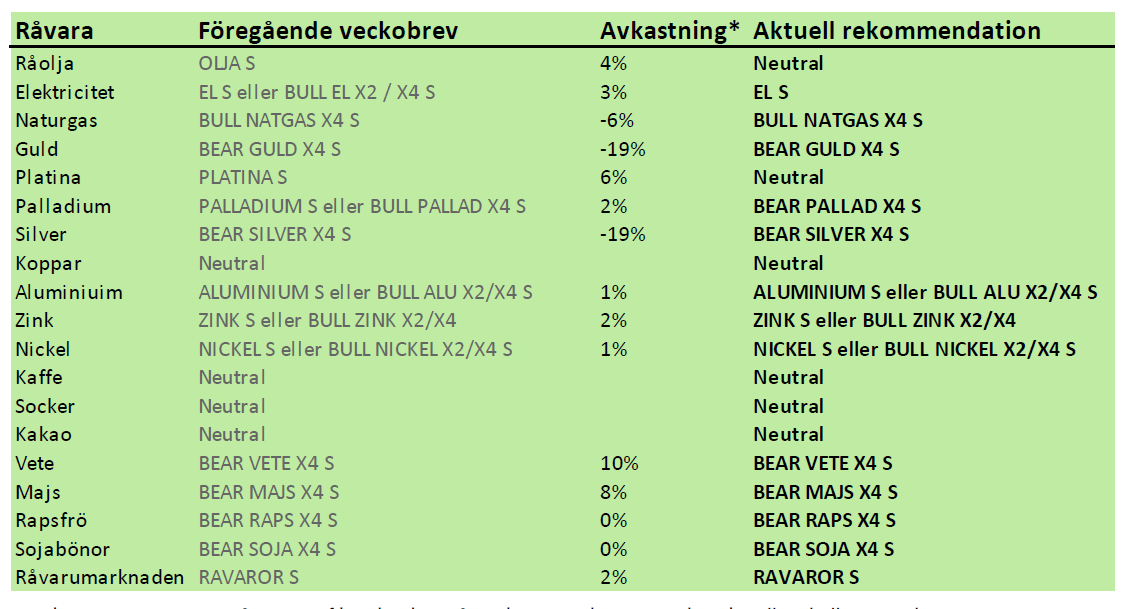
*) Avkastningen avser 1:1 råvarucertifikat där de ingår i rekommendationen. I den aktuella tabellen ovan har jag tagit prisförändringen den senaste veckan sedan det förra veckobrevet publicerades.
Inledning
Vi tror att guld, silver, platina och palladium, liksom olja står inför en korrektion nedåt i veckan som kommer. Om detta sker, kan dock priserna ha kommit ner så pass att det kan bli intressant att köpa dem på lite längre sikt.
Sådden av majs i USA har inte kunnat ske på grund av den sena våren. Deadline, som anses vara den 10 maj närmar sig. Väderleksprognosen visar dock ett ”fönster” av gott väder, där sådden kan ske innan dess. De närmaste dagarnas väderutveckling kommer att ha ett avgörande inflytande över prisutvecklingen. Den kinesiska fågelinfluensan har sänkt konsumtionen av kyckling med upp till 80%. Det sänker efterfrågan på sojabönor i världen. Vi tror alltjämt på sjunkande priser på alla jordbruksprodukter. Grispriset i USA testar dock tekniska motståndsnivåer, möjligen just beroende på fågelinfluensan i Kina.
Råvaruindex
I diagrammet nedan ser vi SEB:s råvaruindex i svenska kronor och OMXS30 aktieindex. Båda återhämtade sig i veckan som gick. Vi tror att prisfallen på råvaror kommer att fortsätta i veckan som kommer. Det börjar dock närma sig botten och vi börjar söka efter möjligheter att gå in på köpsidan.
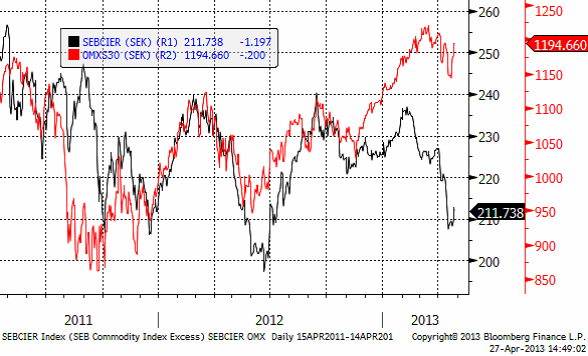
Den som vill investera i indexet och den investeringsstrategi som ligger bakom kan läsa mer om certifikatet RAVAROR S.
Råolja – Brent
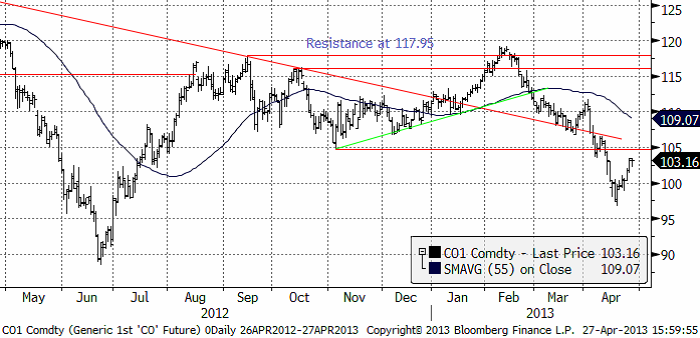
Oljepriset rekylerade uppåt i veckan som gick. Vi ser det som en reaktion mot den allmänna pristrenden, och väntar oss att priset vänder ner igen. Vi går därför temporärt ur OLJA S, för att kunna komma in billigare senare.
Lagren och lagerförändringarna i USA den senaste rapportveckan ser vi nedan, enligt Department of Energy och American Petroleum Institute. Notera minskningen i råoljelagren!
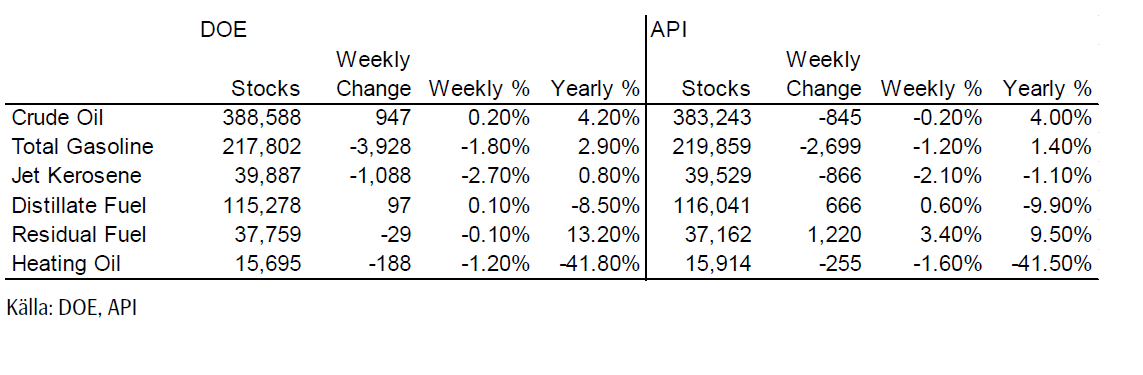
Nedan ser vi amerikanska råoljelager enligt DOE i tusen fat. Den svarta kurvan är 2012 års lagernivåer vecka för vecka och den lilla röda linjen är 2013 års nivå.
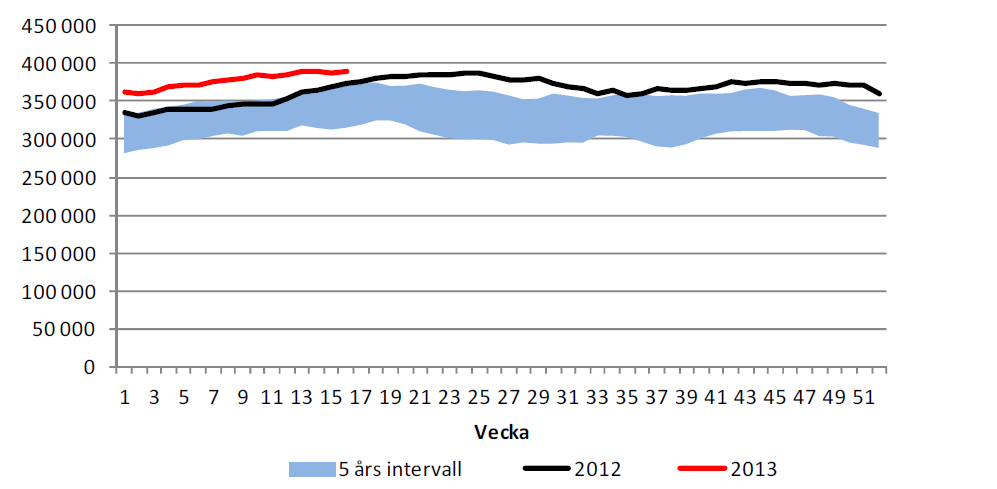
Importen har minskat för andra veckan i rad och ligger nu stadigt under 8 mbbl/dag. Vi ligger alltså neutralt i veckan som kommer för att förhoppningsvis kunna komma in billigare i OLJA S.
Elektricitet
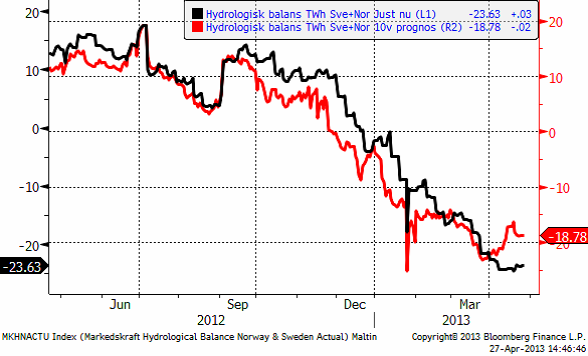
Priset på el rekylerade upp förra veckan. Marknaden står och väger just nu. Hydrologin har planat ut. Det väger ungefär lika tungt i båda vågskålarna för köpsidan och säljsidan. Vi tror dock mer på en stigande trend på lite längre sikt, än att priset ska falla tillbaka nedåt. Därför ligger vi kvar i EL S.
Den hydrologiska balansen har planat ut och prognosen har slutat falla och planat ut den också. Slutsatsen är alltså att vi ligger kvar i EL S.
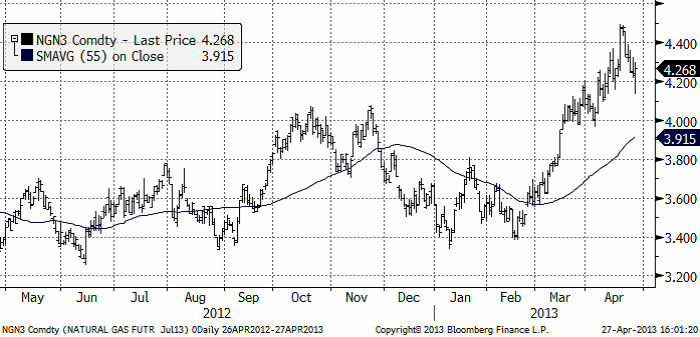
Naturgas
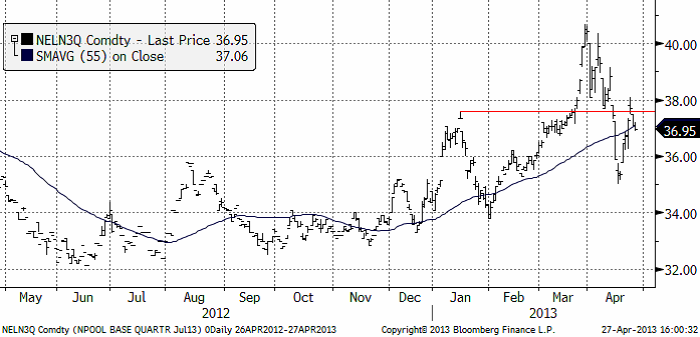
Nedan ser vi juli-kontraktet på naturgas i USA. Uppgången har mognat ,men vi tror det kommer en sväng uppåt till mot 4.40 dollar per mmBtu. Det kan vara ett bra tillfälle att ta hem vinsten på de köpta BULL NATGAS X4 S vi rekommenderat köp av tidigare.
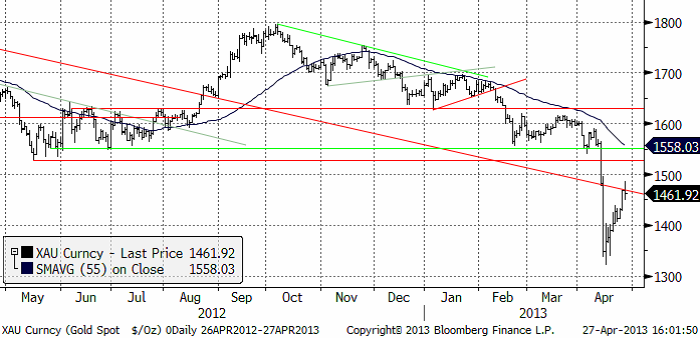
Guld och Silver
Det har varit hög aktivitet på den svenska marknaden för investeringsguld. I början av veckan var det övervägande köp av GULD S, ett certifikat som följer guldpriset på samma sätt som en guldtacka. Mot slutet av veckan gick placerare ur sina positioner. GULD S och dess familjemedlemmar med högre hävstång, BULL och BEAR, går att använda för kortsiktigare handel än fysiskt guld eftersom transaktionskostnaden är så låg. Vi kan tolka marknadens beteende som att den tror på lägre priser på kort sikt. Samtidigt har vi kunnat läsa rapporter om att såväl the US Mint som Storbritanniens motsvarighet sålt slut på sitt fysiska guld. Långsiktiga investerare tror alltså att priset är lågt nu.
Vi tror också att priset kortsiktigt kommer att vända ner och testa den lägsta noteringen i april. Marknadspsykologins två drivkrafter rädsla och hopp spelar stor roll här. Det är väldigt få personer i samhället som äger guld som en finansiell placering, men för dem som gör det är det sannolikt en stor del av portföljen. Det beror bland annat på att guldpriset stigit så mycket i värde, samtidigt som aktier och andra tillgångar inte gjort det. Många guldinvesterare upplever det här prisfallet på samma sätt som aktiesparare upplevde börskrascherna 1987, 2001 och 2008, dvs med rädsla för att förlora mycket pengar. Att förlora mycket pengar ger större utslag på känslomätaren än att vinna lika mycket pengar. Det vore därför fullständigt naturligt om många nu väljer att minska sina placeringar, när priset har repat sig från bottennoteringarna efter prisraset med 100 dollar per ozt. Även långsiktiga köpare av fysisk metall borde tycka att 100 dollar mer än för ett par veckor sedan är i dyraste laget.
Man ser ofta den här typen av rekyl efter ett initialt prisfall. Det följs i regel, men inte alltid, av ytterligare en nedgångsfas. Ska man gissa, så måste man därför gissa, att priset kommer att vända ner nu igen och att vi står inför ytterligare en rejäl prisnedgång.
Vi kan dock notera att långsiktigt förklaras guldpriset av demografiska faktorer – ökade inkomster i tillväxtländer. Nedan ser vi guldpriset förklarat av BNP i länder med BNP / capita mellan 2000 och 13000 dollar i dagens penningvärde. Varje punkt markerar ett år sedan 1960 till 2011.
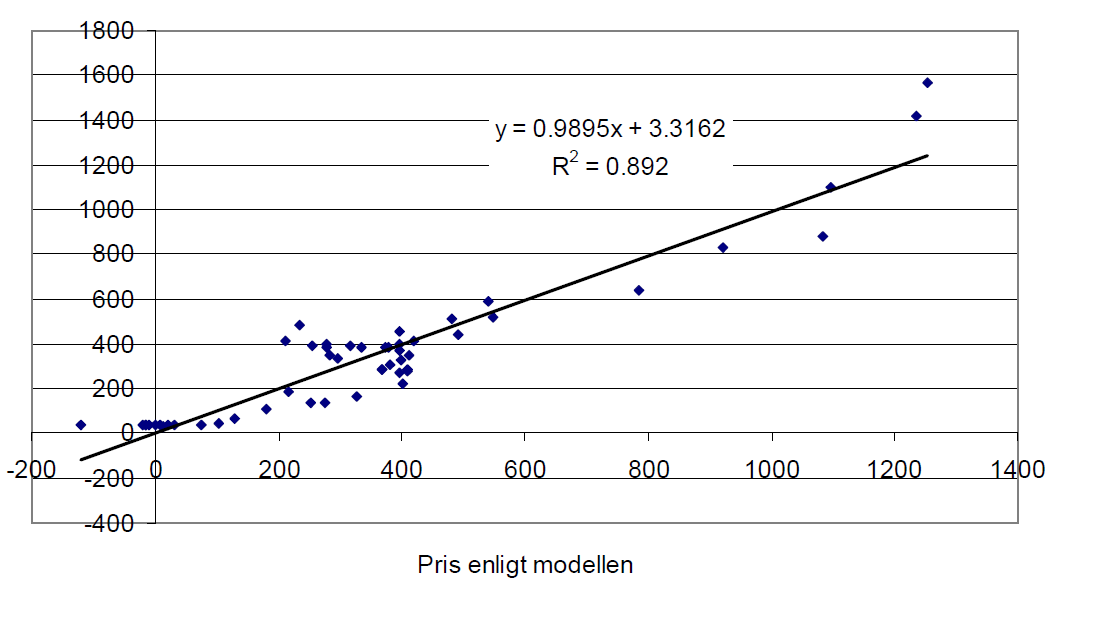
De två högsta noteringarna avser åren 2010 och 2011. Vi ser att dessa år ligger priset på guld över den långsiktiga relationen för BNP i dessa länder. Det beror, skulle jag hävda på ökningen av penningmängden, framförallt i USA. Quantitative Easing, har skapat pengar att parkera någonstans och med en ränta nära noll är inte alternativkostnaden för en placering i guld så hög.
Man ska också reflektera över att den här ”demografiska” indikatorn, som förklarar guldprisets nivå så väl, kommer att minska när Kina går över 13000 dollar i BNP per capita, på samma sätt som skedde på tidigt 80-tal när den stora populationen i Europa, Japan och USA gick över 13000 dollar i BNP per capita och började konsumera tjänster i stället för att öka efterfrågan på råvaror / saker när de fick mer pengar. Det är dock ännu många år innan Kinas tillväxt har tagit BNP / capita över den nivån och det talar för ett fortsatt högt guldpris ännu ett tag.
Produktionskostnaden ligger strax under dagens pris. Gruvbolaget Newmont säger att ”all-in sustaining cash costs” är 1,100 – 1,200 dollar / ozt. Barrick säger att det är 1,000 – 1,100 dollar. IamGold, som är en högkostnadsproducent, ligger på 1,558 dollar. Det kanadensiska bolaget Dundee Capital Markets gjorde en sammanställning av ”all-in cost”. De säger att medelvärdet för de 20 största producenterna är 1,306 dollar. På basis av en kostnadskurva publicerad den 4 april i ”GFMS Gold Survey 2013” kan vi utläsa att så mycket som 20% av alla gruvor är olönsamma vid den här prisnivån. Tendensen att minska utbudet och få marknadens utbud mer i balans med efterfrågan borde få priset att hitta stöd inte långt under dagens guldpris.
Nedan ser vi kursdiagrammet för silver i dollar per troy ounce.
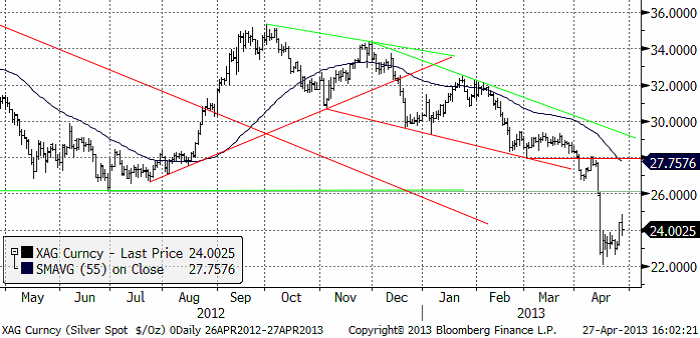
Vi ligger korta guld och silver. Det har kostat i veckan som gick, men eftersom vi tror att det kommer en till vända ner, ligger vi självklart kvar med köpt position i BEAR GULD X4 S och BEAR SILVER X4 S.
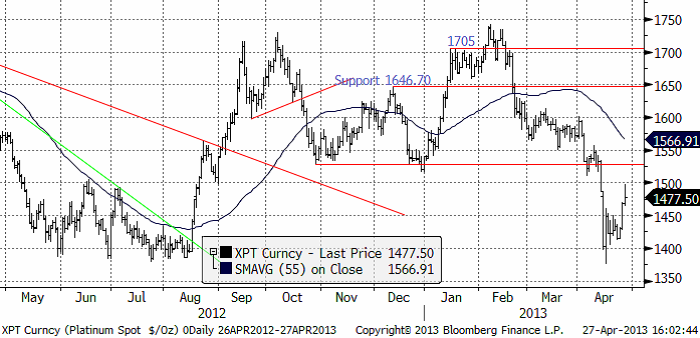
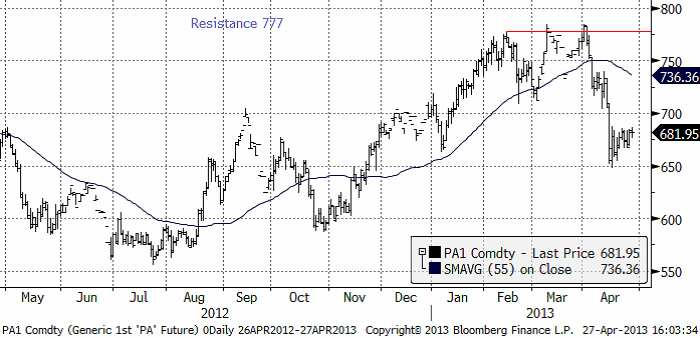
Platina & Palladium
Platinapriset har rekylerat uppåt, i likhet med guld och silver. Vi tror att det handlar om en rekyl mot den allmänna pristrenden och därför ett bra tillfälle att temporärt stänga positioner i Platina.
Prisfallet i palladium har stannat av och inte lyckats ta sig uppåt. Det ser ännu svagare ut än de andra. Vi tvingas därför vänta fot och gå kort. Rekommendationen ändras alltså till köp av BEAR PALLAD X4 S. Målkursen är 600 dollar.
Basmetaller
Prissättningen av derivat på metallmarknaden indikerar en ökad volatilitet. Något som också visat sig i faktiska prisrörelser under veckan. Veckan inleddes som väntat svagare, men köparna kom in kring stödnivåerna och vi såg en rejäl uppgång i mitten av veckan. Det såg stabilt ut vid lunchtid i fredags. Den amerikanska BNP-siffran fick dock marknaderna att surna till på eftermiddagen (+2,5 % för Q1 mot väntat 3.0). Sent på kvällen såldes metallerna ner kraftigt, delvis p.g.a. positionskorrigeringar inför Kinas långhelg (stängt i 3 dagar i samband med 1:a maj). En stor del av veckouppgången raderades snabbt ut.
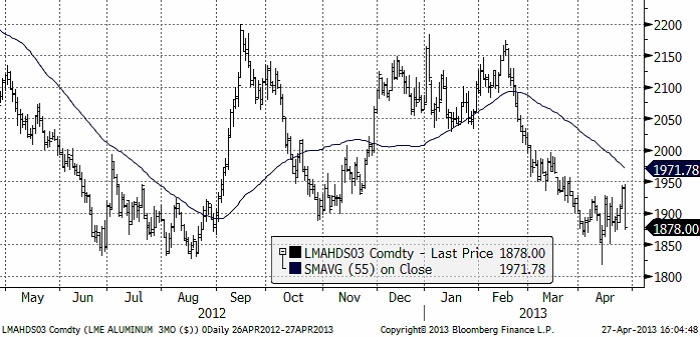
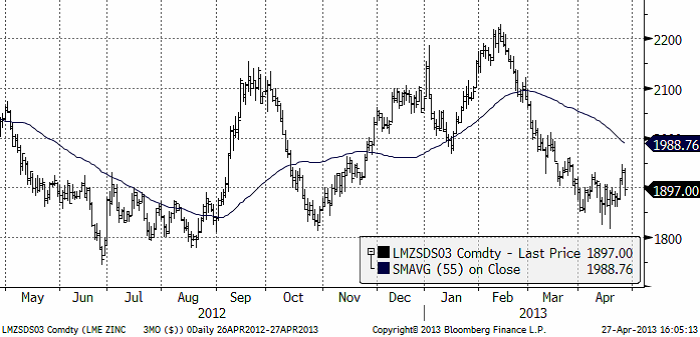
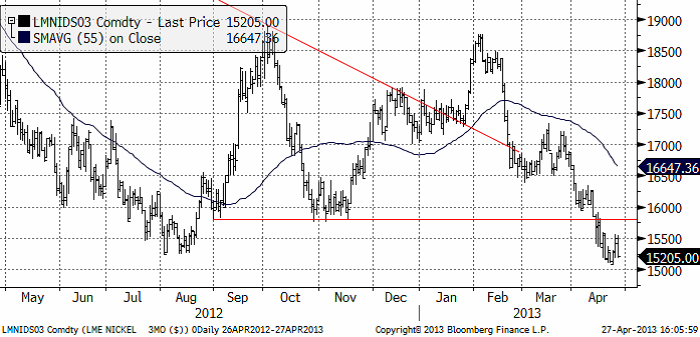
Vi tidigare skrivit om metallernas olika läge med tanke på pris i förhållande till kostnader. Alu, zink och nickel befinner sig i närheten kostnadsnivån för de 10 % producenterna med högst kostnader, d.v.s. där produktion på marginal blir olönsam, och därmed förr eller senare faller bort (se diagram nedan).
Diagrammet nedan visar metallpriset i förhållande till produktionskostnadskurvans 90%-percentil.
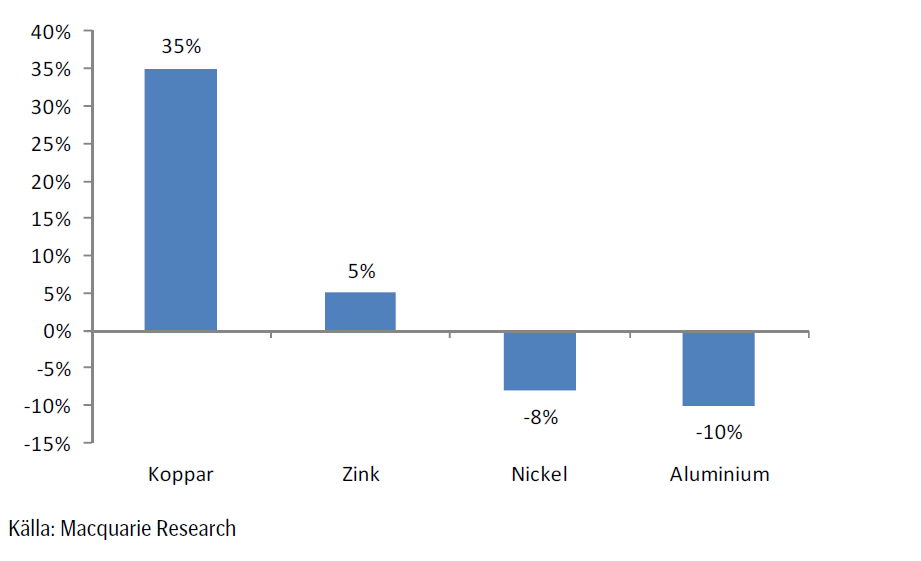
Som vi också återkommande skrivit om, ligger fortfarande kopparpriset högt i förhållande till kostnaderna för att producera metallen. Koppar brukar betraktas som den ledande metallen (LME:s flaggskepp). Kinas stora kopparbehov har förstärkt den positionen. Det är också till stor del Kinas importbehov som skapat ”premien”. När Kina sviktar, ja då sviktar kopparn. Utbudet ökar också nu efter att i flera år ha släpat efter. Dessutom har det finansiella kollektivet tagit fasta på läget och positionerat sig för nedgång. Tekniskt sett har man nu fått ”vatten på sin kvarn”. Så länge stämningsläget är negativt gentemot kopparn blir det svårt för övriga metaller att ta fart. Kopparn har behövt en korrigering, och det är den vi ser nu. Den stora frågan för hela metallmarknaden blir därför hur lågt kan kopparn gå?
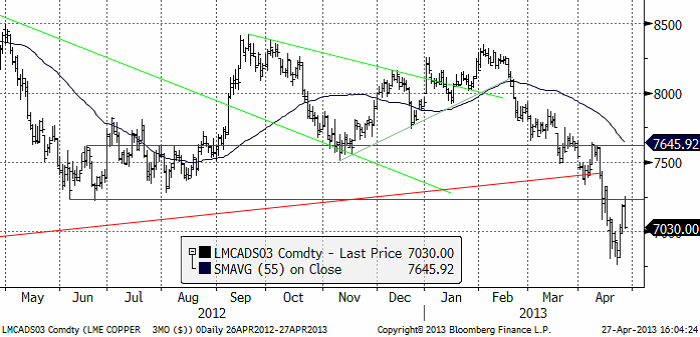
Koppar
Vi skrev i förra veckan att det dags att börja bevaka en eventuell vändning. Priset tog sig upp till motståndsnivåerna kring $7200. Veckan stänger upp 1,4 % trots fredagens utförsäljning inför den kinesiska långhelgen.
Tekniskt sett så (se grafen nedan) kommer nästa stor stödnivå in kring $6500. I vårt tycke har marknaden förmodligen korrigerat tillräckligt, med en anpassning till den ”nya” fundamentala situationen. Det blir nu extra intressant att följa Kinas import. Prisskillnaden mellan LME och Shanghai är till LME:s fördel, vilket brukar ledan till att kineserna ”passar på” att köpa. Frågan är dock hur stark efterfrågan är lokalt i Kina. Marknaden är lite tveksam. Vi bevakar nu kopparn och förbereder oss för att vända från neutral till köp.
Den tekniska bilden har gett stöd till vår neutrala position. Vi är positiva till basmetaller på sikt men har avvaktat bättre köptillfällen alternativt väljer någon annan basmetall. Vi bevakar nu den nya stödnivån kring $6500.
Som vi skrivit tidigare tyder mycket på ökat utbud för koppar, vilket riskerar att begränsa uppgångspotentialen. Vi rekommenderar fortsatt en neutral position, men sätter koppar på bevakning för köp. För den som vill satsa på ett starkare tillväxtscenario (än konsensus) i Kina är koppar däremot alltid ett intressant alternativ.
Aluminium
Aluminium har visat styrka ett par veckor i samband med svagheten för koppar. Varje ”dipp” under $1900 har mött starkt köpintresse från industriella aktörer. I fredags såg det länge ut som vi skulle få en stark stängning över den första motståndsnivån kring $1930. Prisfallet för metaller generellt på fredagskvällen tog dock ner metallen förvånansvärt mycket, ända ned till $1878. Veckan kommer att inledas med ett nytt bra köpläge. För den riskbenägne kan det vara läge för att köpa ett kontrakt med hävstång (BULL ALU X2 eller X4). Långsiktigt är nivån väldigt intressant för kontraktet Aluminium S (utan hävstång).
Zink
Zinken följde i stort sett övriga metaller under veckan, och får en ganska neutral stängning på veckan. Produktionsstatistik från Kina är lite oroväckande för zinkens fundamentala balans. Smältverksproduktionen ökar i Kina, delvis som en effekt av stort gruvutbud (höjda smältlöner till smältverken). Risken finns att det behövs ännu lägre priser för att påverka gruvutbudet. Risken är att det dröjer innan priset vänder upp på allvar. Vi bedömer ändå zinken som fundamentalt ”billig” ur ett kostnadsperspektiv och nuvarande nivåer är mycket intressanta på lite längre sikt (6-12 månader). I det perspektivet är Zink S (utan hävstång) att föredra.
Nickel
Även nickel följde den allmänna trenden under veckan. Metallen balanserar farligt nära de viktiga stödnivåerna. Det finns ett lite oroväckande negativt stämningsläge kring nickelmarknaden just nu, baserat på känslan av ett alltför stort överskott (LME-lagret är ett synligt tecken på detta). Den rostfria stålindustrin som förbrukar ca 60 % av allt nickel, vill inte riktigt ta fart. Den förväntade lagerbyggnadsfasen har inte materialiserats under Q1, som den normalt gör. Problemet är delvis att tillgången i Kina är alltför god med tanke på utbudet av nickel Pig Iron. Det kan därför ta lite längre tid än beräknat. Vi bedömer ändå nivåerna som väldigt intressant ur ett kostnadsperspektiv (den första produktionen som förväntas tas ur marknaden är just Nickel Pig Iron i Kina). Frågan är om det finns utrymmer för ett brott om $15000. Vi studerar därför det långsiktiga veckodiagrammet nedan. Med nuvarande fundamentala situation har vi väldigt svårt att se marknaden gå ner till 2008-års katastrofnivåer (då efterfrågan mer än halverades). Om vi får en dipp under $15000 tror vi den blir kortvarig, och ett ypperligt köpläge av en metall som på sikt har stor uppgångspotential.
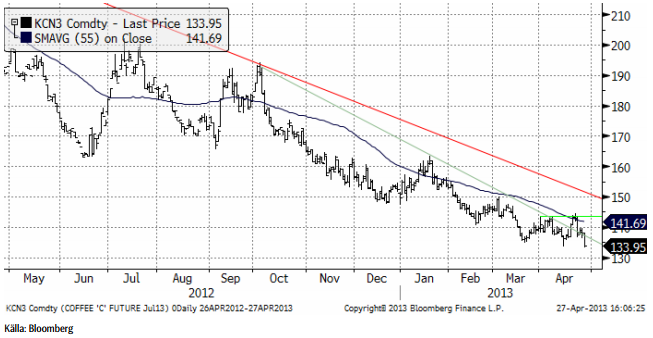
Kaffe
Kaffepriset (maj 2013) vände tvärt ner efter att Starbucks sade att de är försiktiga med inköpen och bara köper så mycket som behövs för stunden. Det indikerar att de tror på lägre priser på kaffe.
Conselho Nacional do Café, en sammanslutning av brasilianska kaffebönder, har bett regeringen i Brasilia om “akut” stöd. Värdet av den brasilianska kaffeproduktionen har halverats till ca 8 miljarder dollar i år. Kaffeodling är den verksamhet som sysselsätter flest människor på den brasilianska landsbygden. Sockerrörsodling, som också drabbats av fallande priser, är inte alls lika arbetsintensivt. För två år sedan besökte jag gården Café Héléna i delstaten São Paulo. Gården på 100 ha sysselsatte 14 personer på heltid. Enligt Conselho Nacional do Café har 655,000 familjer sin utkomst från kaffeodlingen.
Av 2012 års skörd är ungefär 70% sålt nu och ett normalt år borde det 90% redan vara sålt. Av 2013 års skörd är bara 10% sålt, medan det normalt sett borde vara 30%.
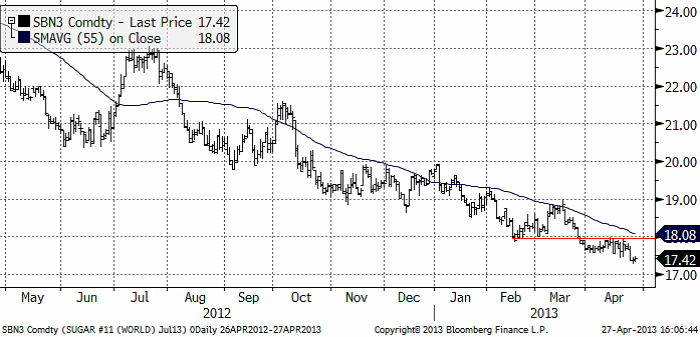
Socker
Sockerpriset (september 2013) fortsätter att rasa, med ytterligare ett kliv nedåt i veckan som gick. Sockerrör har blivit en populär gröda i Brasilien och trängt undan kaffeodling. Klondyke-stämningen i sockerproduktionen har nu gått över och det börjar talas om konkurser för svagare ”crushers”. Möjligen kan detta också bli ett tecken på botten för priserna när det sker.
Vi fortsätter med neutral rekommendation.
[box]SEB Veckobrev Veckans råvarukommentar är producerat av SEB Merchant Banking och publiceras i samarbete och med tillstånd på Råvarumarknaden.se[/box]
Disclaimer
The information in this document has been compiled by SEB Merchant Banking, a division within Skandinaviska Enskilda Banken AB (publ) (“SEB”).
Opinions contained in this report represent the bank’s present opinion only and are subject to change without notice. All information contained in this report has been compiled in good faith from sources believed to be reliable. However, no representation or warranty, expressed or implied, is made with respect to the completeness or accuracy of its contents and the information is not to be relied upon as authoritative. Anyone considering taking actions based upon the content of this document is urged to base his or her investment decisions upon such investigations as he or she deems necessary. This document is being provided as information only, and no specific actions are being solicited as a result of it; to the extent permitted by law, no liability whatsoever is accepted for any direct or consequential loss arising from use of this document or its contents.
About SEB
SEB is a public company incorporated in Stockholm, Sweden, with limited liability. It is a participant at major Nordic and other European Regulated Markets and Multilateral Trading Facilities (as well as some non-European equivalent markets) for trading in financial instruments, such as markets operated by NASDAQ OMX, NYSE Euronext, London Stock Exchange, Deutsche Börse, Swiss Exchanges, Turquoise and Chi-X. SEB is authorized and regulated by Finansinspektionen in Sweden; it is authorized and subject to limited regulation by the Financial Services Authority for the conduct of designated investment business in the UK, and is subject to the provisions of relevant regulators in all other jurisdictions where SEB conducts operations. SEB Merchant Banking. All rights reserved.


The latest weekly report from the US DOE showed a substantial drawdown across key petroleum categories, adding more upside potential to the fundamental picture.

Commercial crude inventories (excl. SPR) fell by 5.8 million barrels, bringing total inventories down to 415.1 million barrels. Now sitting 11% below the five-year seasonal norm and placed in the lowest 2015-2022 range (see picture below).
Product inventories also tightened further last week. Gasoline inventories declined by 2.1 million barrels, with reductions seen in both finished gasoline and blending components. Current gasoline levels are about 3% below the five-year average for this time of year.
Among products, the most notable move came in diesel, where inventories dropped by almost 4.1 million barrels, deepening the deficit to around 20% below seasonal norms – continuing to underscore the persistent supply tightness in diesel markets.
The only area of inventory growth was in propane/propylene, which posted a significant 5.1-million-barrel build and now stands 9% above the five-year average.
Total commercial petroleum inventories (crude plus refined products) declined by 4.2 million barrels on the week, reinforcing the overall tightening of US crude and products.


A classic case of “buy the rumor, sell the news” played out in oil markets, as Brent crude has dropped sharply – down nearly USD 10 per barrel since yesterday evening – following Iran’s retaliatory strike on a U.S. air base in Qatar. The immediate reaction was: “That was it?” The strike followed a carefully calibrated, non-escalatory playbook, avoiding direct threats to energy infrastructure or disruption of shipping through the Strait of Hormuz – thus calming worst-case fears.
After Monday morning’s sharp spike to USD 81.4 per barrel, triggered by the U.S. bombing of Iranian nuclear facilities, oil prices drifted sideways in anticipation of a potential Iranian response. That response came with advance warning and caused limited physical damage. Early this morning, both the U.S. President and Iranian state media announced a ceasefire, effectively placing a lid on the immediate conflict risk – at least for now.
As a result, Brent crude has now fallen by a total of USD 12 from Monday’s peak, currently trading around USD 69 per barrel.
Looking beyond geopolitics, the market will now shift its focus to the upcoming OPEC+ meeting in early July. Saudi Arabia’s decision to increase output earlier this year – despite falling prices – has drawn renewed attention considering recent developments. Some suggest this was a response to U.S. pressure to offset potential Iranian supply losses.
However, consensus is that the move was driven more by internal OPEC+ dynamics. After years of curbing production to support prices, Riyadh had grown frustrated with quota-busting by several members (notably Kazakhstan). With Saudi Arabia cutting up to 2 million barrels per day – roughly 2% of global supply – returns were diminishing, and the risk of losing market share was rising. The production increase is widely seen as an effort to reassert leadership and restore discipline within the group.
That said, the FT recently stated that, the Saudis remain wary of past missteps. In 2018, Riyadh ramped up output at Trump’s request ahead of Iran sanctions, only to see prices collapse when the U.S. granted broad waivers – triggering oversupply. Officials have reportedly made it clear they don’t intend to repeat that mistake.
The recent visit by President Trump to Saudi Arabia, which included agreements on AI, defense, and nuclear cooperation, suggests a broader strategic alignment. This has fueled speculation about a quiet “pump-for-politics” deal behind recent production moves.
Looking ahead, oil prices have now retraced the entire rally sparked by the June 13 Israel–Iran escalation. This retreat provides more political and policy space for both the U.S. and Saudi Arabia. Specifically, it makes it easier for Riyadh to scale back its three recent production hikes of 411,000 barrels each, potentially returning to more moderate increases of 137,000 barrels for August and September.
In short: with no major loss of Iranian supply to the market, OPEC+ – led by Saudi Arabia – no longer needs to compensate for a disruption that hasn’t materialized, especially not to please the U.S. at the cost of its own market strategy. As the Saudis themselves have signaled, they are unlikely to repeat previous mistakes.
Conclusion: With Brent now in the high USD 60s, buying oil looks fundamentally justified. The geopolitical premium has deflated, but tensions between Israel and Iran remain unresolved – and the risk of missteps and renewed escalation still lingers. In fact, even this morning, reports have emerged of renewed missile fire despite the declared “truce.” The path forward may be calmer – but it is far from stable.
Analys
A muted price reaction. Market looks relaxed, but it is still on edge waiting for what Iran will do
Brent crossed the 80-line this morning but quickly fell back assigning limited probability for Iran choosing to close the Strait of Hormuz. Brent traded in a range of USD 70.56 – 79.04/b last week as the market fluctuated between ”Iran wants a deal” and ”US is about to attack Iran”. At the end of the week though, Donald Trump managed to convince markets (and probably also Iran) that he would make a decision within two weeks. I.e. no imminent attack. Previously when when he has talked about ”making a decision within two weeks” he has often ended up doing nothing in the end. The oil market relaxed as a result and the week ended at USD 77.01/b which is just USD 6/b above the year to date average of USD 71/b.

Brent jumped to USD 81.4/b this morning, the highest since mid-January, but then quickly fell back to a current price of USD 78.2/b which is only up 1.5% versus the close on Friday. As such the market is pricing a fairly low probability that Iran will actually close the Strait of Hormuz. Probably because it will hurt Iranian oil exports as well as the global oil market.
It was however all smoke and mirrors. Deception. The US attacked Iran on Saturday. The attack involved 125 warplanes, submarines and surface warships and 14 bunker buster bombs were dropped on Iranian nuclear sites including Fordow, Natanz and Isfahan. In response the Iranian Parliament voted in support of closing the Strait of Hormuz where some 17 mb of crude and products is transported to the global market every day plus significant volumes of LNG. This is however merely an advise to the Supreme leader Ayatollah Ali Khamenei and the Supreme National Security Council which sits with the final and actual decision.
No supply of oil is lost yet. It is about the risk of Iran closing the Strait of Hormuz or not. So far not a single drop of oil supply has been lost to the global market. The price at the moment is all about the assessed risk of loss of supply. Will Iran choose to choke of the Strait of Hormuz or not? That is the big question. It would be painful for US consumers, for Donald Trump’s voter base, for the global economy but also for Iran and its population which relies on oil exports and income from selling oil out of that Strait as well. As such it is not a no-brainer choice for Iran to close the Strait for oil exports. And looking at the il price this morning it is clear that the oil market doesn’t assign a very high probability of it happening. It is however probably well within the capability of Iran to close the Strait off with rockets, mines, air-drones and possibly sea-drones. Just look at how Ukraine has been able to control and damage the Russian Black Sea fleet.
What to do about the highly enriched uranium which has gone missing? While the US and Israel can celebrate their destruction of Iranian nuclear facilities they are also scratching their heads over what to do with the lost Iranian nuclear material. Iran had 408 kg of highly enriched uranium (IAEA). Almost weapons grade. Enough for some 10 nuclear warheads. It seems to have been transported out of Fordow before the attack this weekend.
The market is still on edge. USD 80-something/b seems sensible while we wait. The oil market reaction to this weekend’s events is very muted so far. The market is still on edge awaiting what Iran will do. Because Iran will do something. But what and when? An oil price of 80-something seems like a sensible level until something do happen.


Hur säkrar vi Sveriges tillgång till kritiska metaller och mineral i en ny geopolitisk verklighet?

Lundin Mining ska bli en av de tio största kopparproducenterna i världen

Sommarvädret styr elpriset i Sverige

Samtal om flera delar av råvarumarknaden
Tightening fundamentals – bullish inventories from DOE

Stor uppsida i Lappland Guldprospekterings aktie enligt analys
Silverpriset släpar efter guldets utveckling, har mer uppsida

Uppgången i oljepriset planade ut under helgen

Låga elpriser i sommar – men mellersta Sverige får en ökning

Mahvie Minerals växlar spår – satsar fullt ut på guld
-
 Nyheter4 veckor sedan
Stor uppsida i Lappland Guldprospekterings aktie enligt analys
-
 Nyheter4 veckor sedan
Silverpriset släpar efter guldets utveckling, har mer uppsida
-
 Nyheter3 veckor sedan
Uppgången i oljepriset planade ut under helgen
-
 Nyheter3 veckor sedan
Låga elpriser i sommar – men mellersta Sverige får en ökning
-
 Nyheter2 veckor sedan
Mahvie Minerals växlar spår – satsar fullt ut på guld
-
Analys3 veckor sedan
Very relaxed at USD 75/b. Risk barometer will likely fluctuate to higher levels with Brent into the 80ies or higher coming 2-3 weeks
-

 Nyheter1 vecka sedan
Oljan, guldet och marknadens oroande tystnad
-

 Nyheter1 vecka sedan
Jonas Lindvall är tillbaka med ett nytt oljebolag, Perthro, som ska börsnoteras