

Analys
SEB – Råvarukommentarer, 25 mars 2013

Rekommendationer
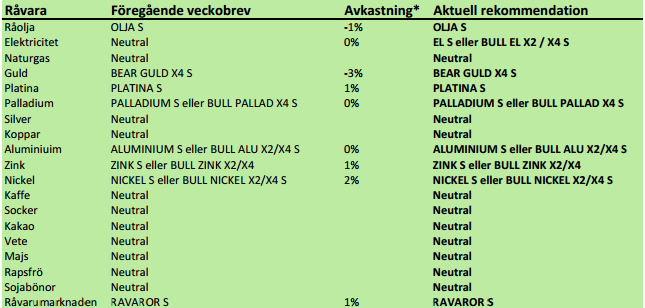
*) Avkastningen avser 1:1 råvarucertifikat där de ingår i rekommendationen. I den aktuella tabellen ovan har jag tagit prisförändringen den senaste veckan sedan det förra veckobrevet publicerades.
Inledning
VETE S med en uppgång sedan förra veckan på 4% tillhör en av veckans vinnare. Vår analys av WASDE-statstiken från det amerikanska jordbruksdepartementet för ett par veckor sedan, sade att prisfallet var över och att vi kunde vänta oss en rekyl uppåt. Det är precis vad som har hänt. Vi tror fortfarande att det handlar om en rekyl och rekommenderar därför inte en köpt position i vete eller majs.
EL S och NATGAS S har också stigit med 4%. Det är det kalla och torra vädret som gör att efterfrågan på värme stiger. I Norden visar det sig främst i EL S och i USA är det naturgasen som man kan handla via NATGAS S – certifikatet. Både el och amerikansk naturgas har fallit mycket i pris de senaste två åren och kan stå inför en längre uppgångsfas.
Råvaruindex
I diagrammet nedan ser vi SEB:s råvaruindex (svart) och DJUBS (röd). DJUBS innehåller mer jordbruksprodukter, som rekylerat uppåt den senaste tiden, vilket förklarar uppgången i det indexet. SEB:s råvaruindex innehåller förhållandevis mer petroleum (39%), som fallit i pris.
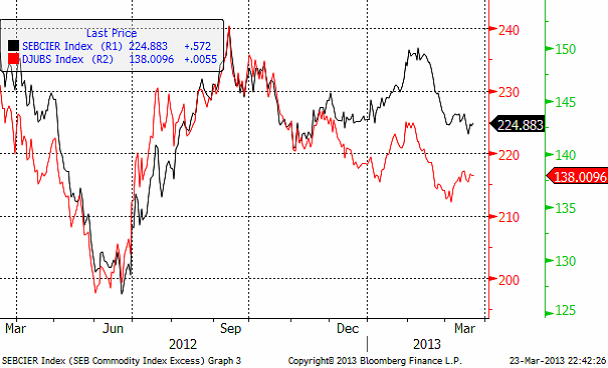
Den som vill investera i indexet och den investeringsstrategi som ligger bakom kan läsa mer om certifikatet RAVAROR S.
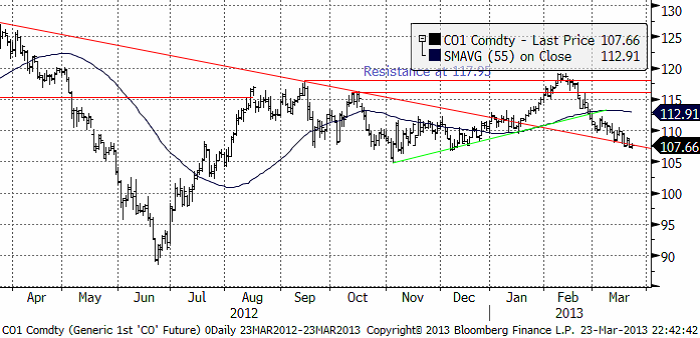
Råolja – Brent
Oljepriset har fortsatt att falla. Tekniskt ligger priset som vi ser ganska mitt i ett kursintervall mellan 105 och 110 dollar, som under förra året utgjorde en lägre nivå i det lite större intervallet 105 – 120 dollar. 105 dollar av allt att döma en viktig stödnivå.
Lagren och lagerförändringarna i USA per den 15 mars ser vi nedan, enligt Department of Energy och American Petroleum Institute.
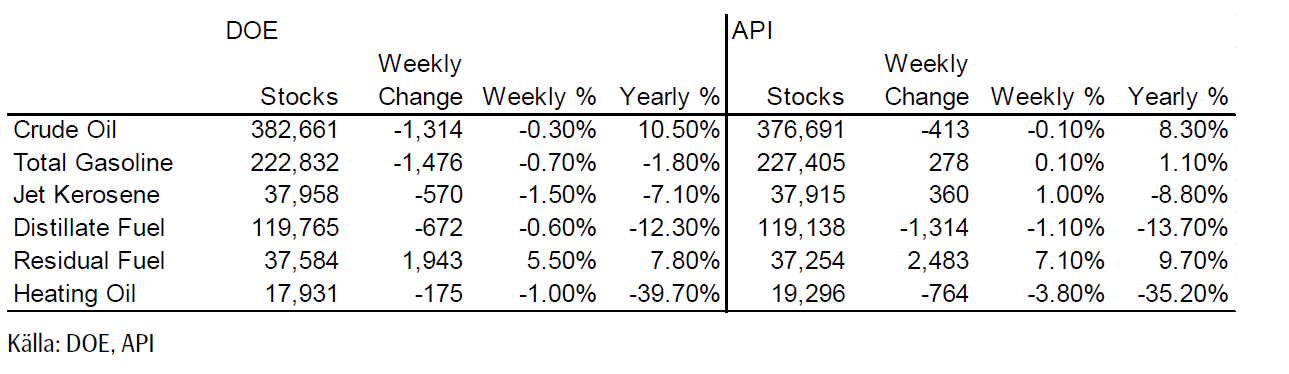
Nedan ser vi amerikanska råoljelager enligt DOE i tusen fat. Den svarta kurvan är 2012 års lagernivåer vecka för vecka och den lilla röda linjen är 2013 års nivå. Vi ser att lagernivåerna fortsätter att vara högre än de varit sedan 2007 för den här tiden på året.
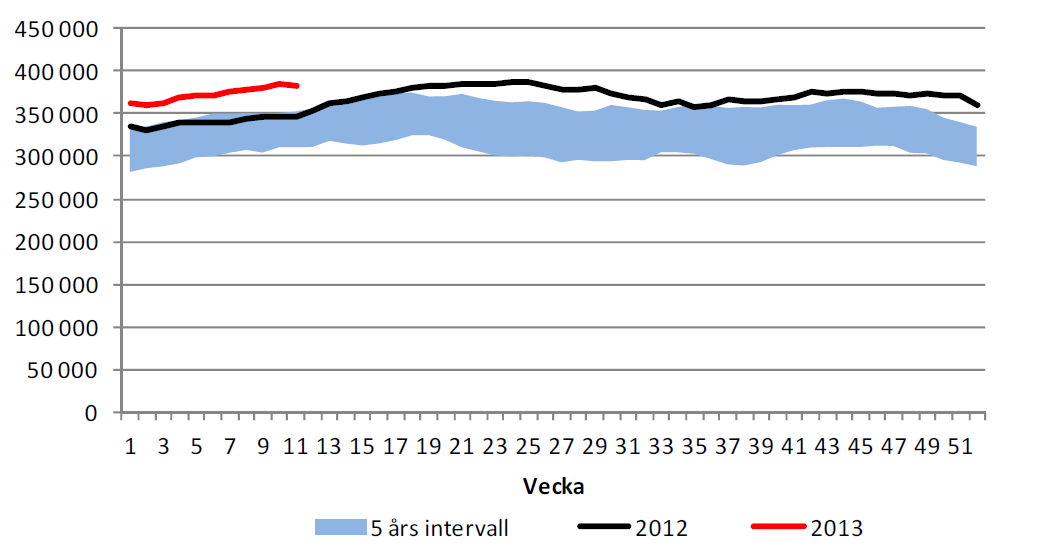
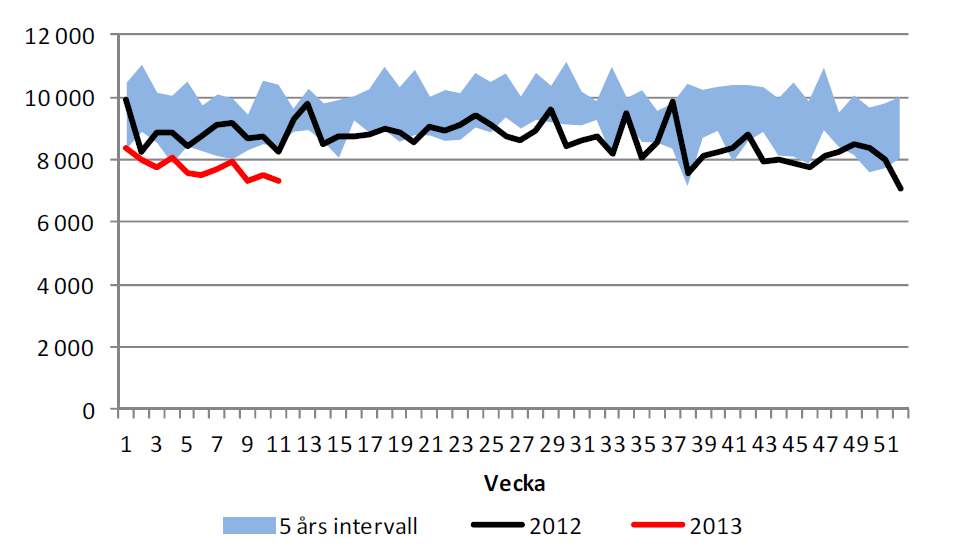
Lagren ökar samtidigt som vi ser att importen av råolja till USA fortsätter att minska. I veckans statistik minskade importtakten ytterligare.
Vi rekommenderar köp av OLJA S, men inte av BULL OLJA S. Anledningen till denna skillnad och att vi rekommenderar köp av OLJA S är för att rabatten på terminerna innebär en stadig intäkt om ca 6% till 7% per år + ränta på kapitalet. Nu när priset dessutom kommit ner mot den lägre delen av det etablerade prisintervallet 105 – 120 dollar är läget att köpa OLJA S särskilt bra.
Elektricitet
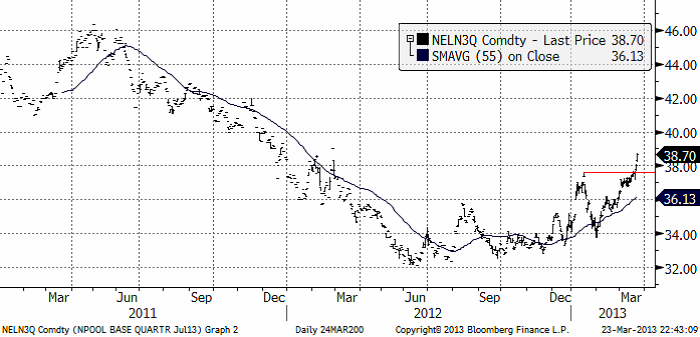
Priset på el gick genom motståndet vid 37.5 euro per MWh. Därmed bekräftades igen den positiva trenden. Vi går därför tillbaka till vår köprekommendation, något mer styrkta i vår tro på högre priser. Det förefaller som om botten på en den långa prisnedgången från vintern 2010/2011 har noterats. Vintern 2010/2011 handlades fast pris för ett kvartal på över 80 euro per MWh. Nedan ser vi den senaste kursutvecklingen i terminskontraktet för det tredje kvartalet.
Bakom den senaste veckans prisuppgång ligger en hausse-artad prisuppgång i utsläppsrätter för koldioxid. Trots svagheten i marknaden för energikol, fick detta kostnaden för att producera el med kolkraft att gå upp. Nedan ser vi kvatalskontraktet på Nordpool (euro/MWh) som den vita kurvan. Den röda kurvan är kostnaden för att producera 1 MWh timme med kol och utsläppsrätter.
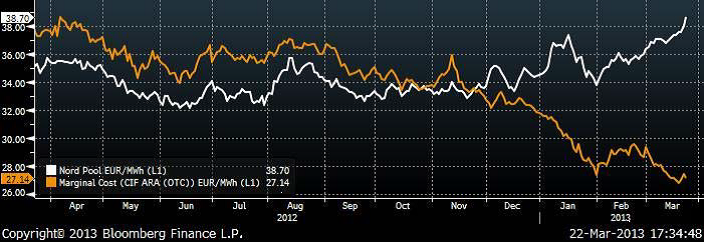
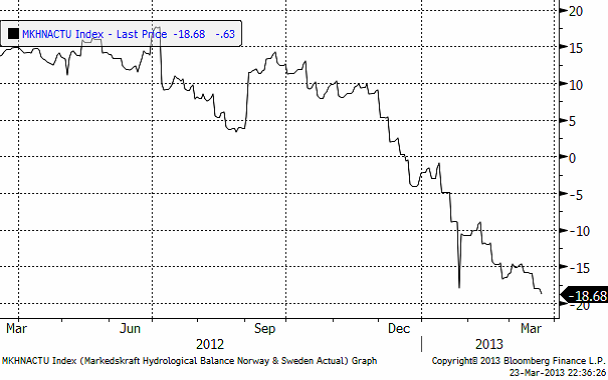
Det är en kall och torr vår gör sommaren kort, skrev Lars Wivallius år 1642. Den hydrologiska balansen för NordPools börsområde har sjunkit ytterligare från -15.89 TWh till -18.68 TWh. I prognosen ligger den på -26 TWh. Det är en nivå där vattenkraften kan bli en av de dyrare energikällorna under det tredje kvartalet.
Sammanfattningsvis. Situationen har klarnat då priset snabbt bröt igenom motståndet på 37.5 euro / MWh. Bull-marknaden är bekräftad och vi rekommenderar en köpt position i elpriset. För normal risknivå väljer man EL S. Den som vill ta mer risk kan välja BULL EL X2 S och den som vill ta riktigt mycket risk och få fyra gångers hävstång på dagliga prisförändringar väljer BULL EL X4 S.
Naturgas
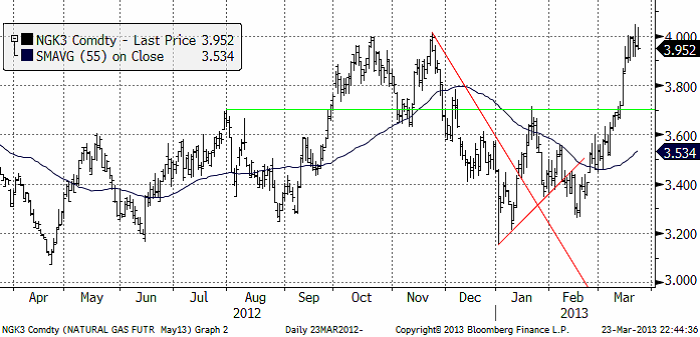
Det är kallt även i USA och naturgaspriset har påverkats av detta även där. Naturgasterminen på NYMEX (maj 2013) har handlats upp ordentligt och testar nu 4 dollar, där priset vänt ner två gånger tidigare. Vi fortsätter att hålla oss neutralt till naturgasen – men skulle ett brott ske av 4 dollar – är det en tydlig köpsignal. Vi ser kursdiagrammet nedan:
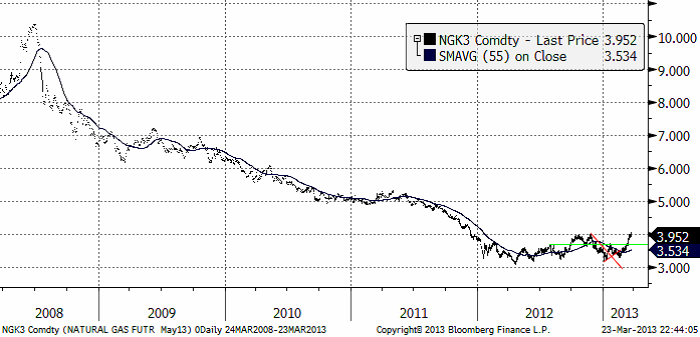
För lite mer perspektiv, ser vi kursutvecklingen på samma maj-kontrakt för de senaste fem åren nedan. Det ser onekligen ut som om något håller på att hända med priset – shale gas till trots!
Nedanför ser vi Within-day naturgaspris (spot) i Storbritannien. Priset är i pence per therm. The virtual gas hub operated by the TSO National Grid. Priset ligger nu på 100 pence. Detta beror på kylan där det väntas snö i England i helgen.
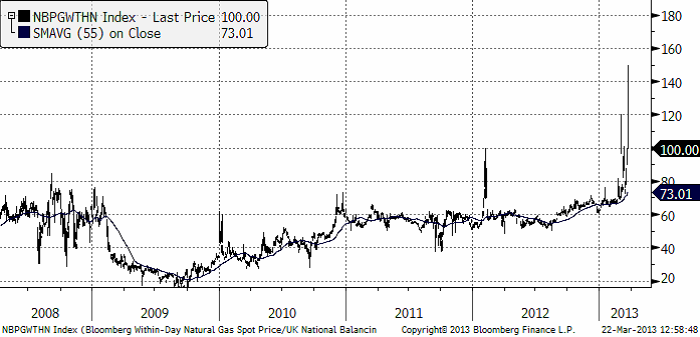
Vi erbjuder inte handel i små poster på den engelska naturgasmarknaden, men som vi ser är kylan just nu onormalt svår. Global temperatur håller dessutom på att bryta alla konfidensintervall nedåt från FN:s klimatpanels prognoser. De senaste årens energiproduktionsplanering som förutsatt varmare väder, kan, om temperaturen blir lägre leda till högre priser på marknaderna.
Guld och Silver
Jag tycker inte att priset på guld har handlats så starkt på Cypernkrisen som det skulle ha gjort för några år sedan, när uppåt-trenden i guldpriset var starkare. Guldmarknaden är betydligt svagare än vad man skulle kunna ha väntat sig. Jag misstänker att priset kommer att ha mycket lätt att falla om Cypernkrisen antingen glöms bort eller löses på något sätt. I det läget är det nog inte så bra att vara köpt guld.
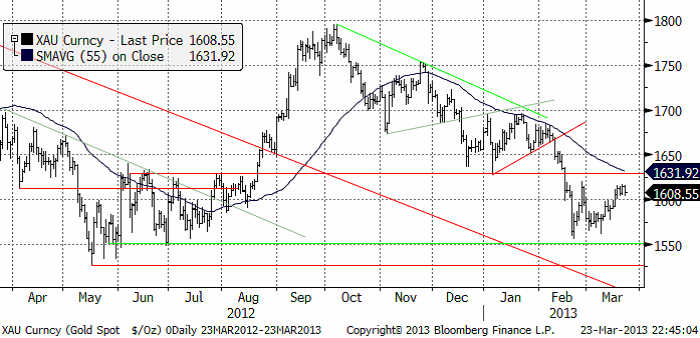
Hela uppgångne de två senaste veckorna ser mer ut som en rekyl och det skulle inte förvåna om det kommer en prisnedgång i veckan. Priset är dock nere i ett intervall med botten kring 1500 – 1550 och en övre nivå på 1630. På lite längre sikt är detta kanske en nivå varifrån priset kommer att vända uppåt när de långsiktiga faktorerna får verka. På kort sikt ligger priset högt i det här intervallet.
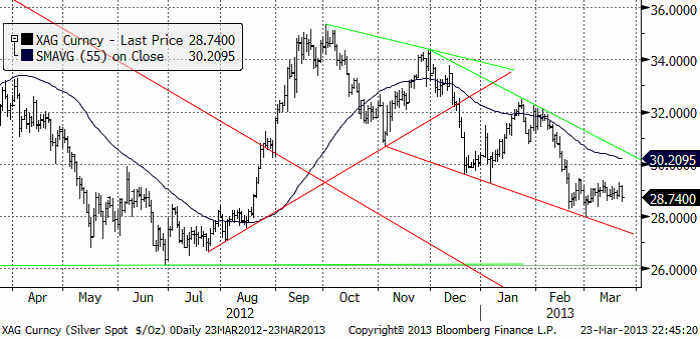
Nedan ser vi kursdiagrammet för silver i dollar per troy ounce. Priset har fortsatt att röra sig sidledes och inte markerat samma uppgång på Cypernkrisen som guldet. Silver visar därmed större trendmässig svaghet än guldet. Vi fortsätter därför att vara köpta BEAR SILVER X2/X4 S.
Platina & Palladium
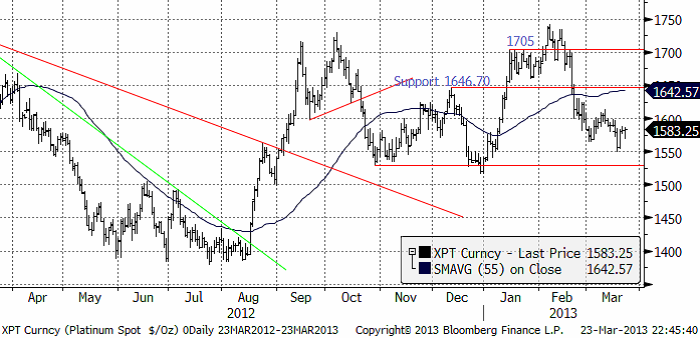
Platinapriset ligger strax över stödet på 1550 dollar, som testades – och höll – i veckan som gick. Om 1525 – 1550 byts på nedsidan är nästa stöd 1400.
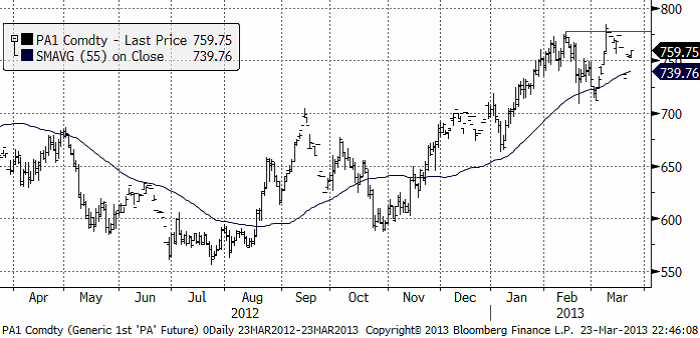
Palladium rekylerade färdigt i veckan som gick och avslutade veckan med prisuppgångar.
Basmetaller
Veckan inleddes med beskedet om engångsskatten på Cypern som villkor för stödlånen, och påföljande försvagning av Euron. Det innebär starkare dollar, och svagare råvaror. Metallerna tog ordentligt med stryk inledningsvis, med ett par procent. Resten av veckan präglades till stor del av nyhetsflödet kring Cypern. Övrig makrodata kom därför lite i skymundan. Det har bl.a. redovisats preliminär inköpsindexdata som kom in starkare än väntat i både Kina och USA, men svagare i Europa. Temat kvarstår med positiva tecken i USA, Kina försiktigt positiv medan Europa är sänket. Netto för metallerna innebär detta en svag nedgång för koppar och aluminium. Zink är oförändrad på veckan medan nickel visar styrka med en uppgång på ett par procent.
Koppar
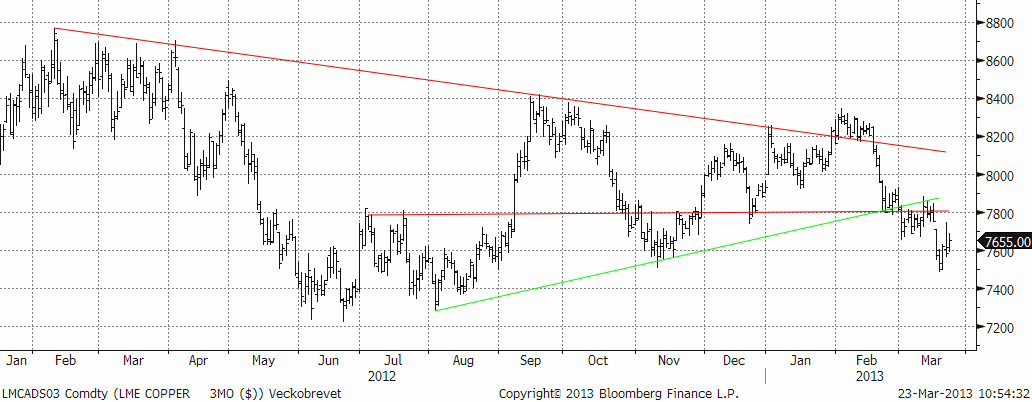
Priset har rört sig kraftigt i veckan. Efter den inledande ”Cypernfrossan” och en lägsta notering på $7500 för 3-månaders koppar på LME, såg vi nivåer på $7750 i mitten av veckan (med stöd av positiv inköpsstatistik från Kina). Veckan avslutas oförändrat till svagt nedåt. Prisskillnaden mellan inhemska priser i Kina och LME är nu till LME:s fördel. Baserat på historiska mönster brukar det innebära ökad Kinesisk import. De närmsta månaderna blir därför en ”test” på hur den inhemska konsumtionen ser ut. Skillnaden mot tidigare cykler är att LME-lagret (se nedan) har hunnit öka mer än vanligt. Så även om Kina ökar importtakten så dröjer det innan det blir brist utanför Kina.
LME-lager Koppar (Mton)
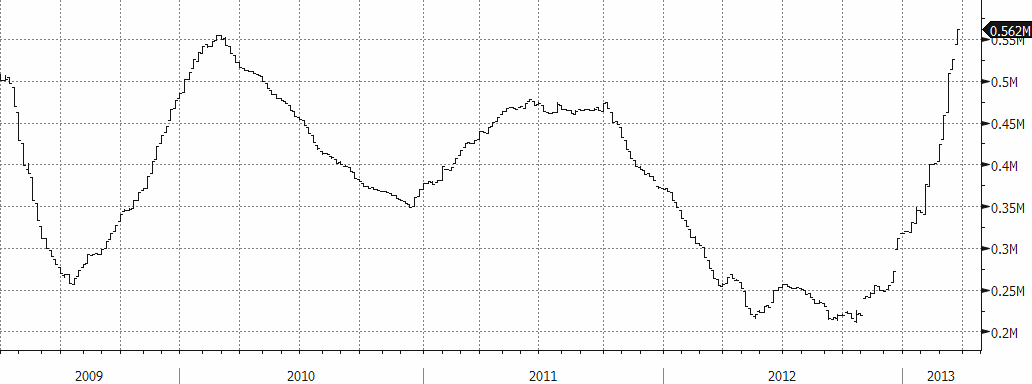
Den tekniska bilden ger stöd till vår neutrala position. Vi är positiva till basmetaller på sikt men avvaktar bättre köptillfällen alternativt väljer någon annan basmetall. Den stora triangelformationen börjar spela ut sin roll. Stödnivåer noteras vid 7600 och 7400. Nivån 7800 fungerar nu som motstånd.
Som vi skrivit tidigare tyder mycket på ökat utbud för koppar, vilket ökar risken för en lite trögare marknad. Vi ser inte den stora potentialen på koppar på uppsidan just nu. Vi rekommenderar därför en fortsatt neutral position. För den som vill satsa på ett starkare tillväxtscenario (än konsensus) i Kina är koppar däremot alltid ett intressant alternativ.
Aluminium
Som vi skrivit tidigare ligger aluminium väldigt ”fast” i ett relativt stort handelsintervall. Nivåer kring $1800-1900 utgör ur ett kostnadsperspektiv starkt stöd. Samtidigt lägger det stora utbudet ett ”tak” på nivåer kring $2300. Den senaste uppgången i februari mötte stora säljordrar från producenter som passade på att ”låsa” framtida priser, vilket satte press på marknaden. Nu när priserna fallit tillbaka ser vi stora intressen från köpsidan (fysiska förbrukare). För den ”trading-benägne” utgör det stora spannet goda vinstmöjligheter.
P.g.a. den låga prisnivån i relation till marginalkostnaden är aluminium köpvärd och vi ansluter den till köprekommendationerna.
Zink
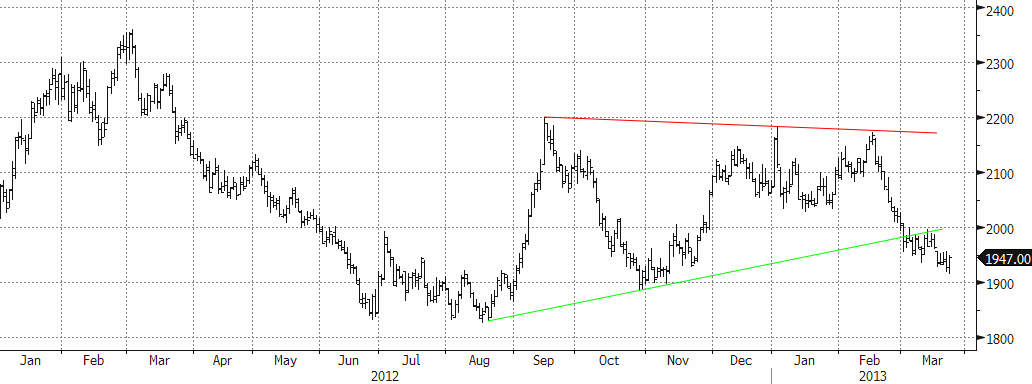
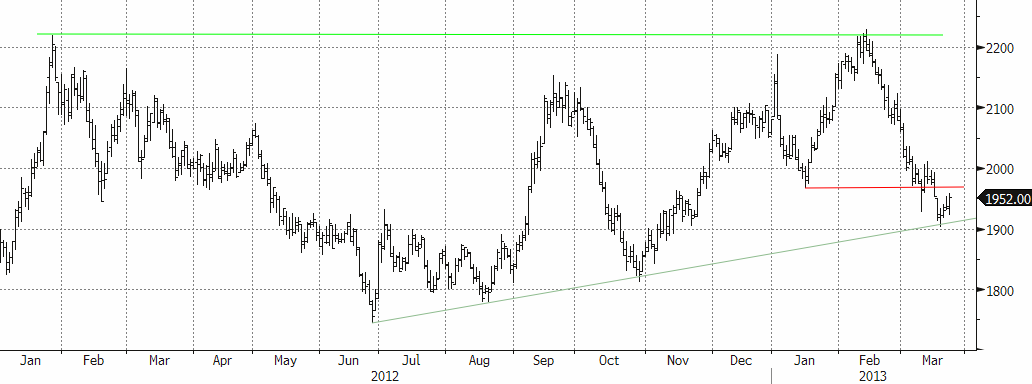
Under veckans inledning (i samband med nyhetsflödet kring Cypern) bröts även stödnivån $1975. Som lägst handlades nivåer i närheten av den starka stöd linjen, som kommer in strax över $1900. Det ”gamla” stödet utgör ett nu istället ett motstånd om det prövas underifrån. Tekniskt sett bör man avvakta lite för att se om trendlinjen håller, och bryter 1975 igen så är det ett köp. Fundamentalt är zinken ”billig” ur ett kostnadsperspektiv och nuvarande nivåer är intressanta på lite längre sikt (12 månader).
Nickel
Efter den stora tillbakagången ser vi en tydlig stabilisering av priset. Ur ett kostnadsperspektiv börjar nickel bli en väldigt intressant köpkandidat. Marknaden är fortsatt tveksam till den fundamentala situationen. Vi har tidigare bl.a. hänvisat till kommentarer från fysiska aktörer som indikerar att ”det finns gott om nickel”, samtidigt som rapporter gör gällande att exporten av nickelmalm från Indonesien till Kina ökar igen, vilket riskerar att öka utbudet av s.k. Nickel Pig Iron i Kina (vilket i sin tur minskar efterfrågan på nickelbärande skrot och primärnickel). Det senare håller nu på att ”svänga om” då kinesiska producenter är snabba att ställa om produktionen. Det ger ett naturligt stöd till nickelmarknaden. Veckans utveckling kan dock mana till viss försiktighet. Förra veckans toppar kring $17300 kommer att utgöra motstånd. För den som vill komma in i marknaden kan det vara värt att avvakta, och antingen köpa kring stödet vid $16500 alternativt vid ett brott av $17300.
Vi rekommenderar köp av NICKEL S eller BULL NICKEL X2 / X4 S för den som vill ta mer risk. Vi varnade för en rekyl, och den kom. Priset har fallit mer än ”befarat”, men är nu på väldigt attraktiva nivåer.
Kaffe
Kaffepriset (maj 2013) fortsatte ner i veckan som gick och fortsatte därmed den fallande trenden.
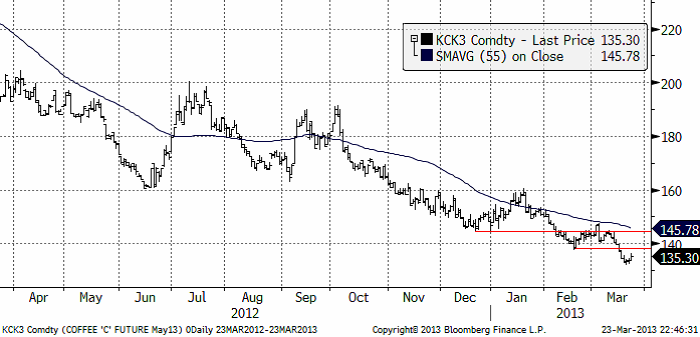
CEPEA rapporterar från Brasilien att det fortfarande finns gott om arabica av 2012/2013 års skörd kvar. En undersökning gjord av CEPEA visar att mellan 30% och 40% av skörden fortfarande finns i lager på gårdarna. I Espirito Santo, där Robusta odlas, finns 20% kvar. Robusta har den senaste säsongen varit ovanligt ”dyrt” i förhållande till arabica. Bönderna har utnyttjat detta genom att sälja mer av Robusta. Efterfrågan på arabica har också haft fokus på de sämre kvaliteterna. Därför är det till största delen arabica av god kvalitet som finns kvar osålt på gårdarna. Försäljningstakten sedan oktober har varit lägre än tidigare år. I Cerrado-regionen av Minas Gerais har bara 10% sålts. Cerrado är ett område som producerar förstklassigt kaffe.
Förra veckan gick vi över till neutral rekommendation från köp. Fortfarande väntar vi på tydligare tecken på att en botten etablerats. Kaffepriset är lågt och kommer säkerligen att vara högre om ett år eller två, men det är onödigt att köpa för tidigt.
Socker
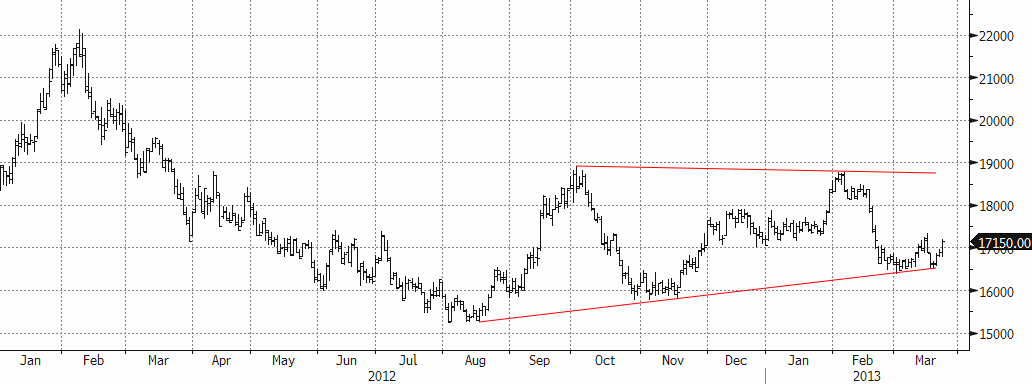
Sockerpriset (maj 2013) som inte lyckades ta sig över 19 cent, har fortsatt att falla i pris. Trendlinjen från pristoppen i juli förra året är dock bruten, vilket är ett positivt tecken. Vi ser prisfallet nu som en rekyl nedåt, snarare än ett återfall in i den fallande pristrenden.
Den brasilianska regeringen har sänkt skatterna på matvaror i landet, bland annat på socker. Enligt CEPEA är det nu marginellt mer lönsamt att producera socker än etanol.
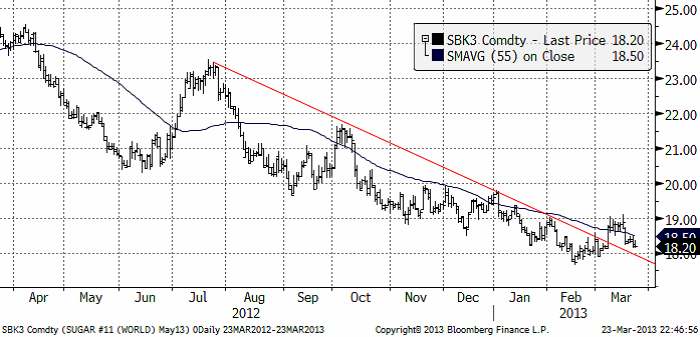
Vi tror att en trendvändning kan vara på gång. I februari fann marknaden stöd vid och strax under 18 cent (på majkontraktet). Det ser ut som om marknaden vill testa den nivån igen. Håller den – och priset vänder upp därifrån – ökar sannolikheten för en trendvändning uppåt.
[box]SEB Veckobrev Veckans råvarukommentar är producerat av SEB Merchant Banking och publiceras i samarbete och med tillstånd på Råvarumarknaden.se[/box]
Disclaimer
The information in this document has been compiled by SEB Merchant Banking, a division within Skandinaviska Enskilda Banken AB (publ) (“SEB”).
Opinions contained in this report represent the bank’s present opinion only and are subject to change without notice. All information contained in this report has been compiled in good faith from sources believed to be reliable. However, no representation or warranty, expressed or implied, is made with respect to the completeness or accuracy of its contents and the information is not to be relied upon as authoritative. Anyone considering taking actions based upon the content of this document is urged to base his or her investment decisions upon such investigations as he or she deems necessary. This document is being provided as information only, and no specific actions are being solicited as a result of it; to the extent permitted by law, no liability whatsoever is accepted for any direct or consequential loss arising from use of this document or its contents.
About SEB
SEB is a public company incorporated in Stockholm, Sweden, with limited liability. It is a participant at major Nordic and other European Regulated Markets and Multilateral Trading Facilities (as well as some non-European equivalent markets) for trading in financial instruments, such as markets operated by NASDAQ OMX, NYSE Euronext, London Stock Exchange, Deutsche Börse, Swiss Exchanges, Turquoise and Chi-X. SEB is authorized and regulated by Finansinspektionen in Sweden; it is authorized and subject to limited regulation by the Financial Services Authority for the conduct of designated investment business in the UK, and is subject to the provisions of relevant regulators in all other jurisdictions where SEB conducts operations. SEB Merchant Banking. All rights reserved.

Wild moves yesterday. Brent crude traded to a high of $114.43/b and a low of $96.0/b and closed at $99.94/b yesterday.

US – Iran negotiations ongoing or not? What a day. Donald Trump announced that good talks were ongoing between Iran and the US and that the 48 hour deadline before bombing Iranian power plants and energy infrastructure was postponed by five days subject to success of ongoing meetings. Iranian media meanwhile stated that no meetings were ongoing at all.
Today we are scratching our heads trying to figure out what yesterday was all about.
Friends and family playing the market? Was it just Trump and his friends and family who were playing with oil and equity markets with $580m and $1.46bn in bets being placed by someone in oil and equity markets just 15 minutes before Trump’s announcement?
Was Trump pulling a TACO as he reached his political and economic pain point: Brent at $112/b, US Gas at $4/gal, SPX below 200dma and US 10yr above 4.4%?
Different Iranian factions with Trump talking with one of them? Are there real negotiations going on but with the US talking to one faction in Iran while another, the hardliners, are not involved and are denying any such negotiations going on?
Extending the ultimatum to attack and invade Kharg island next weekend? Or, is the five day delay of the deadline a tactical decision to allow US amphibious assault ships and marines to arrive in the Gulf in the upcoming weekend while US and Israeli continues to degrade Iranian military targets till then. And then next weekend a move by the US/Israel to attack and conquer for example the Kharg island?
We do not really know which it is or maybe a combination of these.
We did get some kind of TACO ydy. But markets have been waiting for some kind of TACO to happen and yesterday we got some kind of TACO. And Brent crude is now trading at $101.5/b as a result rather than at $112-114/b as it did no the high yesterday.
But what really matters in our view is the political situation on the ground in Iran. Will hardliners continue to hold power or will a more pragmatic faction gain power?
If the hardliners remain in power then oil pain should extend all the way to US midterm elections. The hardliners were apparently still in charge as of last week. Iran immediately retaliated and damaged LNG infrastructure in Qatar after Israel hit Iranian South Pars. The SoH was still closed and all messages coming out of Iran indicated defiance. Hardliners continues in power has a huge consequence for oil prices going forward. The regime has played its ’oil-weapon’ (closing or chocking the Strait of Hormuz). It is using it to achieve political goals. Deterrence: it needs to be so politically and economically expensive to attack Iran that it won’t happen again in the future. Or at least that the US/Israel thinks 10-times over before they attack again. The highest Brent crude oil closing price since the start of the war is $112.19/b last Friday. In comparison the 20-year inflation adjusted Brent price is $103/b. So Brent crude last Friday at $112.19/b isn’t a shockingly high price. And it is still far below the nominal high of $148/b from 2008 which is $220/b if inflation adjusted. So once in a lifetime Iran activates its most powerful weapon. The oil weapon. It needs to show the power of this weapon and it needs to reap political gains. Getting Brent to $112/b and intraday high of $119.5/b (9 March) isn’t a display of the power of that weapon. And it is not a deterrence against future attacks.
So if the hardliners remain in power in Iran, then the SoH will likely remain chocked all the way to US midterm elections and Brent crude will at a minimum go above the historical nominal high of $148/b from 2008.
Thus the outlook for the oil price for the rest of the year doesn’t depend all that much of whether Trump pulls a TACO or not. Stops bombing or not. It depends more on who is in charge in Iran. If it is the hardliners, then deterrence against future attacks via chocking of the SoH and high oil prices is the likely line of action. It is impacting the world but the Iranian ’oil-weapon’ is directed towards the US president and the the US midterm elections.
If a pragmatic faction gets to power in Iran, then a very prosperous future is possible. However, if power is shifting towards a more pragmatic faction in Iran then a completely different direction could evolve. Such a faction could possibly be open for cooperation with the US and the GCC and possibly put its issues versus Israel aside. Then the prosperity we have seen evolving in Dubai could be a possible future also for Iran.
So far it looks like the hardliners are fully in charge. As far as we can see, the hardliners are still fully in control in Iran. That points towards continued chocking of the SoH and oil prices ticking higher as global inventories (the oil market buffers) are drawn lower. And not just for a few more weeks, but possibly all the way to the US midterm elections.
A brief sigh of relief yesterday as oil infra at Kharg wasn’t damaged. But higher today. Brent crude dabbled around a bit yesterday in relief that oil infrastructure at Iran’s Kharg island wasn’t damaged. It traded briefly below the 100-line and in a range of $99.54 – 106.5/b. Its close was near the low at $100.21/b.
No easy victorious way out for Trump. So no end in sight yet. Brent is up 3.2% today to $103.4/b with no signs that the war will end anytime soon. Trump has no easy way to declare victory and mission accomplished as long as Iran is in full control of the Strait of Hormuz while also holding some 440 kg of uranium enriched to 60% and not far from weapons grade at 90%. As long as these two factors are unresolved it is difficult for Trump to pull out of the Middle East. Naturally he gets increasingly frustrated over the situation as the oil price and US retail gas prices keeps ticking higher while the US is tied into the mess in the Middle East. Trying to drag NATO members into his mess but not much luck there.
When commodity prices spike they spike 2x, 3x, 4x or 5x. Supply and demand for commodities are notoriously inflexible. When either of them shifts sharply, the the price can easily go to zero (April 2022) or multiply 2x, 3x, or even 5x of normal. Examples in case cobalt in 2025 where Kongo restricted supply and the price doubled. Global LNG in 2022 where the price went 5x normal for the full year average. Demand for tungsten in ammunition is up strongly along with full war in the middle east. And its price? Up 537%.
Why hasn’t the Brent crude oil price gone 2x, 3x, 4x or 5x versus its normal of $68/b given close to full stop in the flow of oil of the Strait of Hormuz? We are after all talking about close to 20% of global supply being disrupted. The reason is the buffers. It is fairly easy to store oil. Commercial operators only hold stocks for logistical variations. It is a lot of oil in commercial stocks, but that is predominantly because the whole oil system is so huge. In addition we have Strategic Petroleum Reserves (SPRs) of close to 2500 mb of crude and 1000 mb of oil products. The IEA last week decided to release 400 mb from global SPR. Equal to 20 days of full closure of the Strait of Hormuz. Thus oil in commercial stocks on land, commercial oil in transit at sea and release of oil from SPRs is currently buffering the situation.
But we are running the buffers down day by day. As a result we see gradually increasing stress here and there in the global oil market. Asia is feeling the pinch the most. It has very low self sufficiency of oil and most of the exports from the Gulf normally head to Asia. Availability of propane and butane many places in India (LPG) has dried up very quickly. Local prices have tripled as a result. Local availability of crude, bunker oil, fuel oil, jet fuel, naphtha and other oil products is quickly running down to critical levels many places in Asia with prices shooting up. Oman crude oil is marked at $153/b. Jet fuel in Singapore is marked at $191/b.
Oil at sea originating from Strait of Hormuz from before 28 Feb is rapidly emptied. Oil at sea is a large pool of commercial oil. An inventory of oil in constant move. If we assume that the average journey from the Persian Gulf to its destinations has a volume weighted average of 13.5 days then the amount of oil at sea originating from the Persian Gulf when the the US/Israel attacked on 28 Feb was 13.5 days * 20 mb/d = 269 mb. Since the strait closed, this oil has increasingly been delivered at its destinations. Those closest to the Strait, like Pakistan, felt the emptying of this supply chain the fastest. Propane prices shooting to 3x normal there already last week and restaurants serving cold food this week is a result of that. Some 50-60% of Asia’s imports of Naphtha normally originates from the Persian Gulf. So naphtha is a natural pain point for Asia. The Gulf also a large and important exporter of Jet fuel. That shut in has lifted jet prices above $200/b.
To simplify our calculations we assume that no oil has left the Strait since that date and that there is no increase in Saudi exports from Yanbu. Then the draining of this inventory at sea originated from the Persian Gulf will essentially look like this:
The supply chain of oil at sea originating from the Strait of Hormuz is soon empty. Except for oil allowed through the Strait of Hormuz by Iran and increased exports from Yanbu in the Red Sea. Not included here.

Oil at sea is falling fast as oil is delivered without any new refill in the Persian Gulf. Waivers for Russian crude is also shifting Russian crude to consumers. Brent crude will likely start to feel the pinch much more forcefully when oil at sea is drawn down another 200 mb to around 1000 mb. That is not much more than 10 days from here.

Oil and oil products are starting to become very pricy many places. Brent crude has still been shielded from spiking like the others.

Closing at highest since Aug 2022. Brent crude gained 9.2% yesterday. The trading range was limited to $95.2 – 101.85/b with a close at $100.46/b and higher than the Monday close of $98.96/b. Ydy close was the highest close since August 2022. This morning Brent is up 2% to $102.4/b and is trading at the highest intraday level since Monday when it high an intraday high of $119.5/b.
A military hit at Iran’s Kharg island would be a big, big bang for the oil price. The big, big risk for the weekend is that oil infrastructure could be damaged. For example Iran’s Kharg island which is Iran’s major oil export hub. If damaged we would have a longer lasting loss of supply stretching way beyond Trump’s announced ”two more weeks”. It will make the spot price spike higher and it will lift the curve. Brent crude 2027 swap would jump above $80/b immediately. An attack on Kharg island would naturally lead Iran to strike back at other oil infrastructures in the Gulf. Especially those belonging to countries who harbor US military bases. I.e. countries who essentially are supporting the attack by US and Israel towards Iran. Though if not in spirit, then in practical operational terms. An attack on Kharg island would not just lead to a lasting outage of supply from Iran until it would be repaired. It would immediately endanger other oil infrastructure in the region as well and additional lasting loss of supply.
No one in their right mind would dare to sit short oil over the coming weekend. Oil is thus set to close the week at a very strong note today.
Prepare for another 400 mb SPR release next week. This week’s announcement of a 400 mb release from Strategic Oil Reserves totally underwhelmed the market with the oil price going higher rather than lower following the announcement. For one it means that the market expects the war and the closure of the Strait of Hormuz to last longer than Trump’s recent announced ”two more weeks”. 400 mb only amounts to 20 days of lost supply to the world through Hormuz and we are already at day 14. So next week when we are getting close to the 20 day mark, we are likely to see another announcement of another 400 mb release of SPR stocks to the market. Preparing for the next 20 days of war.
Global oil logistics in total disarray. We have previously addressed the issue of the huge logistical web of the global oil market which is now in total disarray. The logistical disruption started to fry the oil market at the end of last week. Helped to spike the oil market on Monday. What we hear from our shipping clients is that the problems with supply of fuels locally in Korea, Singapore, India and Africa are getting worse with physical availability of fuels there drying up. It is getting increasingly difficult to find physical supply of bunker oil with local, physical prices shooting way higher than financial benchmarks. To the point that biofuels have become the cheap option many places. Availability of fuels in the US is still good. Not so surprising as the US is self-sufficient with crude and refineries.
The disruption in global oil logistics doesn’t seem to improve. Rather the opposite. If you cannot get fuel to run your ships, then how can you distribute fuels to where it is needed.
Buy Brent Dec-2026 calls with strike $150/b!! As the days goes by the oil price is ticking higher while Trump is getting one day closer to US midterm elections. Trump was betting that he could put this war to bead well before November. But that will probably not be up to him to decide. It will be up to Iran to decide when to reopen the Strait of Hormuz. It is very hard to imagine that Iran will let Trump easily off the hock after he has killed its Supreme Leader. This will likely go all the way to November. Buy Brent Dec-2026 calls with strike $150/b!!
Brent closed at highest since 2022 ydy. Will end this Friday at a very strong note! Consumers still dreaming of $60/b oil


Christian Kopfer om läget för oljan

Marknaden måste börja betrakta de höga kopparpriserna som det nya normala

Det fysiska spotpriset på brentolja har slagit nytt rekord

40 minuter med Javier Blas om hur världen verkligen påverkas av energikrisen

Efter tillväxten: Guldbrev satsar på expansion i Europa
40 minuter med Javier Blas om hur världen verkligen påverkas av energikrisen

Elpriserna fördubblas, stor osäkerhet inför sommaren

MP Materials, USA:s svar på Kinas dominans över sällsynta jordartsmetaller
Det fysiska spotpriset på brentolja har slagit nytt rekord

Studsvik har idag ansökt om att få bygga 1200-1600 MW kärnkraft i Valdemarsvik
-
 Nyheter2 veckor sedan
40 minuter med Javier Blas om hur världen verkligen påverkas av energikrisen
-
 Nyheter3 veckor sedan
Elpriserna fördubblas, stor osäkerhet inför sommaren
-
 Nyheter4 veckor sedan
MP Materials, USA:s svar på Kinas dominans över sällsynta jordartsmetaller
-
 Nyheter2 veckor sedan
Det fysiska spotpriset på brentolja har slagit nytt rekord
-
 Nyheter4 veckor sedan
Studsvik har idag ansökt om att få bygga 1200-1600 MW kärnkraft i Valdemarsvik
-
 Nyheter2 veckor sedan
Marknaden måste börja betrakta de höga kopparpriserna som det nya normala
-

 Nyheter4 veckor sedan
Matproduktion är beroende av gödsel, Gulfkriget skapar brist
-
Analys4 veckor sedan
TACO (or Whatever It Was) Sends Oil Lower — Iran Keeps Choking Hormuz