

Analys
SEB – Råvarukommentarer, 24 mars 2014

Rekommendationer
Kort sammanfattning
Palladium är den råvara vi är mest positiva till. Elpriset i Norden ser äntligen ut att ha bottnat ut och vi går över till en köprekommendation av EL S. Priset på råolja har brutit sitt tekniska stöd och kan stå inför en större trendförändring nedåt i pris.
Jordbruksprodukterna har fallhöjd och vi tror att risken är stor för fallande priser i det korta perspektivet på i princip allt. Torkan är slut i Brasilien, vilket sätter press på det upphaussade priset på kaffe och socker, men även på sojabönor och majs.
På måndagen den 31 mars publicerar USDA sin årliga ”Prospective Plantings” rapport för USA:s sådd av majs och sojabönor. Vi kommer att hålla seminerier för att gå igenom vad siffrorna säger om marknadsutvecklingen. Dessa äger rum i Malmö på tisdag nästa veckan, i Lidköping och Vadstena på onsdagen och i Stockholm på torsdagen. Inbjudna gästtalare kommer att belysa olika aspekter. I Stockholm kommer situationen i Ukrainas jordbruk att belysas av en extern expert som bedrivit storjordbruk i Ukraina.
Råolja – Brent
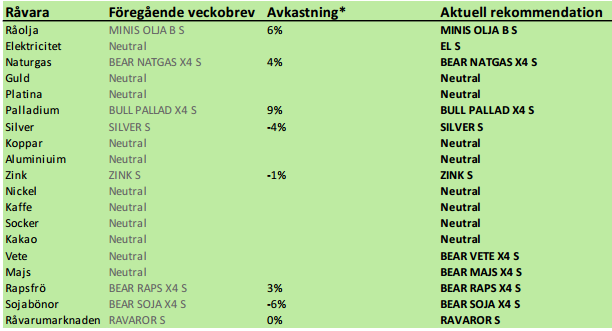
Oljepriset sjönk under lugn handel i veckan från 109 till 108.57 dollar per fat. Vi tror att det är lugnet före stormen, när oljepriset bryter stödet i den stora triangelformation som marknaden handlar inom.
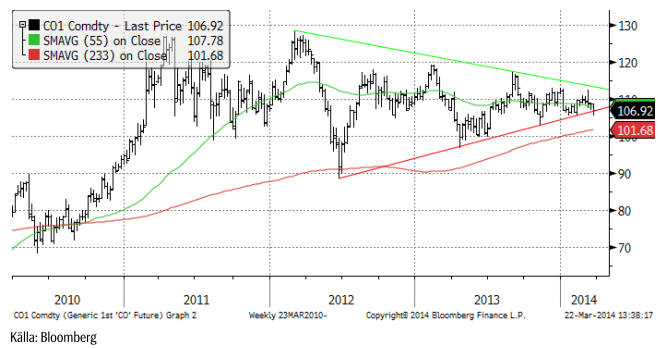
Non-commercials (investerare) minskade sin långa position i terminskontrakt på West Texas Intermediate råolja från 407 miljoner fat till 384 miljoner fat, enligt fredagens CFTC-rapport.
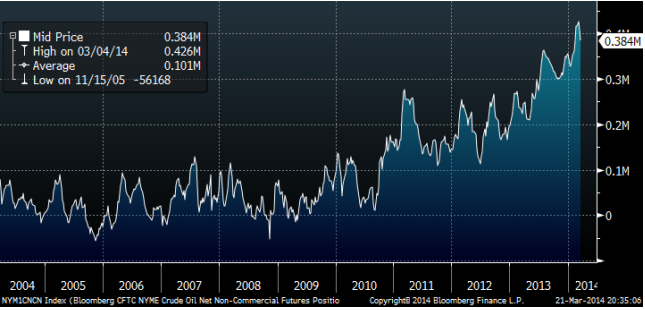
Antalet borr-riggar i USA, statistik som Baker Hughes publicerar klockan 18 CET varje fredag, visar en lite nedgång från förra veckan, till 1803. Trenden till fler borr-riggar är dock tydlig, om än i ett tidigt skede.
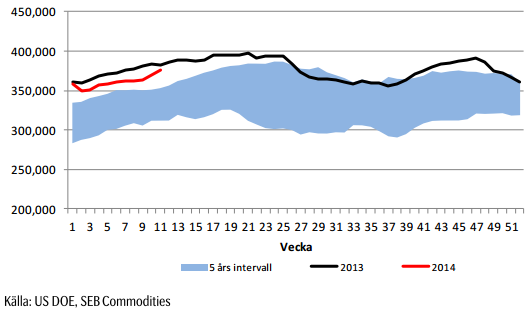
Råoljelagren steg återigen kraftigt i veckans rapport från US Department of Energy. Vi har tidigare sagt att marknaden kommer att komma under press under det andra kvartalet, förmodligen med en ny lägstanotering på olja under april månad, lägre än förra årets botten på 97 dollar. Raffinaderierna i USA ställer om från eldningsolja / diesel till bensin nu och då efterfrågar de mindre olja, med lageruppbyggnad som konsekvens. Som vi ser ökar lageruppbyggnaden mycket snabbare nu än tidigare år, därför att utbudet är mycket större än tidigare år.
Vi rekommenderar en kort position i olja, t ex med MINIS OLJA B S eller MINIS OLJA A S.
Elektricitet
Väderleksprognosen har slagit om från blött och varmt och det innebär att den hydrologiska balansen försvagas med 1.5 TWh till +2.5 – 3 TWh enligt PointCarbon. Marknaden har legat kort och blankarna fick bråttom att köpa tillbaka kontrakt och stänga positioner, vilket gav skjuts uppåt på priset. Som vi har skrivit tidigare kan en vändning uppåt bli våldsam, när den kommer. Vi tror att vi kan ha sett botten vid 24.15 euro per MWh, strax över den jämna nivån 24 euro. Efter en så lång nedgång brukar dock aldrig priserna vända spikrakt uppåt, men vad vi tror att det kan bli oroligt och volatilt den närmaste tiden.
Priset är så lågt ändå, att vi går över från neutral rekommendation till rekommendation att köpa EL S. Det är lite för volatilt för att rekommendera BULL-certifikat.
En risk för framtiden är den massiva utbyggnaden av framförallt solkraft i Tyskland, som en solig dag kan generera kraft motsvarande ca 35 kärnreaktorer (35 GigaWatt), alltså ca 3.5 gånger den svenska kärnkraften. Denna el erbjuds marknaden till noll euro, eftersom det är den rörliga kostnaden.
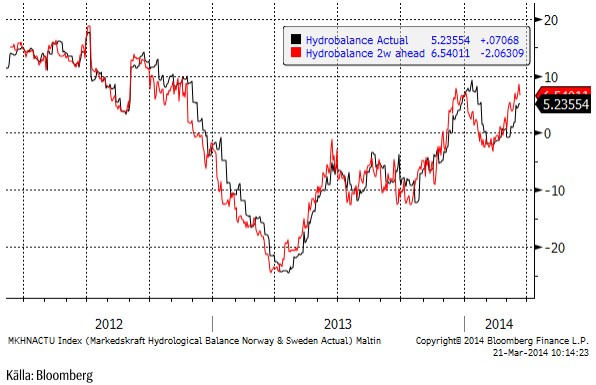
Markedskrafts 2 veckors prognos för hydrologisk balans har till fredagens morgon sjunkit från 8.6 till 6.5 TWh, som vi ser i diagrammet nedan.
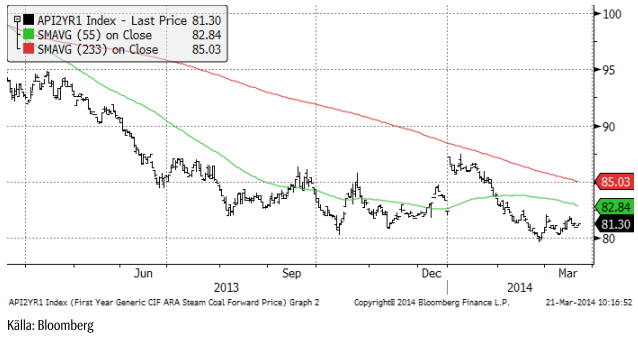
Priset på kol har stabiliserat sig.
Vi går alltså över till köprekommendation från neutral och rekommenderar EL S.
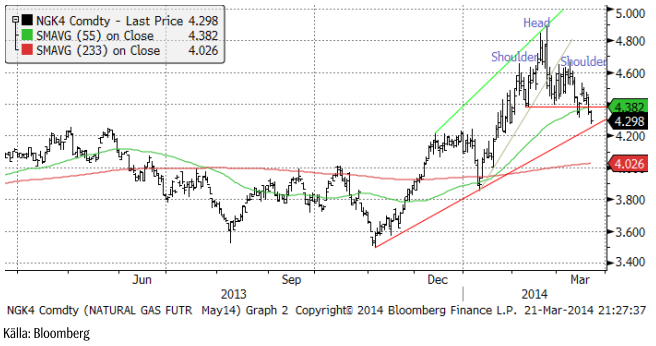
Naturgas
Förra veckan rekommenderade vi köp av BEAR NATGAS X4 S mot bakgrund av att priset stigit en längre tid på det kalla vädret i USA och att varmt väder nu ”borde” komma in i prognosfönstret. Samtidigt såg vi att antalet borr-riggar återigen ökar tydligt och de flesta av dem producerar gas. Japan drar igång sina kärnkraftverk nu och slutar därmed att importera LNG. Det har talats om, bland annat i en annons i New York Times i fredags som en privatperson (!) satt in med anledning av krisen i Ukraina, att EU skulle importera LNG från USA. Om det sker, som en del i det ”paket” som EU och USA ställer upp mot Ryssland efter söndagens ”val” i södra Ukraina, kan det verka stödjande på priset, men annars bör priset i första hand falla ner mot 4.30 – 4.20 dollar per MMBtu. Vi fortsätter med säljrekommendation och behåller BEAR NATGAS X4 S.
Koppar
Kopparpriset stängde ner 34 dollar på veckan till 6430 dollar. Marknaden har handlat ner kopparpriset efter oro för att tillväxten dämpas när USA:s centralbank börjar höja räntan igen. FED publicerade en prognos i veckan som gick att räntan kommer att vara 1% mot slutet av nästa år och 2.25% om två år. Tekniskt motstånd finns nu på 6750 dollar. Ur ett tekniskt perspektiv är det, trots fyndköpsrekommendationerna som förekommer i emailade snabbkommenterar från olika banker, större risk för fortsatt nedgång i det korta perspektivet, än att priserna återgår till 7000 dollar.
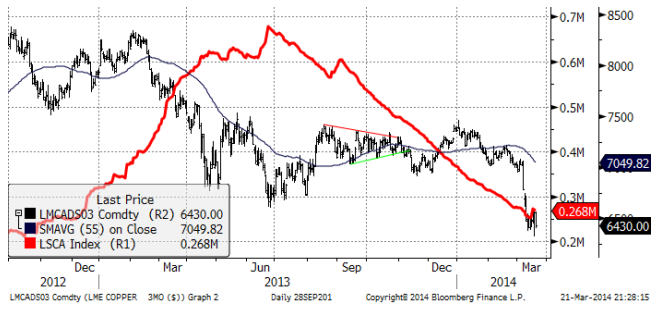
Vi fortsätter att rekommendera neutral position i koppar.
Aluminium
Aluminiumpriset sjönk i veckan från 1740 till 1712 och har inte drabbats lika hårt som t ex kopparmarknaden av de senaste negativa makroekonomiska signalerna. Det beror på att marknaden redan är tämligen pressad i botten. Däremot kan vi inte heller se någon anledning att idag köpa aluminium.
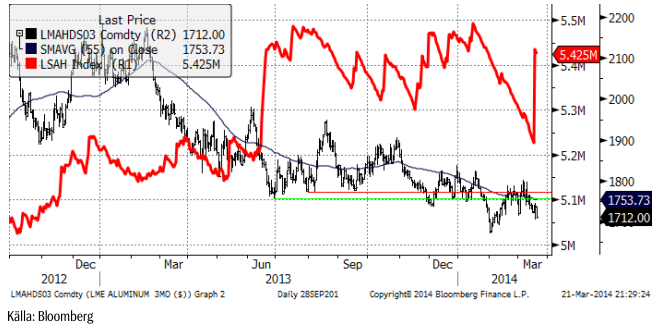
Vi fortsätter med neutral rekommendation på aluminium.
Zink
Zinkrpriset sjönk i veckan från 1980 till 1952 dollar per ton. Den tekniska stödnivån vid 1950 – 1970 dollar per ton verkar än så länge hålla. Så länge den gör det, kan man våga sig på att vara köpt zink, men om priset skulle bryta ner, under 1950 dollar, bör man snabbt ta en stopp-loss.
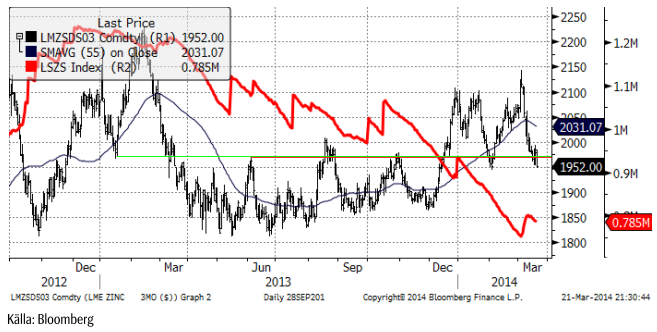
Vi rekommenderar köp av ZINK S eller BULL ZINK X4 S.
Nickel
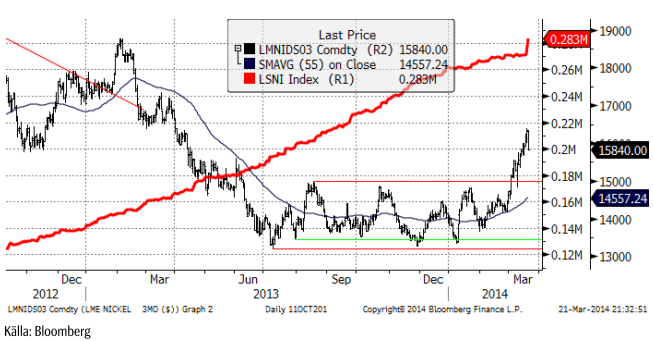
Nickel steg faktiskt med 100 dollar per ton från 15740 till 15840 i veckan som gick. Vi ser inflöden i våra NICKEL S och BULL NICKEL X4 S. Detsamma ser vi i intresset för att investera i nickel generellt. På global basis uppvisar vissa fysiskt backade börshandlade investeringsprodukter på nickel en fördubbling av antalet ton som investerare är köpta.
Med det sagt, ”borde” det komma en rekyl nedåt nu, eftersom priset har gått upp kraftigt och 16,500 dollar är ett tekniskt motstånd, där det funnits säljare, uppenbarligen.
Vi rekommenderar att man kortsiktigt tar hem vinster och försöker köpa igen till lägre pris. Långsiktigt är vi positiva till nickel och behåller den långsiktiga köprekommendationen på nickel.
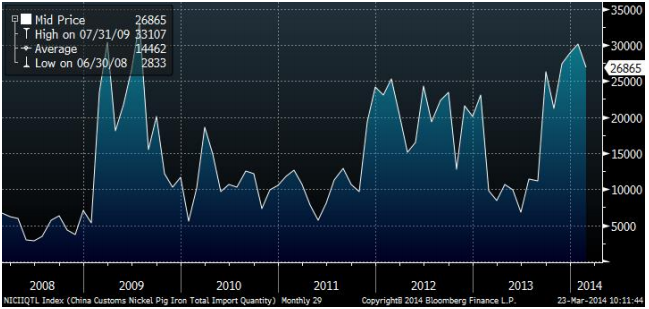
Indonesiens exportförbud av obearbetad nickelmalm har inneburit att Kinas import av Nickel Pig Iron (NPI) har skjutit i höjden. Vi ser en bild på kinas import nedan. 26,865 ton importerades alltså i januari, enligt statistik som publicerades i februari av den kinesiska tullen.
Guld
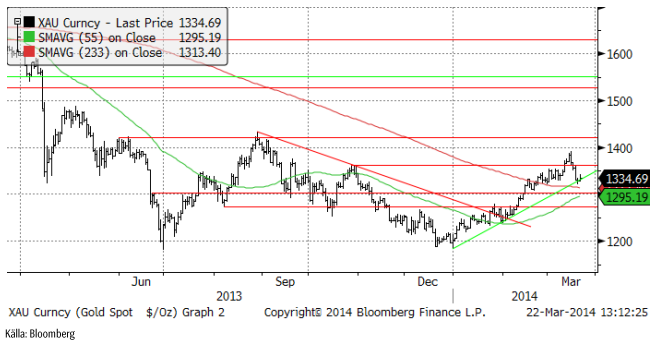
Guldpriset som föll kraftigt efter motstånd vid 1400 dollar, stängde upp i fredags. Priset föll tidigare i veckan efter att FED:s chef Janet Yellen i ett tal talat om prognosen för när räntorna ska börja höjas i USA. I fredags annekterade Ryssland Krim och EU gjorde en politisk överenskommelse om stöd till Ukraina. USA skärpte sanktionerna mot ryska politiker och affärsmän med koppling till Putin; i praktiken de personer som kontrollerar stora delar av ryskt näringsliv. Guldpriset reagerar positivt på geopolitisk oro. De enda länder som ställt sig på Rysslands sida och erkänt Krim, är Nordkorea och Syrien, världens främsta skurkstater. Det är rent objektivt sett ett passande sällskap för Ryssland. Ryssland har visat för alla att internationell lag inte gäller för dem. På sociala medier har Ryssland med råge återfått positionen som ”the Evil Empire”, som USA:s förre president Ronald Reagan kallade det. USA är dock mycket svagare än då, både politiskt, ekonomiskt och militärt eftersom det är upptaget på olika håll i världen i sitt krig mot terrorismen. Det är en ny verklighet och guldpriset anpassar sig till det när investerare ser över sina placeringar.
Med det sagt, 1400 dollar var ett för starkt motstånd – den här gången, men trendstödet för uppgången är inte bruten. Skulle priset på guld falla det lilla minsta i veckan som kommer, bryts dock detta, och vi får en rekyl, förmodligen ner mot 1300, kanske ända ner mot prisnivåerna från slutet av januari.
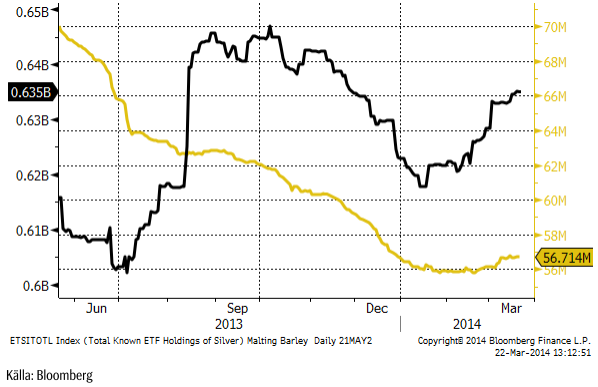
ETF-köpare har avvaktat den senaste veckan. Det har inte kommit in mer pengar i ETF:er som placerar i fysiskt guld. Däremot har ETF-er på silver attraherat köpare, förmodligen för att priset på silver har backat mer än priset på guld.
Vi fortsätter tills vidare med neutral vy på guld. Vi skulle vilja köpa om det kommer en rekyl.
Silver
Silverpriset föll under prisintervallet på 20.50 till 22. Marknaden har, som jag skrev förra veckan, ingen trend – än. Vänder priset upp från den här nivån och går över 22 dollar, har vi en stigande trend. Annars lutar det mest åt fortsatt trendlöshet.
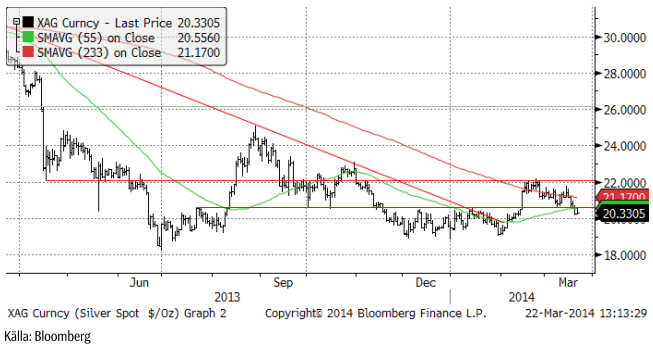
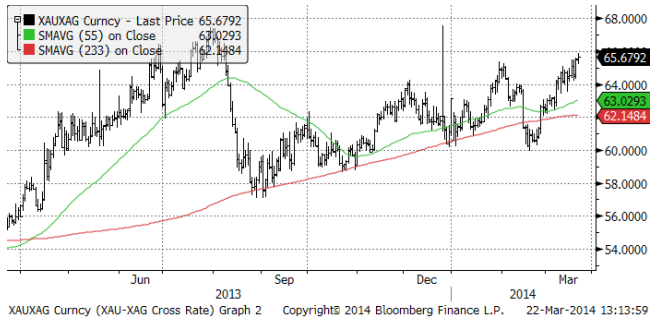
Som vi såg av ETF-innehaven i silver ovan, attraherar silver köpare som tycker att priset är lågt. Det är inte trend-investerare, utan värde-investerare. Nedan ser vi guldpriset angivet i silver (istället för dollar). Vi ser att guld är relativt dyrt i förhållande till silver, såväl i det korta perspektivet som i det långa. Vi föredrar därför att köpa silver, hellre än guld av den anledningen, men just nu ser vi inte någon omedelbar anledning att göra det. Palladium tror vi är en betydligt bättre placering.
Vi anser att silver är mer köpvärt än guld och skulle vilja köpa på de här nivåerna, i synnerhet efter den rekyl som inträffat de senaste veckorna.
Platina & Palladium
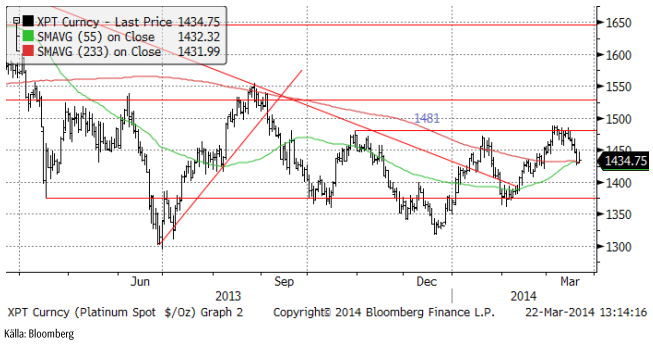
Som vi skrev förra veckan fanns en risk för en rekyl nedåt i priset på platina och vi valde att ha neutral position. Det har nåtts en viss överenskommelse mellan gruvfack och gruvbolag, men det gäller bara en liten del av arbetsstyrkan vid gruvorna, de som är bäst betalda. Detta betyder inte att konflikten är över. Det ska bli intressant att se om priset på platina vänder upp från den här nivån. I så fall ser skulle bilden av en marknad som håller på att skapa och inleda en stigande pristrend stärkas. Priset måste bryta motståndsnivån 1481 för att bekräfta detta.
Vi skrev förra veckan att rekylen nedåt efter utbrottet från triangelformationen är klassisk. Vi skrev att vi ville se en bekräftelse på utbrottet genom att priset skulle passera förra årets topp på 785 dollar. Det har vi nu. Priset stängde i fredags på 788 dollar. Vi har alltså med hög sannolikhet en rejäl ”bull market” i palladium framför oss.
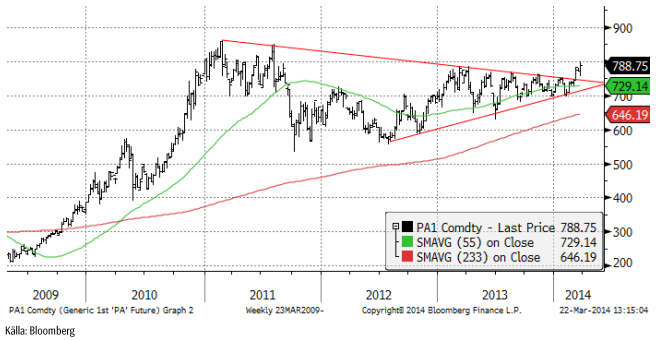
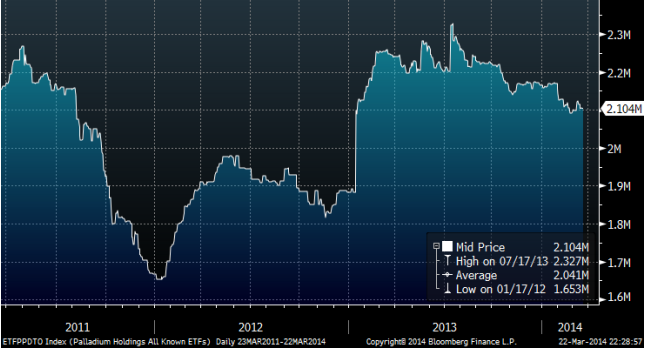
Efterfrågan på palladium väntas överstiga produktionen i år med mellan 780,000 och 1 miljon uns, enligt olika bedömare. Ryssland och Sydafrika står för 80% av global produktion enligt Johnsson Matthey i London. Det finns en oro för att de ekonomiska sanktionerna mot Ryssland efter kriget och invasionen av Ukraina ska påverka produktions- och exportmöjligheterna av palladium. Det är oroligt även i Sydafrika, där arbetsmarknadskonflikten vid landets gruvor ännu inte efter sex månaders konflikt har lösts.
Alla kända fysiskt backade ETF:er innehar för närvarande 2.1 miljoner uns palladium. I diagrammet nedan ser vi hur dessa innehav har förändrat sig de senaste två åren. Det har alltså varit utflöden på 200,000 uns sedan sommaren förra året.
Absa Bank, en del av Barclays, kommer att notera en ny fysiskt backad ETF i Johannesburg den 27 mars. Den ska enbart investera i palladium från Sydafrika, vilket drar undan material från det ena av de två länder som står för 80% av global produktion. Om ETF-marknaden attraherar mer investerare dras ytterligare material undan, vilket skapar ett ännu större underskott i år. Hittills har ETF:erna verkat stabiliserande på priset, men en stadig hausse kan locka till sig köpare av en ny kategori.
Vi rekommenderar alltså en neutral position i platina och en köpt position i palladium.
Kaffe
Torkan i Brasilien är av allt att döma slut. Det har regnat i veckan som gått. Prognosen från GFS-modellen för de kommande två veckorna visar onormalt mycket nederbörd över Minas Gerais. Det har regnat ordentligt och detta borde hindra ytterligare skador och reparera de som blivit; dock inte på årets skörd. Skadorna på bönorna är permanenta.
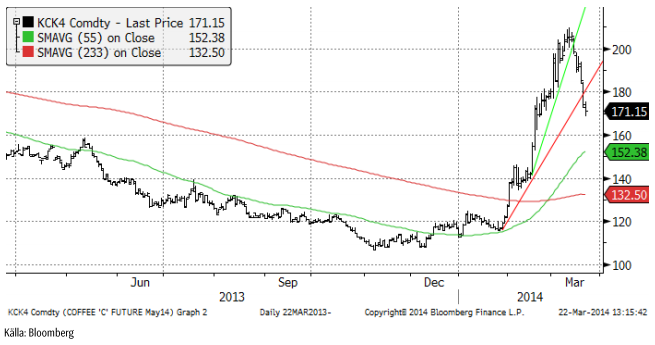
Det har varit torrt även i Vietnam, som är världens ledande producent av robusta. The Vietnam Coffee and Cocoa Association, Vicofa, sade att skörden, som börjar i oktober, väntas bli lägre än förra årets. Det är vanligtvis torrt så här års och normalt sett inget som skadar odlingen, men det har varit lite torrare än normalt. Nu väntas det även komma regn till Vietnams kaffedistrikt, som ligger uppe i bergen mot Laos. Lantbrukarna har hållit tillbaka försäljningen av vinterns skörd i avvaktan på hur det skulle gå i Brasilien. Lagren per den 7 mars var rekordhöga.
Vi rekommenderar neutral position i kaffe, eller möjligtvis en mycket kortsiktig kort position.
Kakao
Priset på kakao i New York backade i veckan från 2997 dollar per ton till 2957 dollar.
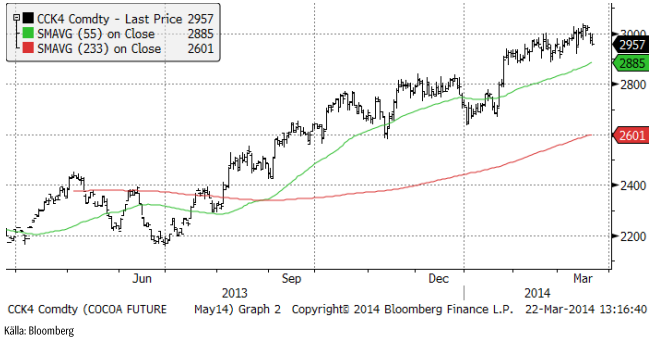
Kakaoterminsmarknaden präglas av en stor kort position i producentledet. Enligt fredagens Commitment of Traders – rapport från CFTC, som visar läget per i tisdags, har investerare minskat sin köpta position från 80,598 kontrakt förra veckan till 67,690 kontrakt den här veckan. Investerarnas sentiment fortsätter alltså att bli mindre positivt.
Kakaoterminerna på LIFFE i London handlas normalt sett högre än terminerna på NYBOT i New York. I diagrammet nedan har vi kvoten mellan London-kakao och New York-kakao, omräknat till brittiska pund per ton. Det är spotkontraktet vi ser.
Vi rekommenderar en neutral position vid dagens situation.
[box]SEB Veckobrev Veckans råvarukommentar är producerat av SEB Merchant Banking och publiceras i samarbete och med tillstånd på Råvarumarknaden.se[/box]
Disclaimer
The information in this document has been compiled by SEB Merchant Banking, a division within Skandinaviska Enskilda Banken AB (publ) (“SEB”).
Opinions contained in this report represent the bank’s present opinion only and are subject to change without notice. All information contained in this report has been compiled in good faith from sources believed to be reliable. However, no representation or warranty, expressed or implied, is made with respect to the completeness or accuracy of its contents and the information is not to be relied upon as authoritative. Anyone considering taking actions based upon the content of this document is urged to base his or her investment decisions upon such investigations as he or she deems necessary. This document is being provided as information only, and no specific actions are being solicited as a result of it; to the extent permitted by law, no liability whatsoever is accepted for any direct or consequential loss arising from use of this document or its contents.
About SEB
SEB is a public company incorporated in Stockholm, Sweden, with limited liability. It is a participant at major Nordic and other European Regulated Markets and Multilateral Trading Facilities (as well as some non-European equivalent markets) for trading in financial instruments, such as markets operated by NASDAQ OMX, NYSE Euronext, London Stock Exchange, Deutsche Börse, Swiss Exchanges, Turquoise and Chi-X. SEB is authorized and regulated by Finansinspektionen in Sweden; it is authorized and subject to limited regulation by the Financial Services Authority for the conduct of designated investment business in the UK, and is subject to the provisions of relevant regulators in all other jurisdictions where SEB conducts operations. SEB Merchant Banking. All rights reserved.

Market is starting to take US/Iran headlines with a pinch of salt. Brent crude rose $2.8/b yesterday to an official close of $112.1/b. But after that it traded as low as $108.05/b before ending late night at around $109.7/b. Through the day it traded in a range of $106.87 – 112.72/b amid a flurry of news or rumors from Iran and the US. ”US temporary sanctions during negotiations” (falls alarm). ”We will bomb Iran” (not anyhow),… etc. While the market is still fluctuating to this kind of news flow, it is starting to take such headlines with a pinch of salt.

We’ll see. Maybe, maybe not. The Brent M1 contract is trading at $110.2/b this morning which very close to the average ticks through yesterday of $110.4/b.
Trump with bearish, verbal intervention whenever Brent trades above $110/b it seems. What seems to be a pattern is that Trump states something like ”very good negotiations going on with Iran”, ”New leaders in Iran are great,..”, ”Great progress in negotiations,…”, ”Deal in sight,..” etc whenever the Brent M1 contract trades above $110/b. An effort to cool the market. These hot air verbal interventions from Trump used to have a heavy bearish impact on prices, but they now seems to have less and less effect unless they are backed by reality.
As far as we can see there has been no real progress in the negotiations between the US and Iran with both sides still standing by their previous demands.
Iran is getting stronger while the cease fire lasts making a return to war for Trump yet harder. Iran is naturally in constant preparation for a return to war given Trump’s steady threats of bombing Iran again. Iran is naturally doing what ever is possible to prepare for a return to war. And every day the cease fire lasts it is better prepared. This naturally makes it more and more difficult and dangerous for the US to return to warring activity versus Iran as the consequences for energy infrastructure in the Persian Gulf will be more and more severe the longer the cease fire lasts. Israel seems to see it this way as well. That the war is not won and that current frozen state of a cease fire gives Iran opportunity to rebuild military and politically.
Global inventories are drawing down day by day. How much? In the meantime the Strait of Hormuz stays closed. There is varying measures and estimates of how much global inventories are drawing down. Our rough estimate, back of the envelope, is that global inventories are drawing down by at least some 10 mb/d or about 300 mb/d in a balance between loss of supply versus demand destruction. Other estimates we see are a monthly draw of 250-270 mb/d. The IEA only ’measured’ a draw in global observable stocks of 117 mb in April with oil on water rising 53 mb while on shore stocks fell 170 mb. But global stocks are hard to measure with large invisible, unmeasured stocks. As such a back of the envelope approach may be better.
Oil products is what the world is consuming. Oil product prices likely to rise while product stocks fall. Strategic Petroleum Reserves (SPR) are predominantly crude oil. Discharging oil from OECD SPR stocks, a sharp reduction in Chinese crude imports and a reduction in global refinery throughput of 6-7 mb/d has helped to keep crude oil markets satisfactorily supplied. But global inventories are drawing down none the less. And oil products is really what the world is consuming. So if global refinery throughput stays subdued, then demand will eventually have to match the supply of oil products. The likely path forward this summer is a steady draw down in jet fuel, diesel and gasoline. Higher prices for these. Then, if possible, higher refinery throughput and higher usage of crude in response to very profitable refinery margins. And lastly sharper draw in crude stocks and higher prices for these. But some 6 mb/d of oil products used to be exported through the Strait of Hormuz. And it may not be so easy to ramp up refinery activity across the world to compensate. Especially as Ukraine continues to damage Russian refineries as well as Russian crude production and export facilities.
Watch oil product stocks and prices as well as Brent calendar 2027. What to watch for this summer is thus oil product inventories falling and oil product premiums to crude rising. Another measure to watch is the Brent crude 2027 contract as it rises steadily day by day as the Strait of Hormuz stays closed and global oil inventories decline. The latter is close to the highest level since the start of the war and keeps rising.
The Brent M1 contract and the Brent 2027 prices and current price of jet fuel in Europe (ARA). All in USD/b

Our back of the envelope calculation of the global shortage created by the closure of the Strait of Hormuz. Note that 3.5 mb/d of discharge from SPR is also a draw. Note also that ’Forced demand loss’ of 2.5 mb/d is probably temporary and will fall back towards zero as logistics are sorted out leaving ’Price demand loss’ to do the job of balancing the market. Thus a shortfall of at least 9 mb/d created by the closure. More if SPR discharge is included and more if Forced demand loss recedes.

Brent is climbing higher. Front-month is at USD 106.3/bl this morning, close to a weekly high and a USD 9/bl jump from Mondays open. This is the move we flagged as a risk earlier in the week: the market shifting from ”a deal is around the corner” to ”this is going to take longer than we thought”.

Analyst Commodities, SEB
During April, rest-of-year Brent remained remarkably stable around USD 90/bl. A stability which rested on one single assumption: the SoH reopens around 1 May. That assumption is now slowly falling apart.
As we highlighted yesterday: every week of delay beyond 1 May adds (theoretically) ish USD 5/bl to the rest-of-year average, as global inventories draw 100 million barrels per week. i.e., a mid-May reopening implies rest-of-year Brent closer to USD 100/bl, and anything pushing into June or July takes us meaningfully higher.
What’s changed in the last 48 hours:
#1: The US military has formally warned that clearing suspected sea mines from SoH could take up to six months. That is a completely different timescale from what the financial market is pricing. Even a political deal tomorrow does not immediately reopen the strait.
#2: Trump has shifted his tone from urgency to ”strategic patience”. In yesterday’s press conference: ”Don’t rush me… I want a great deal.” The market is reading this as a president no longer feeling pressured by timelines, with the naval blockade running in the background.
#3: So far, the military activity is escalating, not de-escalating. Axios reports Iran is laying more mines in SoH. The US 3rd carrier strike group (USS George H.W. Bush) is arriving with two countermine vessels. Trump yesterday ordered the US Navy to destroy any Iranian boats caught laying mines. While CNN reports that the Pentagon is actively drawing up plans to strike Iranian SoH capabilities and individual Iranian military leaders if the ceasefire collapses. i.e., NOT a attitude consistent with an imminent deal!
Spot crude and product prices eased off the early-April highs on a combination of system rerouting and deal optimism. Both now weakening. Goldman estimates April Gulf output is reduced by 14.5 mbl/d, or 57% of pre-war supply, a number that keeps getting worse the longer this drags on.
Demand-side adaptation is ongoing: S. Korea has cut its Middle East crude dependence from 69% to 56% by pulling more from the Americas and Africa, and Japan is kicking off a second round of SPR releases from 1 May. But SPRs are finite.
Ref. to the negotiations, we should not bet on speed. The current Iranian leadership is dominated by genuine hardliners willing to absorb economic pain and run the clock to extract concessions. That is not a setup for a rapid resolution. US/Israeli media briefings keep framing the delay as ”internal Iranian divisions”, the reality is more complicated and points toward weeks and months, not days.
Our point is that the complexity is large, and higher prices have only just started (given a scenario where the negotiations drag out in time). The market spent April leaning on the USD 90/bl rest-of-year assumption; that case is diminishing by the hour. If ”early May reopening” is replaced by ”June, July or later” over the next week or two, both crude and products have meaningful room to reprice higher from here. There is a high risk being short energy and betting on any immediate political resolution(!).
Down on Friday. Up on Monday. The Brent June crude oil contract traded down 5.1% last week to a close of $90.38/b. It reached a high of $103.87/b last Monday and a low of $86.09/b on Friday as Iran announced that the Strait of Hormuz was fully open for transit. That quickly changed over the weekend as the US upheld its blockade of Iranian oil exports while Iran naturally responded by closing the SoH again. The US blew a hole in the engine room of the Iranian ship TOUSKA and took custody of the ship on Sunday. Brent crude is up 5.6% this morning to $95.4/b.
The cease-fire is expiring tomorrow. The US has said it will send a delegation for a second round of negotiations in Islamabad in Pakistan. But Iran has for now rejected a second round of talks as it views US demands as unrealistic and excessive while the US is also blocking the Strait of Hormuz.
While Brent is up 5% this morning, the financial market is still very optimistic that progress will be made. That talks will continue and that the SoH will fully open by the start of May which is consistent with a rest-of-year average Brent crude oil price of around $90/b with the market now trading that balance at around $88/b.
Financial optimism vs. physical deterioration. We have a divergence where the financial market is trading negotiations, improvements and resolution while at the same time the physical market is deteriorating day by day. Physical oil flows remain constrained by disrupted flows, longer voyage times and elevated freight and insurance costs.
Financial markets are betting that a US/Iranian resolution will save us in time from violent shortages down the road. But every day that the SoH remains closed is bringing us closer to a potentially very painful point of shortages and much higher prices.
The US blockade is also a weapon of leverage against its European and Asian allies. When Iran closed the SoH it held the world economy as a hostage against the US. The US blockade of the SoH is of course blocking Iranian oil exports. But it is also an action of disruption directed towards Europe and Asia. The US has called for the rest of the world to engaged in the war with Iran: ”If you want oil from the Persian Gulf, then go and get it”. A risk is that the US plays brinkmanship with the global oil market directed towards its European and Asian allies and maybe even towards China to force them to engage and take part. Maybe unthinkable. But unthinkable has become the norm with Trump in the White House.


Sommarväder skapar prisrally på elbörsen
Oil product price pain is set to rise as the Strait of Hormuz stays closed into summer

Solkraften pressar elpriserna dagtid

Michel Gubel ger sin syn på oljemarknaden