

Analys
SEB – Råvarukommentarer, 24 mars 2014

Rekommendationer
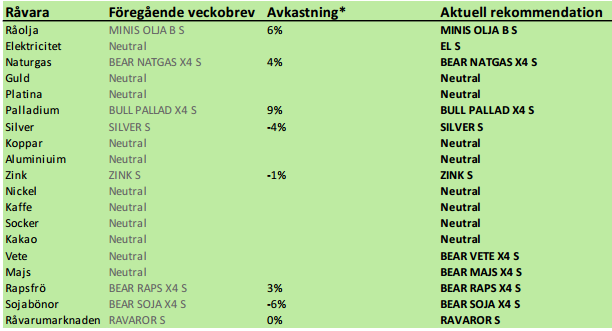
Kort sammanfattning
Palladium är den råvara vi är mest positiva till. Elpriset i Norden ser äntligen ut att ha bottnat ut och vi går över till en köprekommendation av EL S. Priset på råolja har brutit sitt tekniska stöd och kan stå inför en större trendförändring nedåt i pris.
Jordbruksprodukterna har fallhöjd och vi tror att risken är stor för fallande priser i det korta perspektivet på i princip allt. Torkan är slut i Brasilien, vilket sätter press på det upphaussade priset på kaffe och socker, men även på sojabönor och majs.
På måndagen den 31 mars publicerar USDA sin årliga ”Prospective Plantings” rapport för USA:s sådd av majs och sojabönor. Vi kommer att hålla seminerier för att gå igenom vad siffrorna säger om marknadsutvecklingen. Dessa äger rum i Malmö på tisdag nästa veckan, i Lidköping och Vadstena på onsdagen och i Stockholm på torsdagen. Inbjudna gästtalare kommer att belysa olika aspekter. I Stockholm kommer situationen i Ukrainas jordbruk att belysas av en extern expert som bedrivit storjordbruk i Ukraina.
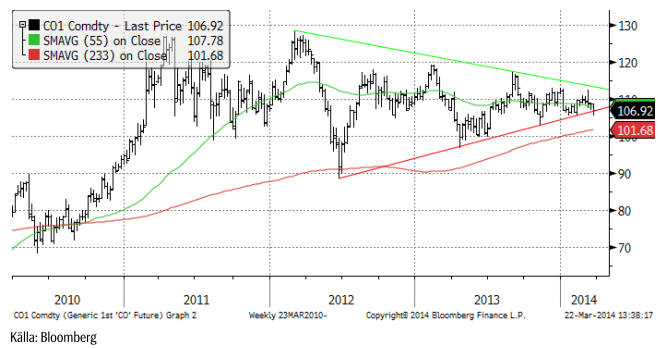
Råolja – Brent
Oljepriset sjönk under lugn handel i veckan från 109 till 108.57 dollar per fat. Vi tror att det är lugnet före stormen, när oljepriset bryter stödet i den stora triangelformation som marknaden handlar inom.
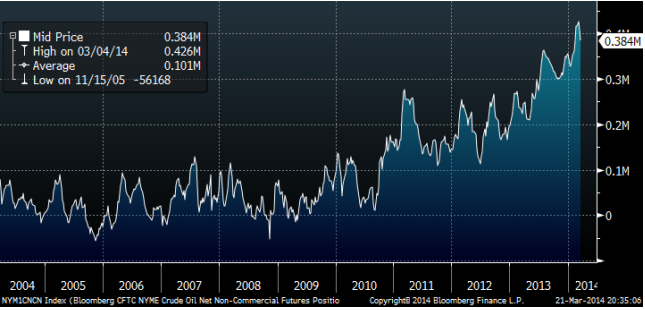
Non-commercials (investerare) minskade sin långa position i terminskontrakt på West Texas Intermediate råolja från 407 miljoner fat till 384 miljoner fat, enligt fredagens CFTC-rapport.
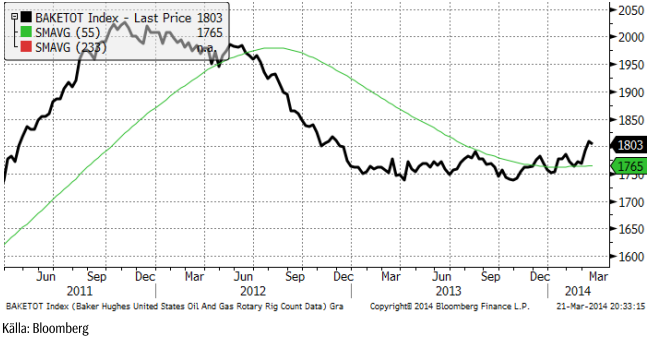
Antalet borr-riggar i USA, statistik som Baker Hughes publicerar klockan 18 CET varje fredag, visar en lite nedgång från förra veckan, till 1803. Trenden till fler borr-riggar är dock tydlig, om än i ett tidigt skede.
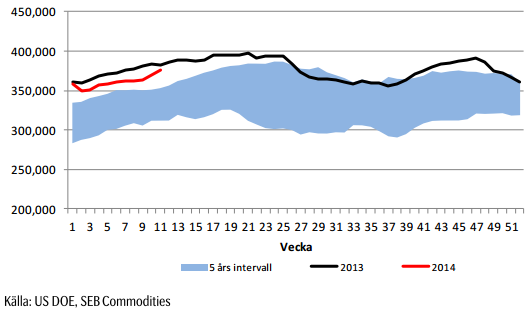
Råoljelagren steg återigen kraftigt i veckans rapport från US Department of Energy. Vi har tidigare sagt att marknaden kommer att komma under press under det andra kvartalet, förmodligen med en ny lägstanotering på olja under april månad, lägre än förra årets botten på 97 dollar. Raffinaderierna i USA ställer om från eldningsolja / diesel till bensin nu och då efterfrågar de mindre olja, med lageruppbyggnad som konsekvens. Som vi ser ökar lageruppbyggnaden mycket snabbare nu än tidigare år, därför att utbudet är mycket större än tidigare år.
Vi rekommenderar en kort position i olja, t ex med MINIS OLJA B S eller MINIS OLJA A S.
Elektricitet
Väderleksprognosen har slagit om från blött och varmt och det innebär att den hydrologiska balansen försvagas med 1.5 TWh till +2.5 – 3 TWh enligt PointCarbon. Marknaden har legat kort och blankarna fick bråttom att köpa tillbaka kontrakt och stänga positioner, vilket gav skjuts uppåt på priset. Som vi har skrivit tidigare kan en vändning uppåt bli våldsam, när den kommer. Vi tror att vi kan ha sett botten vid 24.15 euro per MWh, strax över den jämna nivån 24 euro. Efter en så lång nedgång brukar dock aldrig priserna vända spikrakt uppåt, men vad vi tror att det kan bli oroligt och volatilt den närmaste tiden.
Priset är så lågt ändå, att vi går över från neutral rekommendation till rekommendation att köpa EL S. Det är lite för volatilt för att rekommendera BULL-certifikat.
En risk för framtiden är den massiva utbyggnaden av framförallt solkraft i Tyskland, som en solig dag kan generera kraft motsvarande ca 35 kärnreaktorer (35 GigaWatt), alltså ca 3.5 gånger den svenska kärnkraften. Denna el erbjuds marknaden till noll euro, eftersom det är den rörliga kostnaden.
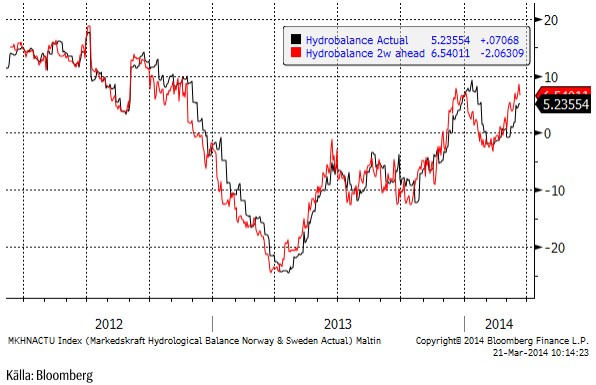
Markedskrafts 2 veckors prognos för hydrologisk balans har till fredagens morgon sjunkit från 8.6 till 6.5 TWh, som vi ser i diagrammet nedan.
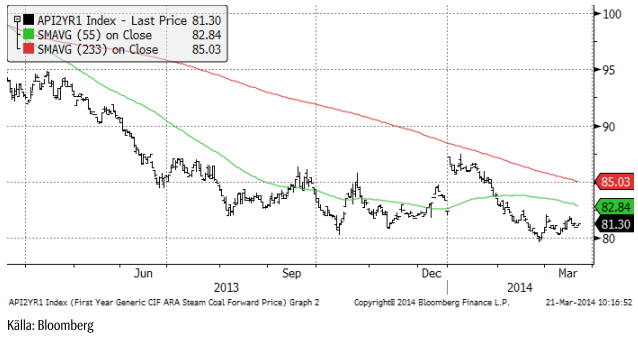
Priset på kol har stabiliserat sig.
Vi går alltså över till köprekommendation från neutral och rekommenderar EL S.
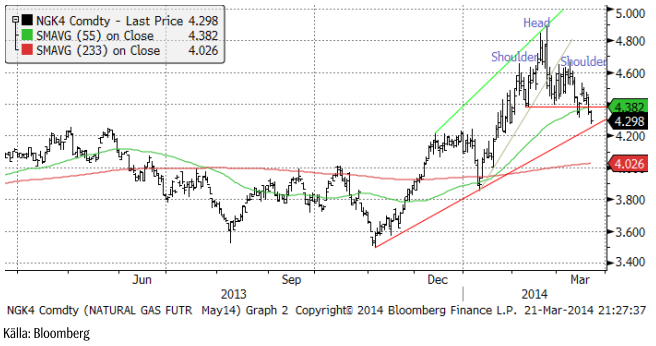
Naturgas
Förra veckan rekommenderade vi köp av BEAR NATGAS X4 S mot bakgrund av att priset stigit en längre tid på det kalla vädret i USA och att varmt väder nu ”borde” komma in i prognosfönstret. Samtidigt såg vi att antalet borr-riggar återigen ökar tydligt och de flesta av dem producerar gas. Japan drar igång sina kärnkraftverk nu och slutar därmed att importera LNG. Det har talats om, bland annat i en annons i New York Times i fredags som en privatperson (!) satt in med anledning av krisen i Ukraina, att EU skulle importera LNG från USA. Om det sker, som en del i det ”paket” som EU och USA ställer upp mot Ryssland efter söndagens ”val” i södra Ukraina, kan det verka stödjande på priset, men annars bör priset i första hand falla ner mot 4.30 – 4.20 dollar per MMBtu. Vi fortsätter med säljrekommendation och behåller BEAR NATGAS X4 S.
Koppar
Kopparpriset stängde ner 34 dollar på veckan till 6430 dollar. Marknaden har handlat ner kopparpriset efter oro för att tillväxten dämpas när USA:s centralbank börjar höja räntan igen. FED publicerade en prognos i veckan som gick att räntan kommer att vara 1% mot slutet av nästa år och 2.25% om två år. Tekniskt motstånd finns nu på 6750 dollar. Ur ett tekniskt perspektiv är det, trots fyndköpsrekommendationerna som förekommer i emailade snabbkommenterar från olika banker, större risk för fortsatt nedgång i det korta perspektivet, än att priserna återgår till 7000 dollar.
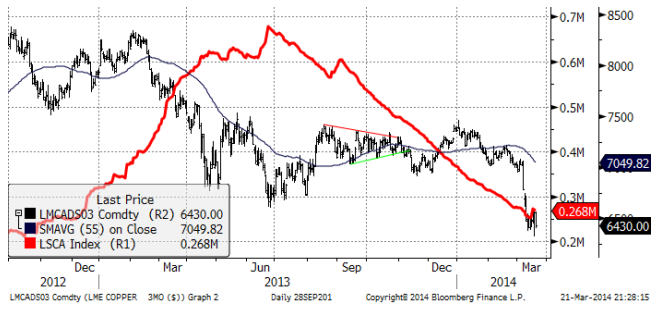
Vi fortsätter att rekommendera neutral position i koppar.
Aluminium
Aluminiumpriset sjönk i veckan från 1740 till 1712 och har inte drabbats lika hårt som t ex kopparmarknaden av de senaste negativa makroekonomiska signalerna. Det beror på att marknaden redan är tämligen pressad i botten. Däremot kan vi inte heller se någon anledning att idag köpa aluminium.
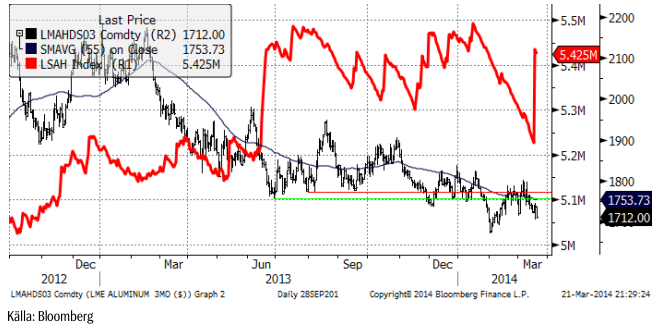
Vi fortsätter med neutral rekommendation på aluminium.
Zink
Zinkrpriset sjönk i veckan från 1980 till 1952 dollar per ton. Den tekniska stödnivån vid 1950 – 1970 dollar per ton verkar än så länge hålla. Så länge den gör det, kan man våga sig på att vara köpt zink, men om priset skulle bryta ner, under 1950 dollar, bör man snabbt ta en stopp-loss.
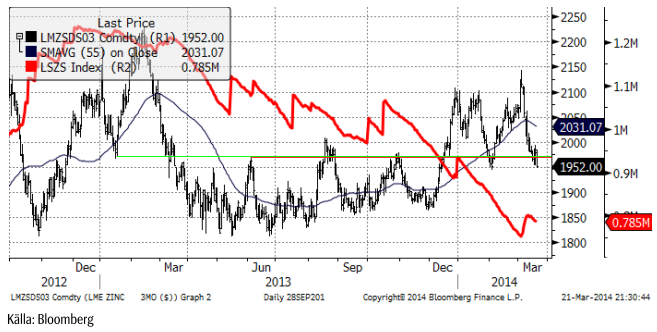
Vi rekommenderar köp av ZINK S eller BULL ZINK X4 S.
Nickel
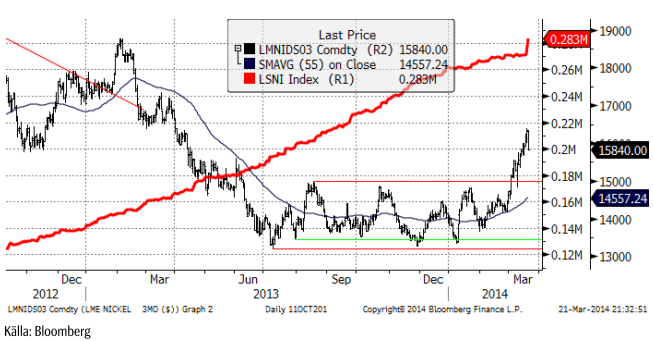
Nickel steg faktiskt med 100 dollar per ton från 15740 till 15840 i veckan som gick. Vi ser inflöden i våra NICKEL S och BULL NICKEL X4 S. Detsamma ser vi i intresset för att investera i nickel generellt. På global basis uppvisar vissa fysiskt backade börshandlade investeringsprodukter på nickel en fördubbling av antalet ton som investerare är köpta.
Med det sagt, ”borde” det komma en rekyl nedåt nu, eftersom priset har gått upp kraftigt och 16,500 dollar är ett tekniskt motstånd, där det funnits säljare, uppenbarligen.
Vi rekommenderar att man kortsiktigt tar hem vinster och försöker köpa igen till lägre pris. Långsiktigt är vi positiva till nickel och behåller den långsiktiga köprekommendationen på nickel.
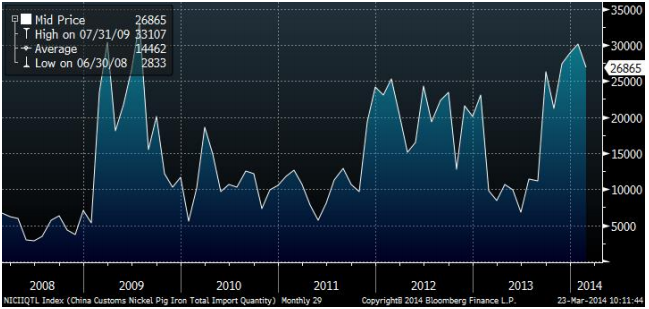
Indonesiens exportförbud av obearbetad nickelmalm har inneburit att Kinas import av Nickel Pig Iron (NPI) har skjutit i höjden. Vi ser en bild på kinas import nedan. 26,865 ton importerades alltså i januari, enligt statistik som publicerades i februari av den kinesiska tullen.
Guld
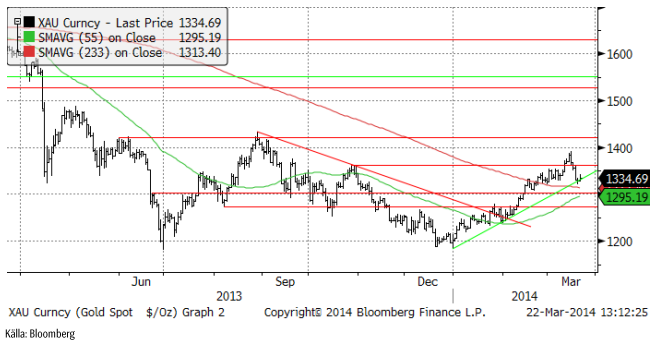
Guldpriset som föll kraftigt efter motstånd vid 1400 dollar, stängde upp i fredags. Priset föll tidigare i veckan efter att FED:s chef Janet Yellen i ett tal talat om prognosen för när räntorna ska börja höjas i USA. I fredags annekterade Ryssland Krim och EU gjorde en politisk överenskommelse om stöd till Ukraina. USA skärpte sanktionerna mot ryska politiker och affärsmän med koppling till Putin; i praktiken de personer som kontrollerar stora delar av ryskt näringsliv. Guldpriset reagerar positivt på geopolitisk oro. De enda länder som ställt sig på Rysslands sida och erkänt Krim, är Nordkorea och Syrien, världens främsta skurkstater. Det är rent objektivt sett ett passande sällskap för Ryssland. Ryssland har visat för alla att internationell lag inte gäller för dem. På sociala medier har Ryssland med råge återfått positionen som ”the Evil Empire”, som USA:s förre president Ronald Reagan kallade det. USA är dock mycket svagare än då, både politiskt, ekonomiskt och militärt eftersom det är upptaget på olika håll i världen i sitt krig mot terrorismen. Det är en ny verklighet och guldpriset anpassar sig till det när investerare ser över sina placeringar.
Med det sagt, 1400 dollar var ett för starkt motstånd – den här gången, men trendstödet för uppgången är inte bruten. Skulle priset på guld falla det lilla minsta i veckan som kommer, bryts dock detta, och vi får en rekyl, förmodligen ner mot 1300, kanske ända ner mot prisnivåerna från slutet av januari.
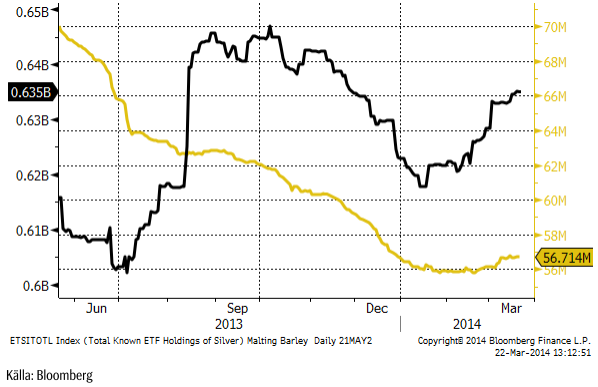
ETF-köpare har avvaktat den senaste veckan. Det har inte kommit in mer pengar i ETF:er som placerar i fysiskt guld. Däremot har ETF-er på silver attraherat köpare, förmodligen för att priset på silver har backat mer än priset på guld.
Vi fortsätter tills vidare med neutral vy på guld. Vi skulle vilja köpa om det kommer en rekyl.
Silver
Silverpriset föll under prisintervallet på 20.50 till 22. Marknaden har, som jag skrev förra veckan, ingen trend – än. Vänder priset upp från den här nivån och går över 22 dollar, har vi en stigande trend. Annars lutar det mest åt fortsatt trendlöshet.
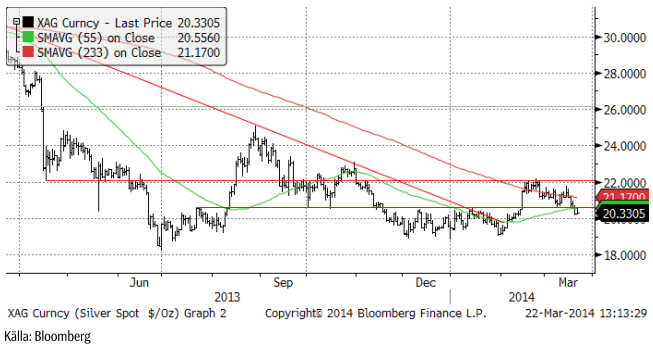
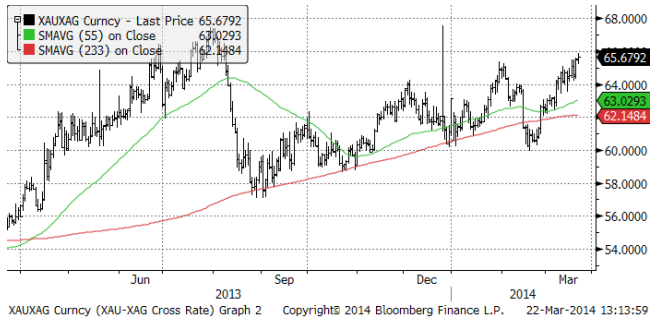
Som vi såg av ETF-innehaven i silver ovan, attraherar silver köpare som tycker att priset är lågt. Det är inte trend-investerare, utan värde-investerare. Nedan ser vi guldpriset angivet i silver (istället för dollar). Vi ser att guld är relativt dyrt i förhållande till silver, såväl i det korta perspektivet som i det långa. Vi föredrar därför att köpa silver, hellre än guld av den anledningen, men just nu ser vi inte någon omedelbar anledning att göra det. Palladium tror vi är en betydligt bättre placering.
Vi anser att silver är mer köpvärt än guld och skulle vilja köpa på de här nivåerna, i synnerhet efter den rekyl som inträffat de senaste veckorna.
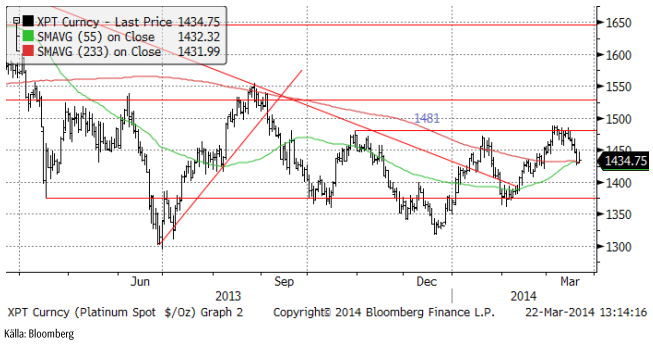
Platina & Palladium
Som vi skrev förra veckan fanns en risk för en rekyl nedåt i priset på platina och vi valde att ha neutral position. Det har nåtts en viss överenskommelse mellan gruvfack och gruvbolag, men det gäller bara en liten del av arbetsstyrkan vid gruvorna, de som är bäst betalda. Detta betyder inte att konflikten är över. Det ska bli intressant att se om priset på platina vänder upp från den här nivån. I så fall ser skulle bilden av en marknad som håller på att skapa och inleda en stigande pristrend stärkas. Priset måste bryta motståndsnivån 1481 för att bekräfta detta.
Vi skrev förra veckan att rekylen nedåt efter utbrottet från triangelformationen är klassisk. Vi skrev att vi ville se en bekräftelse på utbrottet genom att priset skulle passera förra årets topp på 785 dollar. Det har vi nu. Priset stängde i fredags på 788 dollar. Vi har alltså med hög sannolikhet en rejäl ”bull market” i palladium framför oss.
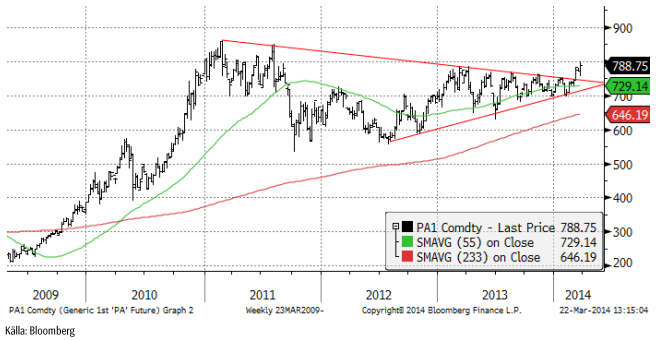
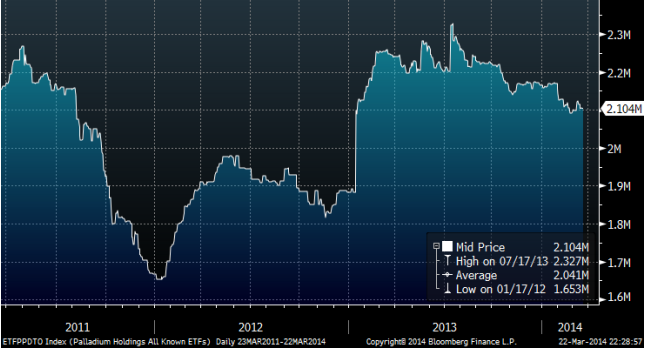
Efterfrågan på palladium väntas överstiga produktionen i år med mellan 780,000 och 1 miljon uns, enligt olika bedömare. Ryssland och Sydafrika står för 80% av global produktion enligt Johnsson Matthey i London. Det finns en oro för att de ekonomiska sanktionerna mot Ryssland efter kriget och invasionen av Ukraina ska påverka produktions- och exportmöjligheterna av palladium. Det är oroligt även i Sydafrika, där arbetsmarknadskonflikten vid landets gruvor ännu inte efter sex månaders konflikt har lösts.
Alla kända fysiskt backade ETF:er innehar för närvarande 2.1 miljoner uns palladium. I diagrammet nedan ser vi hur dessa innehav har förändrat sig de senaste två åren. Det har alltså varit utflöden på 200,000 uns sedan sommaren förra året.
Absa Bank, en del av Barclays, kommer att notera en ny fysiskt backad ETF i Johannesburg den 27 mars. Den ska enbart investera i palladium från Sydafrika, vilket drar undan material från det ena av de två länder som står för 80% av global produktion. Om ETF-marknaden attraherar mer investerare dras ytterligare material undan, vilket skapar ett ännu större underskott i år. Hittills har ETF:erna verkat stabiliserande på priset, men en stadig hausse kan locka till sig köpare av en ny kategori.
Vi rekommenderar alltså en neutral position i platina och en köpt position i palladium.
Kaffe
Torkan i Brasilien är av allt att döma slut. Det har regnat i veckan som gått. Prognosen från GFS-modellen för de kommande två veckorna visar onormalt mycket nederbörd över Minas Gerais. Det har regnat ordentligt och detta borde hindra ytterligare skador och reparera de som blivit; dock inte på årets skörd. Skadorna på bönorna är permanenta.
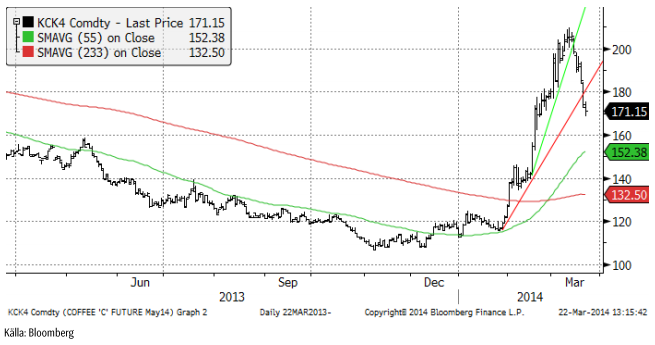
Det har varit torrt även i Vietnam, som är världens ledande producent av robusta. The Vietnam Coffee and Cocoa Association, Vicofa, sade att skörden, som börjar i oktober, väntas bli lägre än förra årets. Det är vanligtvis torrt så här års och normalt sett inget som skadar odlingen, men det har varit lite torrare än normalt. Nu väntas det även komma regn till Vietnams kaffedistrikt, som ligger uppe i bergen mot Laos. Lantbrukarna har hållit tillbaka försäljningen av vinterns skörd i avvaktan på hur det skulle gå i Brasilien. Lagren per den 7 mars var rekordhöga.
Vi rekommenderar neutral position i kaffe, eller möjligtvis en mycket kortsiktig kort position.
Kakao
Priset på kakao i New York backade i veckan från 2997 dollar per ton till 2957 dollar.
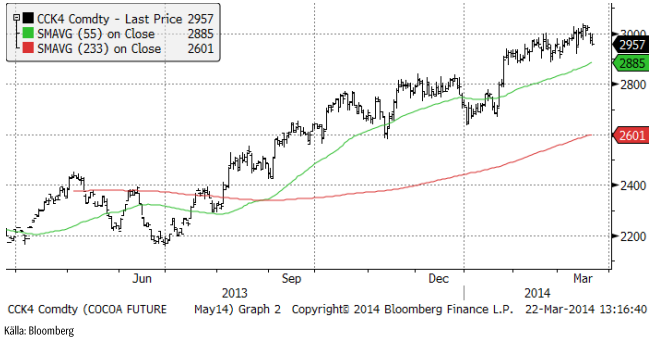
Kakaoterminsmarknaden präglas av en stor kort position i producentledet. Enligt fredagens Commitment of Traders – rapport från CFTC, som visar läget per i tisdags, har investerare minskat sin köpta position från 80,598 kontrakt förra veckan till 67,690 kontrakt den här veckan. Investerarnas sentiment fortsätter alltså att bli mindre positivt.
Kakaoterminerna på LIFFE i London handlas normalt sett högre än terminerna på NYBOT i New York. I diagrammet nedan har vi kvoten mellan London-kakao och New York-kakao, omräknat till brittiska pund per ton. Det är spotkontraktet vi ser.
Vi rekommenderar en neutral position vid dagens situation.
[box]SEB Veckobrev Veckans råvarukommentar är producerat av SEB Merchant Banking och publiceras i samarbete och med tillstånd på Råvarumarknaden.se[/box]
Disclaimer
The information in this document has been compiled by SEB Merchant Banking, a division within Skandinaviska Enskilda Banken AB (publ) (“SEB”).
Opinions contained in this report represent the bank’s present opinion only and are subject to change without notice. All information contained in this report has been compiled in good faith from sources believed to be reliable. However, no representation or warranty, expressed or implied, is made with respect to the completeness or accuracy of its contents and the information is not to be relied upon as authoritative. Anyone considering taking actions based upon the content of this document is urged to base his or her investment decisions upon such investigations as he or she deems necessary. This document is being provided as information only, and no specific actions are being solicited as a result of it; to the extent permitted by law, no liability whatsoever is accepted for any direct or consequential loss arising from use of this document or its contents.
About SEB
SEB is a public company incorporated in Stockholm, Sweden, with limited liability. It is a participant at major Nordic and other European Regulated Markets and Multilateral Trading Facilities (as well as some non-European equivalent markets) for trading in financial instruments, such as markets operated by NASDAQ OMX, NYSE Euronext, London Stock Exchange, Deutsche Börse, Swiss Exchanges, Turquoise and Chi-X. SEB is authorized and regulated by Finansinspektionen in Sweden; it is authorized and subject to limited regulation by the Financial Services Authority for the conduct of designated investment business in the UK, and is subject to the provisions of relevant regulators in all other jurisdictions where SEB conducts operations. SEB Merchant Banking. All rights reserved.

Brent crude has climbed roughly USD 1.5-2 per barrel since Friday, yet falling USD 0.3 per barrel this mornig and currently trading near USD 67.25/bbl after yesterday’s climb. While the rally reflects short-term geopolitical tension, price action has been choppy, and crude remains locked in a broader range – caught between supply-side pressure and spot resilience.

Prices have been supported by renewed Ukrainian drone strikes targeting Russian infrastructure. Over the weekend, falling debris triggered a fire at the 20mtpa Kirishi refinery, following last week’s attack on the key Primorsk terminal.
Argus estimates that these attacks have halted ish 300 kbl/d of Russian refining capacity in August and September. While the market impact is limited for now, the action signals Kyiv’s growing willingness to disrupt oil flows – supporting a soft geopolitical floor under prices.
The political environment is shifting: the EU is reportedly considering sanctions on Indian and Chinese firms facilitating Russian crude flows, while the U.S. has so far held back – despite Bessent warning that any action from Washington depends on broader European participation. Senator Graham has also publicly criticized NATO members like Slovakia and Hungary for continuing Russian oil imports.
It’s worth noting that China and India remain the two largest buyers of Russian barrels since the invasion of Ukraine. While New Delhi has been hit with 50% secondary tariffs, Beijing has been spared so far.
Still, the broader supply/demand balance leans bearish. Futures markets reflect this: Brent’s prompt spread (gauge of near-term tightness) has narrowed to the current USD 0.42/bl, down from USD 0.96/bl two months ago, pointing to weakening backwardation.
This aligns with expectations for a record surplus in 2026, largely driven by the faster-than-anticipated return of OPEC+ barrels to market. OPEC+ is gathering in Vienna this week to begin revising member production capacity estimates – setting the stage for new output baselines from 2027. The group aims to agree on how to define “maximum sustainable capacity,” with a proposal expected by year-end.
While the IEA pegs OPEC+ capacity at 47.9 million barrels per day, actual output in August was only 42.4 million barrels per day. Disagreements over data and quota fairness (especially from Iraq and Nigeria) have already delayed this process. Angola even quit the group last year after being assigned a lower target than expected. It also remains unclear whether Russia and Iraq can regain earlier output levels due to infrastructure constraints.
Also, macro remains another key driver this week. A 25bp Fed rate cut is widely expected tomorrow (Wednesday), and commodities in general could benefit a potential cut.
Summing up: Brent crude continues to drift sideways, finding near-term support from geopolitics and refining strength. But with surplus building and market structure softening, the upside may remain capped.
Brent crude is essentially flat on the week, but after a volatile ride. Prices started Monday near USD 65.5/bl, climbed steadily to a mid-week high of USD 67.8/bl on Wednesday evening, before falling sharply – losing about USD 2/bl during Thursday’s session.
Brent is currently trading around USD 65.8/bl, right back where it began. The volatility reflects the market’s ongoing struggle to balance growing surplus risks against persistent geopolitical uncertainty and resilient refined product margins. Thursday’s slide snapped a three-day rally and came largely in response to a string of bearish signals, most notably from the IEA’s updated short-term outlook.
The IEA now projects record global oversupply in 2026, reinforcing concerns flagged earlier by the U.S. EIA, which already sees inventories building this quarter. The forecast comes just days after OPEC+ confirmed it will continue returning idle barrels to the market in October – albeit at a slower pace of +137,000 bl/d. While modest, the move underscores a steady push to reclaim market share and adds to supply-side pressure into year-end.
Thursday’s price drop also followed geopolitical incidences: Israeli airstrikes reportedly targeted Hamas leadership in Doha, while Russian drones crossed into Polish airspace – events that initially sent crude higher as traders covered short positions.
Yet, sentiment remains broadly cautious. Strong refining margins and low inventories at key pricing hubs like Europe continue to support the downside. Chinese stockpiling of discounted Russian barrels and tightness in refined product markets – especially diesel – are also lending support.
On the demand side, the IEA revised up its 2025 global demand growth forecast by 60,000 bl/d to 740,000 bl/d YoY, while leaving 2026 unchanged at 698,000 bl/d. Interestingly, the agency also signaled that its next long-term report could show global oil demand rising through 2050.
Meanwhile, OPEC offered a contrasting view in its latest Monthly Oil Market Report, maintaining expectations for a supply deficit both this year and next, even as its members raise output. The group kept its demand growth estimates for 2025 and 2026 unchanged at 1.29 million bl/d and 1.38 million bl/d, respectively.
We continue to watch whether the bearish supply outlook will outweigh geopolitical risk, and if Brent can continue to find support above USD 65/bl – a level increasingly seen as a soft floor for OPEC+ policy.
Brent crude makes some gains as Israel’s attack on Hamas in Qatar rattles markets. Brent crude spiked to a high of USD 67.38/b yesterday as Israel made a strike on Hamas in Qatar. But it wasn’t able to hold on to that level and only closed up 0.6% in the end at USD 66.39/b. This morning it is starting on the up with a gain of 0.9% at USD 67/b. Still rattled by Israel’s attack on Hamas in Qatar yesterday. Brent is getting some help on the margin this morning with Asian equities higher and copper gaining half a percent. But the dark cloud of surplus ahead is nonetheless hanging over the market with Brent trading two dollar lower than last Tuesday.

Geopolitical risk premiums in oil rarely lasts long unless actual supply disruption kicks in. While Israel’s attack on Hamas in Qatar is shocking, the geopolitical risk lifting crude oil yesterday and this morning is unlikely to last very long as such geopolitical risk premiums usually do not last long unless real disruption kicks in.
US API data yesterday indicated a US crude and product stock build last week of 3.1 mb. The US API last evening released partial US oil inventory data indicating that US crude stocks rose 1.3 mb and middle distillates rose 1.5 mb while gasoline rose 0.3 mb. In total a bit more than 3 mb increase. US crude and product stocks usually rise around 1 mb per week this time of year. So US commercial crude and product stock rose 2 mb over the past week adjusted for the seasonal norm. Official and complete data are due today at 16:30.
A 2 mb/week seasonally adj. US stock build implies a 1 – 1.4 mb/d global surplus if it is persistent. Assume that if the global oil market is running a surplus then some 20% to 30% of that surplus ends up in US commercial inventories. A 2 mb seasonally adjusted inventory build equals 286 kb/d. Divide by 0.2 to 0.3 and we get an implied global surplus of 950 kb/d to 1430 kb/d. A 2 mb/week seasonally adjusted build in US oil inventories is close to noise unless it is a persistent pattern every week.
US IEA STEO oil report: Robust surplus ahead and Brent averaging USD 51/b in 2026. The US EIA yesterday released its monthly STEO oil report. It projected a large and persistent surplus ahead. It estimates a global surplus of 2.2 m/d from September to December this year. A 2.4 mb/d surplus in Q1-26 and an average surplus for 2026 of 1.6 mb/d resulting in an average Brent crude oil price of USD 51/b next year. And that includes an assumption where OPEC crude oil production only averages 27.8 mb/d in 2026 versus 27.0 mb/d in 2024 and 28.6 mb/d in August.
Brent will feel the bear-pressure once US/OECD stocks starts visible build. In the meanwhile the oil market sits waiting for this projected surplus to materialize in US and OECD inventories. Once they visibly starts to build on a consistent basis, then Brent crude will likely quickly lose altitude. And unless some unforeseen supply disruption kicks in, it is bound to happen.
US IEA STEO September report. In total not much different than it was in January

US IEA STEO September report. US crude oil production contracting in 2026, but NGLs still growing. Close to zero net liquids growth in total.


Tyskland har så höga elpriser att företag inte har råd att använda elektricitet
Brent crude ticks higher on tension, but market structure stays soft

Kinas elproduktion slog nytt rekord i augusti, vilket även kolkraft gjorde

Det stigande guldpriset en utmaning för smyckesköpare

Aktier i guldbolag laggar priset på guld

Meta bygger ett AI-datacenter på 5 GW och 2,25 GW gaskraftverk
Aker BP gör ett av Norges största oljefynd på ett decennium, stärker resurserna i Yggdrasilområdet
Sommarens torka kan ge högre elpriser i höst
Brent edges higher as India–Russia oil trade draws U.S. ire and Powell takes the stage at Jackson Hole

Mahvie Minerals är verksamt i guldrikt område i Finland
-
 Nyheter4 veckor sedan
Meta bygger ett AI-datacenter på 5 GW och 2,25 GW gaskraftverk
-
 Nyheter4 veckor sedan
Aker BP gör ett av Norges största oljefynd på ett decennium, stärker resurserna i Yggdrasilområdet
-
 Nyheter4 veckor sedan
Sommarens torka kan ge högre elpriser i höst
-
Analys4 veckor sedan
Brent edges higher as India–Russia oil trade draws U.S. ire and Powell takes the stage at Jackson Hole
-
 Nyheter3 veckor sedan
Mahvie Minerals är verksamt i guldrikt område i Finland
-
Analys3 veckor sedan
Increasing risk that OPEC+ will unwind the last 1.65 mb/d of cuts when they meet on 7 September
-
Analys2 veckor sedan
OPEC+ in a process of retaking market share
-

 Nyheter3 veckor sedan
Neil Atkinson spår att priset på olja kommer att stiga till 70 USD