

Analys
SEB – Råvarukommentarer, 16 december 2013

Rekommendationer
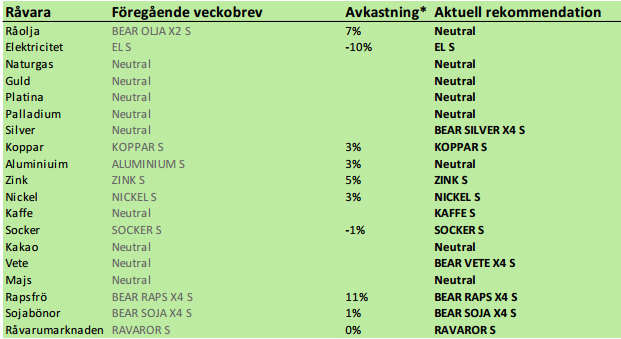
*) Avkastningen anges för 1:1 certifikaten där både BULL och 1:1 certifikat är angivna.
Allmän uppföljning och bakgrund
Olja och el föll i veckan som gick, medan amerikansk naturgas steg. Soja, majs och vete föll efter den serie av höjda produktionsestimat som kommit. Socker föll, men kaffe steg. Basmetallerna steg alla. Guld och silver rörde sig sidledes, i avvaktan på veckans FED-möte, som allt fler tror kommer att ge besked om att ”tapering” av QE inleds.
Vi har några rekommendationsändringar också. Vi går över till neutral på aluminium från den kortsiktiga köprekommendationen. Vi går över till neutral på olja från sälj och vi gör över till sälj på vete från neutral. Silver går över från neutral till en kortisktig säljrekommendation på. Kaffe går vi efter lång väntan över till köprekommendation på. Mars-terminen stängde över tidigare toppar på 115 cent i fredags och vi går över till köprekommendation med målkursen 130 cent.
Nästa veckobrev kommer ut i januari och vi önskar alla läsare en God Jul och Gott Nytt År 2014!
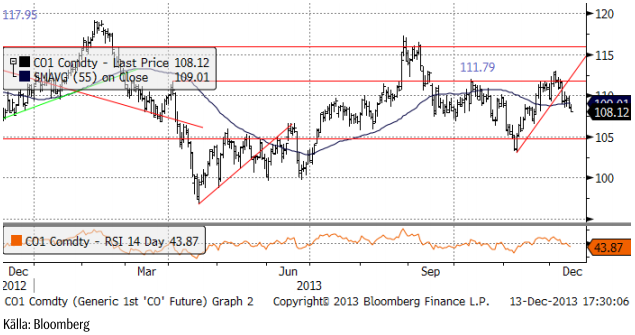
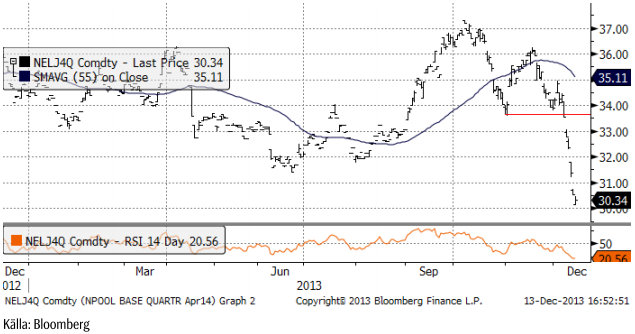
Råolja – Brent
Oljepriset sjönk förra veckan från 111.6 dollar till drygt 108 dollar. Den tekniska stödlinjen bröts och det borde finnas ytterligare lite till att hämta på nedsidan innan det är dags att gå ur BEAR OLJA X2 S, som vi rekommenderade förra veckan. Snart är det dags att återgå till OLJA S, som är en långsiktig position som tjänar pengar huvudsakligen på rabatten i terminsmarknaden för olja. Dock har backwardation minskat den senaste tiden och är nu endast 3% på årsbasis. Man bör alltså avvakta med köp av OLJA S.
I måndags fattade Mexikos parlament det väntade beslutet om att liberalisera och modernisera sin petroleumlagstiftning, inklusive en sänkning av produktionsskatten. Presidenten väntar sig en produktionsökning från dagens 2.5 mbpd till 3.5 mbpd inom några år, men det låter i våra öron orealistiskt.
Libyens regering har meddelat att alla landets oljehamnar ska vara öppna från och med den 15 december. Libyen producerar idag (utan alla oljehamnar i drift) 250,000 bpd. Maxproduktionen är 1.5 mbpd och det är regeringens målsättning att nå dit. Vi tror att landet visserligen kommer att göra sitt bästa, men man har inte löst några strukturella problem, det som legat bakom produktionsbortfallet. Libyen är fortfarande ett klan-samhälle, där människors lojalitet i första hand är till den egna klanen.
Iran har en ”interrim deal” med världssamfundet, men uppgörelsen måste ratificeras av USA:s kongress och av högste ledaren i Iran. Produktionen har hittills i år legat på 2.6 mbpd och exporten på 1.1 mbpd och kommer förmodligen att göra det en bit in på nästa år. USA är naturligtvis oroligt för att Iran ska producera och exportera mer, samtidigt som landet inte avvecklar sitt kärnvapenprogram. Iran var det första land som engelsmännen hittade olja i, vid början av 1900-talet. Anglo Persian var starten till det som idag är BP. Fortfarande finns stora reserver och resurser i landet.
Primus motor på efterfrågesidan, Kina, väntas öka sin oljekonsumtion med 0.5 mbpd nästa år. Samtidigt ser vi alltså att länder som Mexico, Libyen och Iran var och en för sig har potential att mätta den efterfrågeökningen, även om det inte är sannolikt att någon av dem faktiskt gör det. Men tillsammans har de goda möjligheter att göra det.
Det mest iögonfallande med Kinas ekonomi just nu är att osäkra fordringar ökar i Kinas banksystem. Det finns en risk för en krasch i Kina. Vi ser i och för sig, som nämnt ovan, att konsumtionen växer, inte minst oljekonsumtionen.
Exxon Mobile publicerade nyligen sin långsiktiga energy outlook. De är positiva till möjligheterna att kraftigt öka produktionen av olja, men fram emot 2030 tror de att OPEC-oljan återigen växer i betydelse, eftersom OPEC sitter på så stora reserver av olja. Vi noterar dock att den här prognosen inte i det avseendet skiljer sig från en mycket stor mängd tidigare prognoser om framtida produktion. Nästan alla sådana prognoser har förutspått en minskning av produktionen någonstans inne i framtiden, men det har aldrig blivit så. Ny teknik har sänkt kostnaderna och gjort tidigare olönsamma resurser till utvinningsbara reserver.
En sak som inte påverkar oljepriset, men som kommer att prägla marknaden, framförallt i Europa de närmaste åren, är en närmast total utslagning av raffinaderier i Europa. En stor del av kostnaden för ett raffinaderi är energin som går åt vid processen. USA har därvid tillgång till gas till en tredjedel av priset i Europa och billig elektricitet. För Sveriges del är detta bekymmersamt, eftersom en av Sveriges största exportprodukter är petroleumprodukter. Raffinaderierna i EU är dessutom gamla och enkla, medan de nya stora raffinaderierna i Asien är väsentligt mycket mer effektiva.
Ser vi till DOE-statistiken i veckan, ser vi att USA kom över 7000 mbp per konsumtion i november för första gången sedan 2008.
I onsdagens DOE-rapport föll råoljelagren fortsatt och ligger nu på samma nivå som för ett år sedan.
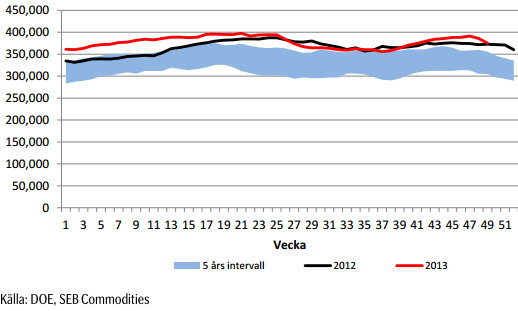
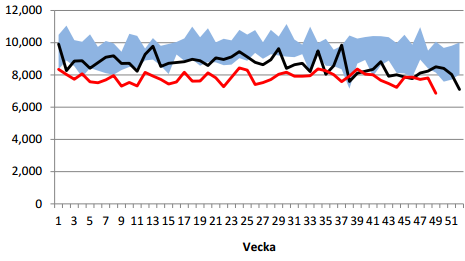
Anledningen till de lägre lagren i veckan var dock inte ökad konsumtion, utan väsentligt lägre import. Importen var på den lägsta nivån i år. Därmed var den på den lägsta nivån på åtminstone 7 år (sannolikt på mycket längre tid än så, men jag har inte kollat upp den saken).
Vi lutar fortsatt åt att det kan finnas potential för ytterligare nedgång i oljepriset, men man bör inte dra sig för att gå ur BEAR OLJA X2 S och lägga sig neutral.
Elektricitet
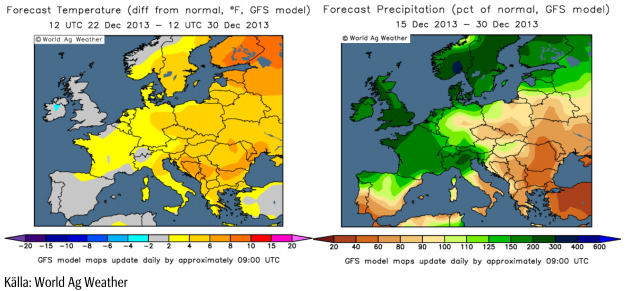
Elpriset klappade ihop fullständigt i veckan som gick, i en handel där få aktörer vågade köpa och andra stängde långa positioner med stor besvikelse. Vinterpremien har helt gått ur terminsmarknaden och det är ovanligt. Den enda fundamentala orsaken till prisnedgången är det oväntade omslaget i väder i det nordiska börsområdet till milt och blött.
Nedanför ser vi prognoser på avvikelsen från det normala. Till vänster är det väntad avvikelse i temperatur. Vi ser att Sverige och Norge väntas vara 4 – 6 grader varmare än normalt 22 – 30 december. Vi ser också att Finland väntas vara 6 -10 grader varmare än normalt. I kartbilden till höger ser vi nederbördens avvikelse från det normala. Vi ser att det väntas regna mycket mer än normalt i Sverige, Norge och Finland under perioden 15 december till 30 december.
Priset på nordisk el har fallit med nästan 15% i förhållande till tysk eller kontinental på en vecka. SEB har index som följer avkastningen på en investering i kvartalskontrakt på el. Indexen beräknas av NasdaqOMX. Vi ser kvoten mellan SEBCNPOW (nordiska terminer) och SEBCEPOW (kontinentala elterminer) nedan och det kraftiga fallet i veckan.
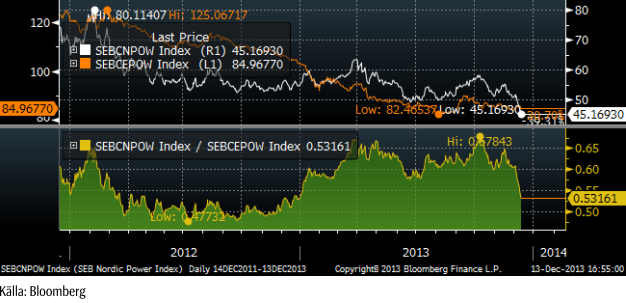
Långsiktigt ges elpriset i Norden av det tyska, kontinentala, priset på el, som i sin tur ges av marginalkostnaden för kolkraft. Priset på kol har faktiskt gått upp i veckan, liksom priset på utsläppsrätter. Utsläppsrätterna gick upp från 4.92 till 5.03 euro.
Nedan ser vi priset på energikol, den närmaste månadens leveranstermin.
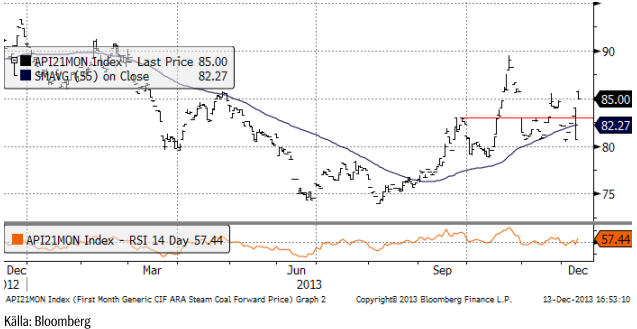
Ett så kraftigt fall som vi haft på andra kvartalets terminskontrakt, kan följas av fler likadana dagar. Ett problem med positioner som tas med hänvisning till att något är ”fundamentalt” billigt, är att om priset faller, så blir det bara ”ännu billigare” och alltså ännu mer köpvärt. ”Stop loss” idén blir inte riktigt tillämpbar i sådana situationer.
Vi anser alltjämt att elpriset på ett par års sikt kommer att vara högre än det är idag, därför att det ytterst styrs av kolpriset och detta ligger under produktionskostnaden. Inget har förändrat detta och därför tycker vi egentligen att elpriset är ännu mer köpvärt idag än det var tidigare.
Men det ser fortsatt svagt ut. Vi har 2.5 gånger normal nederbörd i prognosen och 6 grader över normal temperatur över 10-dygnsprognosen. Dessutom kommer allt detta med vind – lagom stark för att vindkraften ska producera på hög kapacitet. Spotpriset, sys, är nere på 31.5, också lägre än marknadens tro i fredags. Stor utmaning för systemet kommande veckor med ”körpress” i samband med låg helgkonsumtion. Under Julhelgen kan spotpriset bli lågt, mycket lågt. Men vi vet dock att om det blir ett plötsligt väderomslag, kan prisuppgången bli plötslig och stark.
Långsiktigt tycker vi elpriset är billigt och köpvärt, men vi skulle inte köpa (mer) idag, utan vara beredd på att köpa när vädret slår om.
Vår vy är därför att EL S är rätt placering, men avvakta med köp.
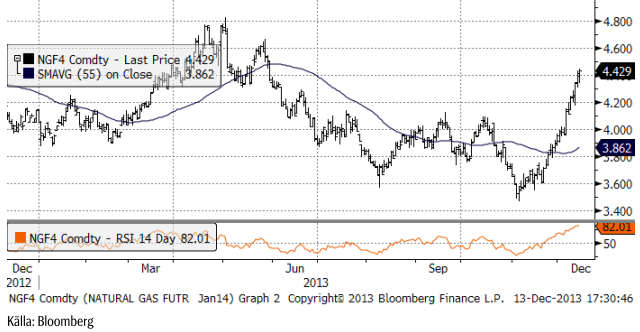
Naturgas
Naturgaspriset i USA har handlats upp på det kalla vädret. Det har varit mycket kallt i USA i veckan.
Koppar
Som vi nämnde förra veckan, karaktäriseras den fysiska marknaden av stabil efterfrågan, till den grad att det finns en bristsituation på raffinerad metall för omedelbar leverans. Bristen återspeglas i frontkontrakten och har blivit ännu tydligare den här veckan på LME. 3-månaders terminer handlas med 15 dollars rabatt i förhållande till spotpriset. De flesta marknadsobservatörer gör bedömningen att detta är ett tillfälligt fenomen. De väntar sig högre produktion av raffinerad metall i framtiden.
Kinesisk produktionsstatistik publicerades i veckan. Den visade att produktionen i november låg på en ny rekordnivå. Produktionen var 28% högre än förra året, på 654 kt. Trots detta uppvisade kopparmarknaden en imponerande styrka i veckan.
Som vi nämnt tidigare, har kopparproduktionen i Indonesien kommit in i nyhetsflödet. Tidigare har fokus helt varit på nickelmalmen. Freeport McMoRan är i diskussioner med den indonesiska regeringen att “clarify the situation surrounding a ban on unprocessed raw-material exports”. Bara det faktum att den enorma Grasberg-gruvan, kan komma att omfattas av exportförbudet, kan ha bidragit till prisuppgången på koppar i veckan. Den generella uppfattningen bland marknadsaktörerna verkar dock vara att exporten (koppar och guld) från gruvan inte berörs, eftersom den arbetar under ett ”Contract of Work” (COW). De flesta andra producenter i landet arbetar under ”Local Business Licenses” (IUP).
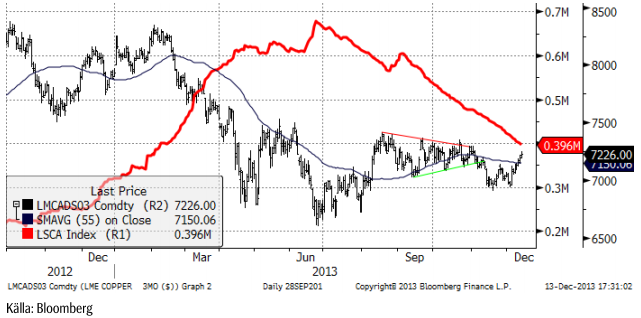
Vi tycker att prisfallet har gett en möjlighet att komma in på den långa sidan till bra pris och rekommenderar köp av KOPPAR S.
Aluminium
Aluminium, som till skillnad från de andra basmetallerna, befinner sig prismässigt i fallande trend och inte i en konsolidering, följde med de andra metallerna uppåt på generellt täckning av korta positioner i marknaden. Handeln inleddes på 1774 dollar i måndags och nådde högsta noteringen i onsdags på 1824. Det var tillräckligt för att attrahera nya säljare. Aluminium är den metall med störst produktionsöverskott och vi är inte förvånade över marknadens bedömning. Vi tror dock att återhämtningen kan fortsätta ett par veckor till, men inte med någon styrka. Om priset faller tillbaka, kan 1750 dollar vara en stödnivå att ta fasta på.
LME-lagren har börjat minska (röd linje), med 40 kt i veckan. Annullerade warrants (lagerbevis vid LME) uppgick till 200 kt. Den allmänna uppfattningen är att detta material flyttas till andra lagerhus och alltså inte konsumeras. LME:s lagerhus är dyrare än lagerhus utanför LME. Det kan till och med vara i samma lagerlokal, men flyttad till en annan del, som inte ingår i LME:s lager. Detta lager fortsätter att hedgas med terminer på LME, där terminerna idag alltjämt erbjuder ca 7% intäkt, som ska täcka finansieringskostnad (låg) och lagerkostnad, vilket det med lätthet gör när intäkten är 7% på en metall, som aluminium.
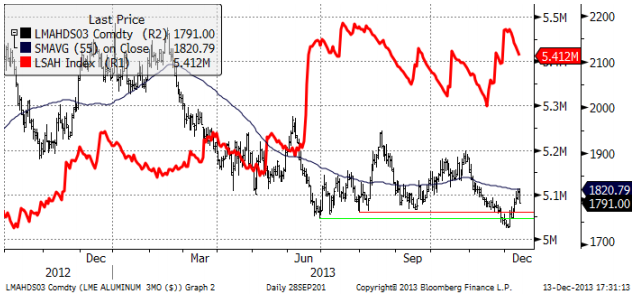
Vi har haft kortsiktigt köp på aluminium, men går över till neutral nu.
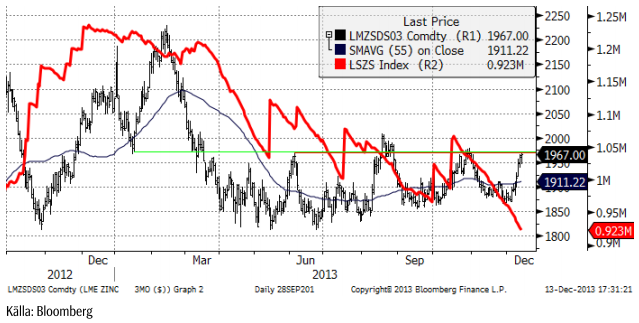
Zink
Zinkpriset har visat imponerande styrka och priset testar nu den övre delen av prisintervallet som varit rådande sedan vårvintern. Tendensen till högre bottnar, vilket indikerar en styrka i marknaden gör att vi tror att topparna kring 2000 dollar / ton kommer att tas ut, om inte vid den här gången, så vid nästa uppgång. Zinkrpiset steg med 3.8% i veckan. Terminskurvan visar tecken på brist. Cash till tre-månders spreaden har gått från 20 dollar i contango till samma pris på en vecka. Det är ett tecken på att placerare täcker korta positioner. De köper 3-månders termin och justerar positionen i datum nära cash (spreaden blir då en ”borrow”).
Marknaden ser ut att ha gått lite för långt med nio uppgångsdagar i följd! Föregående topp på 1980 dollar kommer förmodligen att innebära en anledning för vissa att ta hem vinster. Men som nämnt ovan, finns möjligheter för ytterligare uppgång. Zink är den bästa metallen i år, då den bara gått ner med 5% sedan året började.
Som vi ser fortsätter lagren av metall vid LME att rasa (röd kurva).
Vi rekommenderar köp av ZINK S.
Nickel
Som väntat, intensifierades spekulationerna om att Indonesien verkligen ska införa sitt sedan länge beslutade förbud mot export av nickelmalm / koncentrat. Öppen balans steg också på LME, vilket kan innebära att nya terminsköpare har kommit in i marknaden. Stigande öppen balans och stigande priser innebär också vanligtvis att momentum är på köpsidan. På optionsmarknaden stiger handlade volatiliteter, vilket innebär att folk köper optioner för att skydda sig mot risken för kraftigt stigande pris på nickel. Det är en vanlig strategi att köpa optioner, istället för terminer, när det finns en asymmetri i möjliga utfall. Om det blir ett exportstopp, kan priset stiga kraftigt. Om det inte blir det, faller priset, men inte mycket. I sådana digitala situationer är det bra att vara ägare av köpoptioner, i alla fall om man kan få dem så billigt som man kunde för en vecka sedan.
Vår tolkning av marknadsläget är att marknaden inte är säker på att exportförbudet verkligen kommer att genomföras fullt ut. Om det införs, kommer det att ha en stor och avgörande påverkan. Indonesien producerar 15% av världens nickelmalm. Nickelinnehållet är 450 kt. Det här materialet är avgörande för Kinas nya lågkostnadsproducenter av Nickel Pig Iron, för rostfritt stål. Alternativet till Indonesiens lateritmalm / ferronickel, är malm från Filippinerna, som har lägre nickelhalt. 450 kt ska jämföras med överskottet i nickelmarknaden som är 50 – 100 kt på årsbasis. LME-lagret uppgår till 250 kt. Kina sägs ha 6 månaders lager av nickelmalm. Så om det blir ett totalt exportförbud, finns det lager att ta av till dess exporten av metall kommer igång, men bufferten och lagren försvinner.
Tekniskt noterar vi att stödet som bottennivån från juli höll. Det är fritt upp till 15,000 dollar per ton, den övre delen av prisintervallet som priset har handlats inom sedan sommaren.
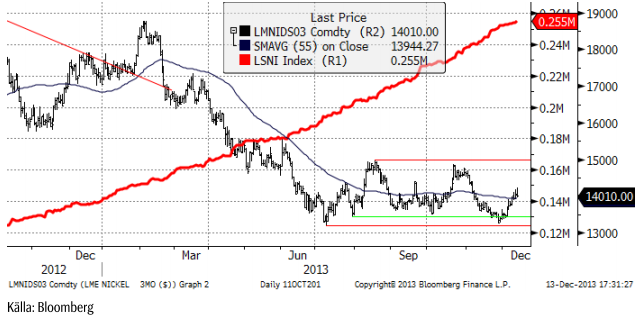
Vi rekommenderar köp av NICKEL S.
Guld
Guldpriset (i dollar) fann stöd på samma nivå som vårens prisfall hejdades vid, alltså vid 1200 dollar per uns. Certifikatplacerare har hållit sig borta från köpsidan sedan i våras, men i veckan kom de tillbaka. Priset steg som mest upp mot det tekniska motstånd som gavs av bottennoteringarna i augusti och i oktober. Att marknaden inte orkade över den nivån, ser vi som negativt. Vi tror att marknaden kommer att vilja testa 1200 igen. Det talas om att FED eventuellt kommer att fatta beslut om ”tapering” av QE på sitt möte i veckan som kommer. Om de gör det kan det få guldpriset att falla.
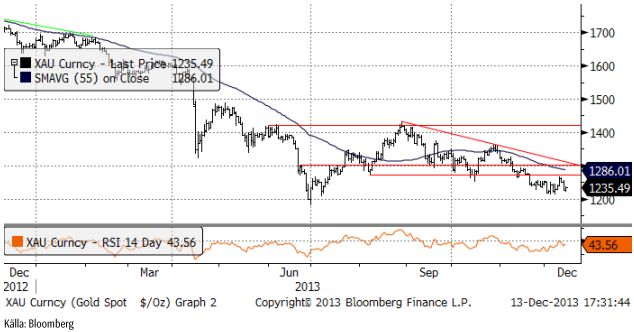
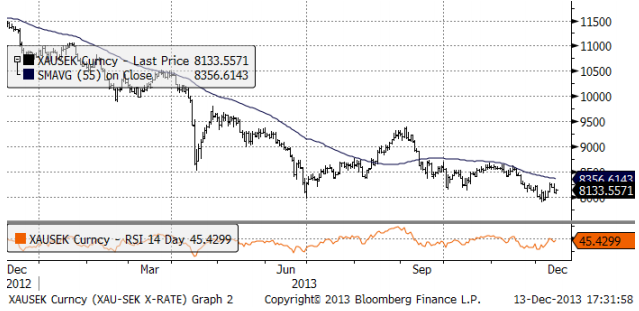
I termer av kronor, är priset på guld strax över botten-noteringen. Trenden är fallande. Gissningsvis fortsätter priset att sjunka.
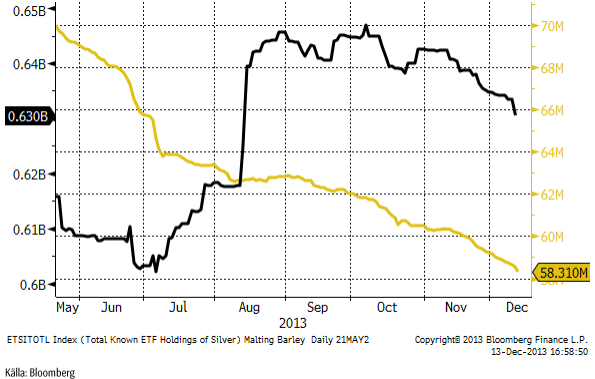
Finansiella placerare har fortsatt att i stadig takt överge guld som investering, som vi ser i diagrammet över ETP-ers guldinnehav. Även innehaven i silver likvideras, i veckan accelererade likvideringen av silver-ETP-er.
Priset på guld är nere på en nivå där många gruvbolag inte kan redovisa vinst långsiktigt och det gör att vi trots allt inte är beredda att gå kort, men det troliga är ändå att priset går ner ytterligare lite och risken är att FED-mötet i veckan ger en anledning att sälja på guldet.
Vi fortsätter tills vidare med neutral vy på guld.
Silver
Nedan ser vi kursdiagrammet för silver i dollar per troy ounce. Det ser faktiskt tydligt negativt ut, med en rekyl upp mot den tidigare genombrutna stödlinjen, avklarad. Vi går över till säljrekommendation, kortsiktigt. Vi tänker att målkursen kan vara 18 dollar och BEAR SIlLVER X2 S kan kanske vara att föredra med lägre risknivå än X4:an.
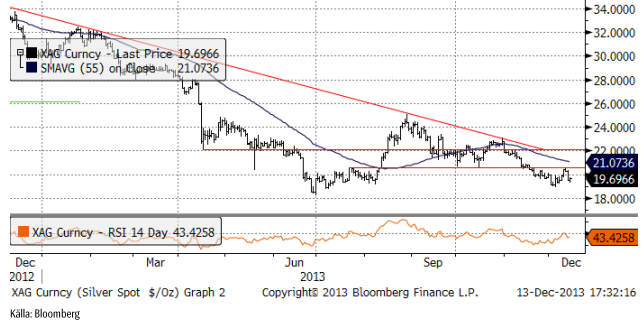
Vi gör alltså en kortsiktig rekommendation av BEAR SILVER X2 S – eller för den som vill ta mer risk – BEAR SILVER X4 S.
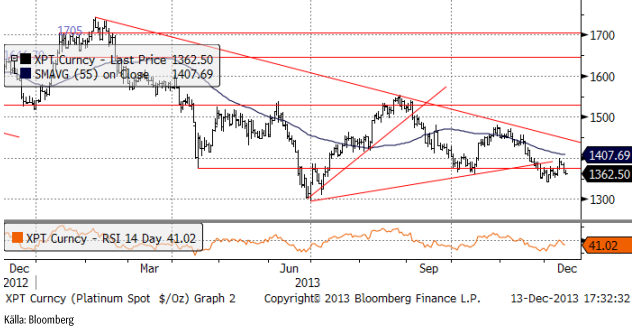
Platina & Palladium
Gruvarbetarna i NUM-facket vid Northam-gruvan röstade häromdagen om att fortsätta strejken. Dessutom fick Lonmin-anställda rätt att gå i strejk i tisdags, av den statliga medlaren. Platina-priset har trots detta fallit tillbaka. Den tekniska analysen indikerar sälj.
Tekniskt har platinapriset brutit en triangelformation på nedsidan, nu på klassiskt vis gått upp till strax under nedre delen av den triangeln och detta brukar följas av ett nytt prisfall. Enligt den tekniska analysen skulle ett test av 1300 dollar vara att vänta.
Priset på palladium föll tillbaka från uppgången till över 740 dollar och ligger nu på 720. Notera dock det starka stödet vid 710 dollar.
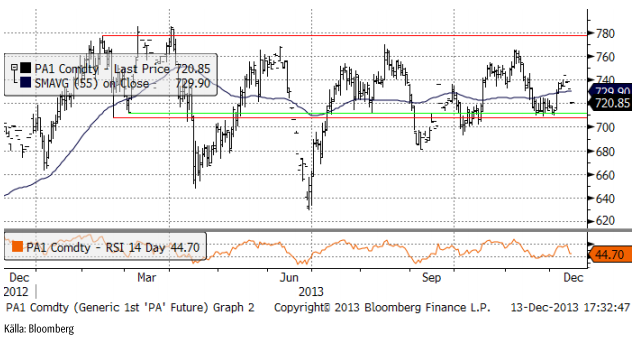
Vi behåller våra neutrala rekommendation på palladium och platina.
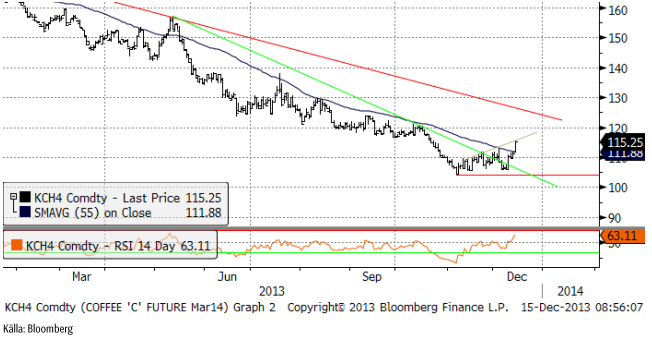
Kaffe
Kaffepriset tycks ha etablerat en botten strax över 100 cent. Det är det lägsta priset på sju år. Sedan tidigt 1970-tal har kaffepriset vänt upp från 100 cent inte mindre än sju gånger (beror lite på hur man räknar). Vi går nu över till köprekommendation, men vi ska samtidigt ha i minnet att det fortfarande råder ett produktionsöverskott i världen. De kaffebönder som reagerade på rekordpriserna för tre år sedan och planterade nya kaffebuskar, började få skörd två år efter planteringen. Kaffebuskarnas ekonomiska livslängd är ca 15 år. Kaffebönderna drar sig nog i det längsta för att byta ut dem till sockerrör, i synnerhet som det priset inte utvecklat sig så mycket bättre. Produktionskostnaden i Brasilien väntas enligt USDA uppgå till 147 cent / pund – i genomsnitt. I den här köprekommendationen tror vi dock att det är bra att ta sikte på 130 cent. Det är en nivå med tekniskt motstånd. Naturligtvis måste man utvärdera hur marknaden går, men 130 cent kan vara en bra målkurs just nu.
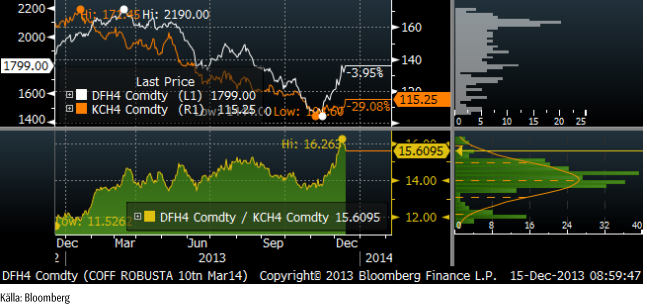
Vietnam håller inne med försäljning, trots att man fått en rekordskörd. Det har gjort att terminerna på robusta i London har stigit kraftigt den senaste tiden – och dragit ifrån den dyrare arabican. Robusta handlas i dollar / ton och arabican i cent / pund. I diagrammet nedan, ser vi hur spreaden mellan de två gått isär – vilket eftersom priserna hänger ihop på lång sikt – innebär att sannolikeheten är stor att spreaden går ihop igen. Dt kan i och för sig ske genom att robustan faller i pris, och inte enbart genom att arabican stiger i pris.
Vi rekommenderar alltså köp av KAFFE S, eller BULL KAFFE X4 S för den som vill ta mer risk.
För fler analyser på jordbruksråvaror se SEBs analysbrev om jordbruksråvaror.
[box]SEB Veckobrev Veckans råvarukommentar är producerat av SEB Merchant Banking och publiceras i samarbete och med tillstånd på Råvarumarknaden.se[/box]
Disclaimer
The information in this document has been compiled by SEB Merchant Banking, a division within Skandinaviska Enskilda Banken AB (publ) (“SEB”).
Opinions contained in this report represent the bank’s present opinion only and are subject to change without notice. All information contained in this report has been compiled in good faith from sources believed to be reliable. However, no representation or warranty, expressed or implied, is made with respect to the completeness or accuracy of its contents and the information is not to be relied upon as authoritative. Anyone considering taking actions based upon the content of this document is urged to base his or her investment decisions upon such investigations as he or she deems necessary. This document is being provided as information only, and no specific actions are being solicited as a result of it; to the extent permitted by law, no liability whatsoever is accepted for any direct or consequential loss arising from use of this document or its contents.
About SEB
SEB is a public company incorporated in Stockholm, Sweden, with limited liability. It is a participant at major Nordic and other European Regulated Markets and Multilateral Trading Facilities (as well as some non-European equivalent markets) for trading in financial instruments, such as markets operated by NASDAQ OMX, NYSE Euronext, London Stock Exchange, Deutsche Börse, Swiss Exchanges, Turquoise and Chi-X. SEB is authorized and regulated by Finansinspektionen in Sweden; it is authorized and subject to limited regulation by the Financial Services Authority for the conduct of designated investment business in the UK, and is subject to the provisions of relevant regulators in all other jurisdictions where SEB conducts operations. SEB Merchant Banking. All rights reserved.

Market is starting to take US/Iran headlines with a pinch of salt. Brent crude rose $2.8/b yesterday to an official close of $112.1/b. But after that it traded as low as $108.05/b before ending late night at around $109.7/b. Through the day it traded in a range of $106.87 – 112.72/b amid a flurry of news or rumors from Iran and the US. ”US temporary sanctions during negotiations” (falls alarm). ”We will bomb Iran” (not anyhow),… etc. While the market is still fluctuating to this kind of news flow, it is starting to take such headlines with a pinch of salt.

We’ll see. Maybe, maybe not. The Brent M1 contract is trading at $110.2/b this morning which very close to the average ticks through yesterday of $110.4/b.
Trump with bearish, verbal intervention whenever Brent trades above $110/b it seems. What seems to be a pattern is that Trump states something like ”very good negotiations going on with Iran”, ”New leaders in Iran are great,..”, ”Great progress in negotiations,…”, ”Deal in sight,..” etc whenever the Brent M1 contract trades above $110/b. An effort to cool the market. These hot air verbal interventions from Trump used to have a heavy bearish impact on prices, but they now seems to have less and less effect unless they are backed by reality.
As far as we can see there has been no real progress in the negotiations between the US and Iran with both sides still standing by their previous demands.
Iran is getting stronger while the cease fire lasts making a return to war for Trump yet harder. Iran is naturally in constant preparation for a return to war given Trump’s steady threats of bombing Iran again. Iran is naturally doing what ever is possible to prepare for a return to war. And every day the cease fire lasts it is better prepared. This naturally makes it more and more difficult and dangerous for the US to return to warring activity versus Iran as the consequences for energy infrastructure in the Persian Gulf will be more and more severe the longer the cease fire lasts. Israel seems to see it this way as well. That the war is not won and that current frozen state of a cease fire gives Iran opportunity to rebuild military and politically.
Global inventories are drawing down day by day. How much? In the meantime the Strait of Hormuz stays closed. There is varying measures and estimates of how much global inventories are drawing down. Our rough estimate, back of the envelope, is that global inventories are drawing down by at least some 10 mb/d or about 300 mb/d in a balance between loss of supply versus demand destruction. Other estimates we see are a monthly draw of 250-270 mb/d. The IEA only ’measured’ a draw in global observable stocks of 117 mb in April with oil on water rising 53 mb while on shore stocks fell 170 mb. But global stocks are hard to measure with large invisible, unmeasured stocks. As such a back of the envelope approach may be better.
Oil products is what the world is consuming. Oil product prices likely to rise while product stocks fall. Strategic Petroleum Reserves (SPR) are predominantly crude oil. Discharging oil from OECD SPR stocks, a sharp reduction in Chinese crude imports and a reduction in global refinery throughput of 6-7 mb/d has helped to keep crude oil markets satisfactorily supplied. But global inventories are drawing down none the less. And oil products is really what the world is consuming. So if global refinery throughput stays subdued, then demand will eventually have to match the supply of oil products. The likely path forward this summer is a steady draw down in jet fuel, diesel and gasoline. Higher prices for these. Then, if possible, higher refinery throughput and higher usage of crude in response to very profitable refinery margins. And lastly sharper draw in crude stocks and higher prices for these. But some 6 mb/d of oil products used to be exported through the Strait of Hormuz. And it may not be so easy to ramp up refinery activity across the world to compensate. Especially as Ukraine continues to damage Russian refineries as well as Russian crude production and export facilities.
Watch oil product stocks and prices as well as Brent calendar 2027. What to watch for this summer is thus oil product inventories falling and oil product premiums to crude rising. Another measure to watch is the Brent crude 2027 contract as it rises steadily day by day as the Strait of Hormuz stays closed and global oil inventories decline. The latter is close to the highest level since the start of the war and keeps rising.
The Brent M1 contract and the Brent 2027 prices and current price of jet fuel in Europe (ARA). All in USD/b

Our back of the envelope calculation of the global shortage created by the closure of the Strait of Hormuz. Note that 3.5 mb/d of discharge from SPR is also a draw. Note also that ’Forced demand loss’ of 2.5 mb/d is probably temporary and will fall back towards zero as logistics are sorted out leaving ’Price demand loss’ to do the job of balancing the market. Thus a shortfall of at least 9 mb/d created by the closure. More if SPR discharge is included and more if Forced demand loss recedes.

Brent is climbing higher. Front-month is at USD 106.3/bl this morning, close to a weekly high and a USD 9/bl jump from Mondays open. This is the move we flagged as a risk earlier in the week: the market shifting from ”a deal is around the corner” to ”this is going to take longer than we thought”.

Analyst Commodities, SEB
During April, rest-of-year Brent remained remarkably stable around USD 90/bl. A stability which rested on one single assumption: the SoH reopens around 1 May. That assumption is now slowly falling apart.
As we highlighted yesterday: every week of delay beyond 1 May adds (theoretically) ish USD 5/bl to the rest-of-year average, as global inventories draw 100 million barrels per week. i.e., a mid-May reopening implies rest-of-year Brent closer to USD 100/bl, and anything pushing into June or July takes us meaningfully higher.
What’s changed in the last 48 hours:
#1: The US military has formally warned that clearing suspected sea mines from SoH could take up to six months. That is a completely different timescale from what the financial market is pricing. Even a political deal tomorrow does not immediately reopen the strait.
#2: Trump has shifted his tone from urgency to ”strategic patience”. In yesterday’s press conference: ”Don’t rush me… I want a great deal.” The market is reading this as a president no longer feeling pressured by timelines, with the naval blockade running in the background.
#3: So far, the military activity is escalating, not de-escalating. Axios reports Iran is laying more mines in SoH. The US 3rd carrier strike group (USS George H.W. Bush) is arriving with two countermine vessels. Trump yesterday ordered the US Navy to destroy any Iranian boats caught laying mines. While CNN reports that the Pentagon is actively drawing up plans to strike Iranian SoH capabilities and individual Iranian military leaders if the ceasefire collapses. i.e., NOT a attitude consistent with an imminent deal!
Spot crude and product prices eased off the early-April highs on a combination of system rerouting and deal optimism. Both now weakening. Goldman estimates April Gulf output is reduced by 14.5 mbl/d, or 57% of pre-war supply, a number that keeps getting worse the longer this drags on.
Demand-side adaptation is ongoing: S. Korea has cut its Middle East crude dependence from 69% to 56% by pulling more from the Americas and Africa, and Japan is kicking off a second round of SPR releases from 1 May. But SPRs are finite.
Ref. to the negotiations, we should not bet on speed. The current Iranian leadership is dominated by genuine hardliners willing to absorb economic pain and run the clock to extract concessions. That is not a setup for a rapid resolution. US/Israeli media briefings keep framing the delay as ”internal Iranian divisions”, the reality is more complicated and points toward weeks and months, not days.
Our point is that the complexity is large, and higher prices have only just started (given a scenario where the negotiations drag out in time). The market spent April leaning on the USD 90/bl rest-of-year assumption; that case is diminishing by the hour. If ”early May reopening” is replaced by ”June, July or later” over the next week or two, both crude and products have meaningful room to reprice higher from here. There is a high risk being short energy and betting on any immediate political resolution(!).
Down on Friday. Up on Monday. The Brent June crude oil contract traded down 5.1% last week to a close of $90.38/b. It reached a high of $103.87/b last Monday and a low of $86.09/b on Friday as Iran announced that the Strait of Hormuz was fully open for transit. That quickly changed over the weekend as the US upheld its blockade of Iranian oil exports while Iran naturally responded by closing the SoH again. The US blew a hole in the engine room of the Iranian ship TOUSKA and took custody of the ship on Sunday. Brent crude is up 5.6% this morning to $95.4/b.
The cease-fire is expiring tomorrow. The US has said it will send a delegation for a second round of negotiations in Islamabad in Pakistan. But Iran has for now rejected a second round of talks as it views US demands as unrealistic and excessive while the US is also blocking the Strait of Hormuz.
While Brent is up 5% this morning, the financial market is still very optimistic that progress will be made. That talks will continue and that the SoH will fully open by the start of May which is consistent with a rest-of-year average Brent crude oil price of around $90/b with the market now trading that balance at around $88/b.
Financial optimism vs. physical deterioration. We have a divergence where the financial market is trading negotiations, improvements and resolution while at the same time the physical market is deteriorating day by day. Physical oil flows remain constrained by disrupted flows, longer voyage times and elevated freight and insurance costs.
Financial markets are betting that a US/Iranian resolution will save us in time from violent shortages down the road. But every day that the SoH remains closed is bringing us closer to a potentially very painful point of shortages and much higher prices.
The US blockade is also a weapon of leverage against its European and Asian allies. When Iran closed the SoH it held the world economy as a hostage against the US. The US blockade of the SoH is of course blocking Iranian oil exports. But it is also an action of disruption directed towards Europe and Asia. The US has called for the rest of the world to engaged in the war with Iran: ”If you want oil from the Persian Gulf, then go and get it”. A risk is that the US plays brinkmanship with the global oil market directed towards its European and Asian allies and maybe even towards China to force them to engage and take part. Maybe unthinkable. But unthinkable has become the norm with Trump in the White House.


Sommarväder skapar prisrally på elbörsen
Oil product price pain is set to rise as the Strait of Hormuz stays closed into summer

Solkraften pressar elpriserna dagtid

Michel Gubel ger sin syn på oljemarknaden