Följ oss

Analys

SEB – Råvarukommentarer, 15 september 2014
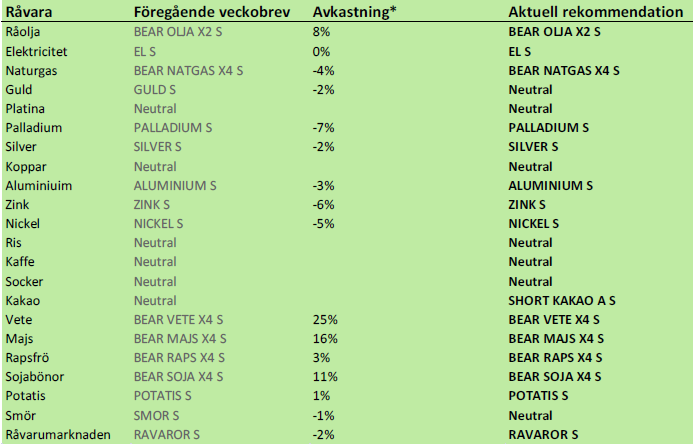
Publicerat

den

SEB Veckobrev med prognoser på jordbruksråvaror

Rekommendationer

SEB rekommenderar råvaror

Råolja – Brent

OPECs strategi är att hålla oljepriset på en nivå där ökningen av global efterfrågan på olja kan mättas med en ökning av produktionen av olja utanför OPEC. OPEC kan fortsätta att producera på nuvarande nivå i många år, utan allt för stora investeringar.

Oljepriset ska alltså enligt OPEC balansera på den nivå där break-even ligger utanför OPEC. OPEC själva producerar på i genomsnitt 20 dollar per fat, utan tillväxt. Det finns många olika produktionskostnader utanför OPEC, inte minst beroende på olika höga produktionsskatter. Om global ökning av oljeefterfrågan är hög, måste priset vara högre, för att stimulera produktionstillväxt utanför OPEC. Om global efterfrågetillväxt är låg, så behöver stimulansen utanför OPEC inte vara lika hög. Så här ser prognosen ut från OPEC:

(Non-OPEC supply growth) jämfört med (Global demand growth)
2013: +1.3 mb/d versus +1.2 mb/d
2014: +1.6 mb/d versus +0.9 mb/d
2015: +1.3 mb/d versus +1.2 mb/d

I dagens scenario av relativt svag global efterfrågeökning har vi alltså en situation där 100 dollar per fat ger en stark stimulans till produktionsökning utanför OPEC under 2014 med +1.6 mb/d. Samtidigt leder 100 dollar per fat till en svag konsumtionsökning på bara 0.9 mb/d under 2014, dvs OPEC:s del av kakan krymper med 0.7 mb/d under året.

100 dollar per fat är alltså för högt i år, enligt OPEC. OPEC kan dra ner produktionen för att upprätthålla 100 dollar per fat. Saudiarabien sänkte också helt följdriktigt produktionen med 400 kb/d i augusti. Detta skedde också samtidigt som Libyen kom tillbaka som producent med 7-800 kb/d i produktionstakt.

Så vad kommer OPEC att göra framöver? Saudiarabien kommer knappast att vilja ta på sig hela ransoneringsjobbet. De andra måste också komma in på banan. Ska man komma till förhandlingsbordet är det bäst att komma med så upp-pumpad produktion som möljigt, en hög nivå att förhandla ner ifrån. Således är det ogynnsamt även för Saudiarabien att dra ner allt för mycket.

Vid en svag global efterfrågesituation ska oljepriset vara 80 dollar per fat för att dämpa produktionstillväxten utanför OPEC. Denna sanning förändras dock snabbt, eftersom ”frackingtekniken” förbättras i så snabb takt, och för att stimulera global tillväxt i efterfrågan.

Om efterfrågan är stark ska priset vara 100 dollar per fat.

MENA-risken är fortsatt väldigt hög vad gäller utbudssidan. Libyens oljeproduktion kan försvinna med kort varsel lika fort som den tillkommit.

Raffinaderierna håller just nu på att ställa om till vinterproduktion och de kommer tillbaka till full kapacitet under den andra halvan av oktober. Då kan oljemarknaden stramas upp igen.

Irans premiärminister Rouhani måste få avtalet om kärnvapen/kärnkraft i hamn innan årets slut. Efter det kan det bli politiskt svårt att köra processen vidare.

Brent crude är nu på 98.7 dollar par fat, alltså bara 1.3 dollar under 100 dollar, som är den tydligt önskade nivån för OPEC. Strukturen i marknaden är emellertid markant annorlunda än den vi sett det senaste året. Det råder produktionsöverskott i marknaden och den är i starkt contango i början av terminskurvan. Notera också att priset har fallit samtidigt som dollarn har stärkts. Dollarförstärkningen motsvarar ett prisfall på 5 dollar per fat.

Det kom också en ny IEA-rapport i veckan. Den karaktäriserades av svag tillväxt i oljeefterfrågan. Svagheten är störst i EU och i Kina. Ökningen i efterfrågan under det andra kvartalet i år stannade på bara 0.5 mb/d mätt på årsbasis!

Samtidigt var non-OPEC-supply growth +1.6 mb/d. OPEC:s kaka krymper.

Detta beror på den tekniska revolution som fracking innebär, som har ersatt den gamla utbudskurvan med en helt ny. Lägg därtill att USA.s energipolitik med välvilja ser på när frackingtekniken ökar inhemsk produktion och sänker beroendet av MENA och OPEC. Med ett oberoende vad gäller olja slipper USA rycka ut för att stabilisera den kroniskt instabila MENA-regionen. Värdet av att slippa kostnaderna för att agera global polismakt är naturligtvis mycket, mycket stort. Väldigt många globala bråkmakare får sin finansiering från ett högt oljepris och fracking är det bästa, och ändå fredliga vapnet mot dessa. Det finns alltså även en säkerhetspolitisk anledning till att via fracking, ta knäcken på det höga oljepriset.

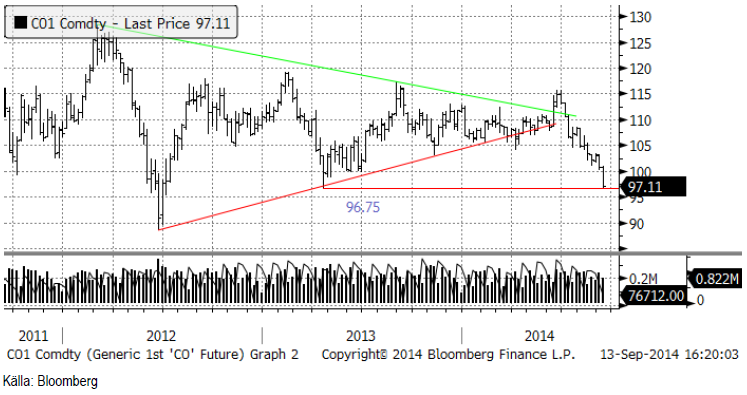
Nedan ser vi oljepriset i ett vecko-chart. Priset är nästan nere på 96.75, som är ett tekniskt stöd från botten under våren förra året. Under det stödet finns nästa stöd vid 90 dollar per fat.

Oljepris

Råoljelagren i USA sjönk 1 mbbl till 358.6 mbbl.

Råoljelagren i USA

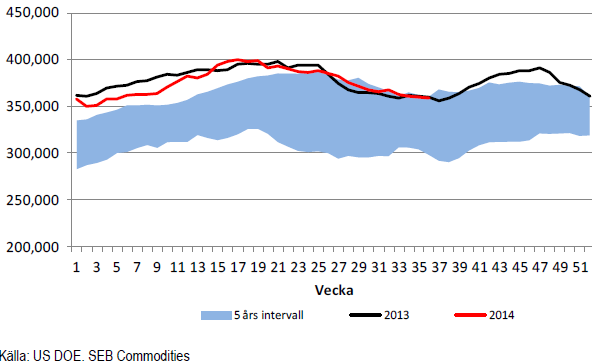
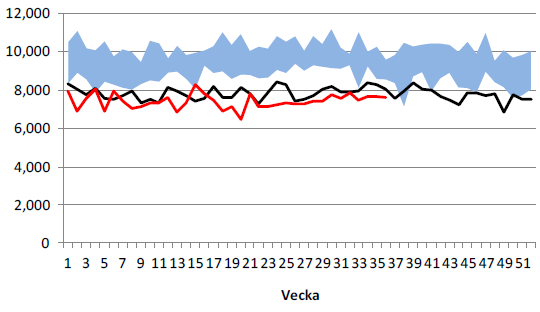
Importen av olja minskade marginellt i veckan till 7.621 miljoner fat.

Import av olja - USA

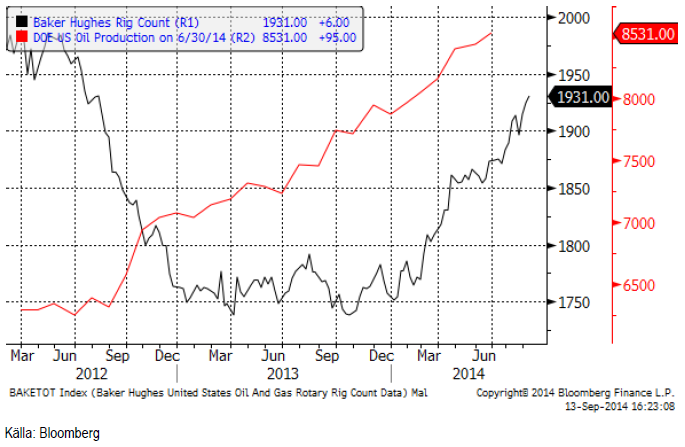
Nedan ser vi ett diagram på antalet oljeriggar i USA, enligt Baker Hughes statistik (svart) och USA:s oljeproduktion enligt US DOE på 8.357 mbpd. Antalet borr-riggar steg i veckan från 1925 till 1931.

Oljeriggar i USA

Vi rekommenderar alltså på kort sikt en försiktig kortposition t ex med BEAR OLJA X2 S.

Elektricitet

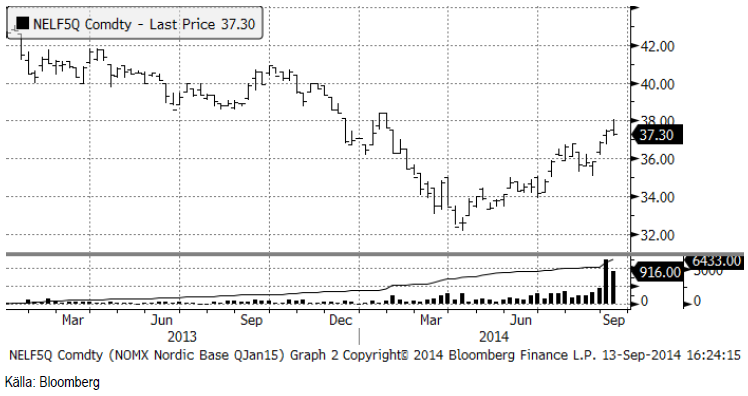
Certifikaten har nu bytt till att följa det första kvartalets kontrakt för år 2015. I veckochartet nedan ser vi att priset på det backade under förra veckan. Uppgången bromsas av att det finns ett tekniskt motstånd precis ovanför vid ca 38.5 euro per MWh.

Marknaden handlar nu lite sidledes, men vi tror det är större sannolikhet för en fortsatt prisuppgång, än att priset ska gå ner.

Elpris

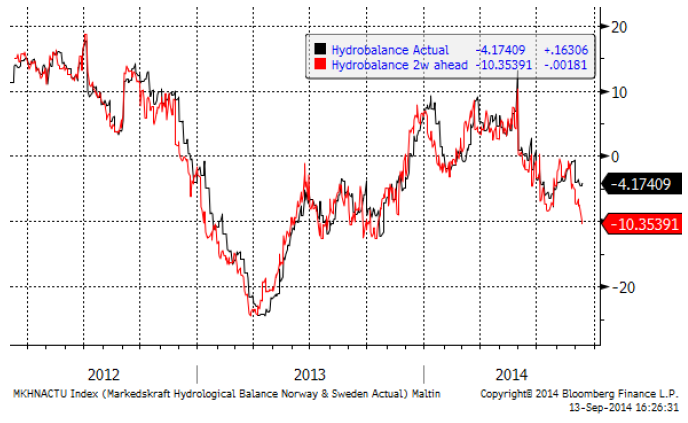
Hydrologisk balans har enligt 2-veckors prognosen försvagats. Från förra veckans underskott på -7.6 TWh har den sjunkit till ett underskott på 10.4 TWh.

Hydrologisk balans

Vi rekommenderar köp av EL S om priset kommer ner lite.

Naturgas

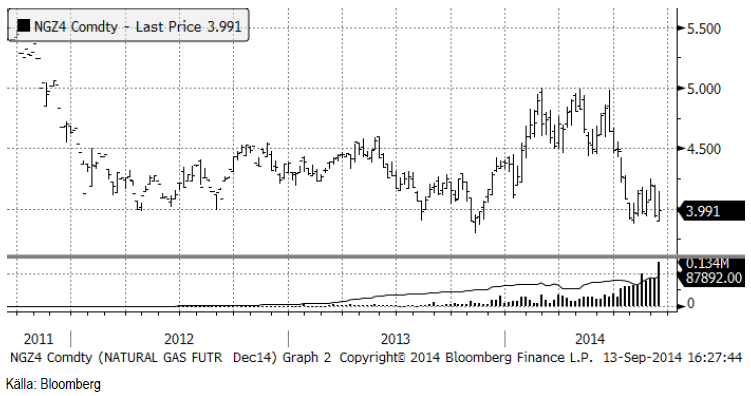
Naturgaspriset (decemberkontraktet) var ganska volatilt i veckan, men stängde bara marginellt över förra veckans stängningspris. Priset står och väger, men vi tror att det mest sannolika trots allt är att priset lämnar de senaste veckornas konsolideringsfas och sjunker ner mot 3.50. Vi håller fast vid vår investering i BEAR NATGAS X4 S.
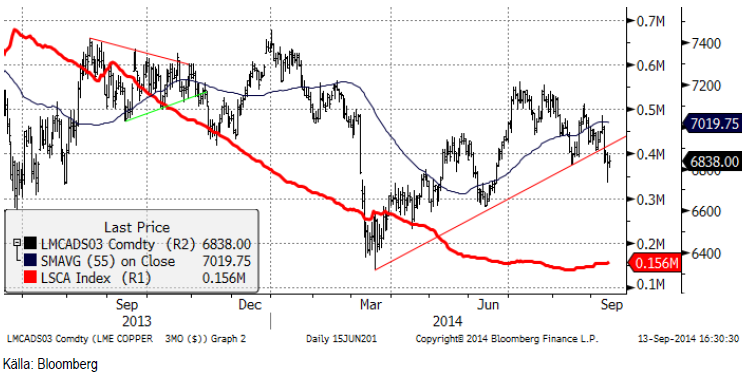
Naturgaspris

Koppar

Den stigande pristrenden är bruten. Koppar är den udda medlemmen av LME-familjen. Vi är inte särskilt positiva, snarare något negativa i vår vy av prisutvecklingen framöver. Vi tror att prisutvecklingen det närmaste året blir mer eller mindre ”sideways”.

Ryssland tar bort sin exportskatt på 10% på koppar. Detta är inte någon nyhet, men i dagens sanktionsfixerade omvärld, kan det vara en viktig faktor. Det ger Ryska producenter ett incitament att exportera katoder till EU.

Importen till Kina visar en årsvis förändring på -12%. Det förklaras delvis av Qingdao-skandalen tidigare i år. Det är emellertid inte något som marknaden tycker om att se, eftersom Kina är så central för kopparmarknadens efterfrågan. Dessutom kom Grasberggruvans (Freeport McMoRan). koncentratexport igång igen i juli. Kopparmarknadens fundamentala balans försämras alltså från två håll.

Vi rekommenderar neutral position i koppar.
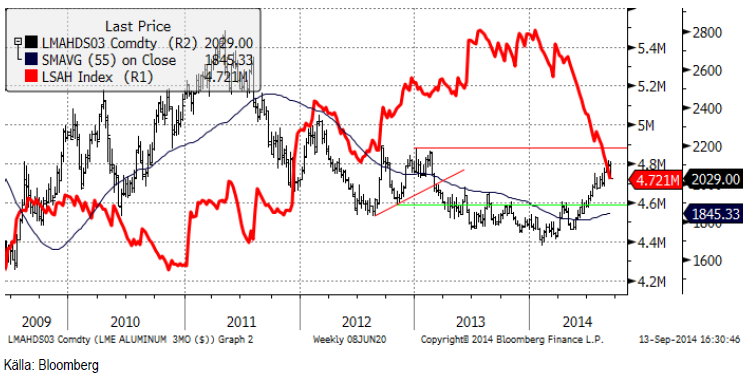
Kopparpris

Aluminium

Vi tror att aluminiummarknaden kommer att röra sig ”sidledes” ett tag. Den branta uppåtgående pristrenden är bruten. Vi tycker att det är rimligt att det sker eftersom marknaden har varit något ”överhettad”. Den mest troliga utvecklingen är att priset nu fluktuerar inom intervallet 2000 – 2150 dollar. Det finns en möjlighet att utbudet ökar som svar på de lite högre priserna och det begränsar uppsidan. Å andra sidan är efterfrågan på aluminium relativt stark och borde bli ännu starkare när vi kommer in i det fjärde kvartalet, så nersidan borde vara begränsad i priset. Taktiskt, talar det för en strategi där man försöker köpa på nedgångar (mot 2000 dollar) och sälja på uppgångar (mot 2150).

Vi fortsätter alltså med köprekommendation på ALUMINIUM S.
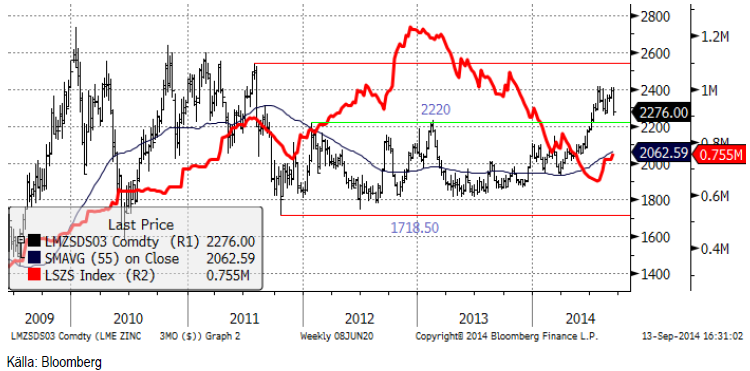
Aluminiumpris

Zink

Zinkmarknaden är tillbaka på ruta ett. Zinkmarknaden har varit i en positiv pristrend sedan förra året. Detta är fundamentalt motiverat av successivt förbättrad balans. Den bästa källan och där detta syns tydligast finner man i the International Lead and Zinc Study Groups (ILZSG) rapporter. Vår rekommendation att öka på köpta positioner i zink vid rekylen nedåt i augusti till 2250 dollar visade sig rätt. Därifrån gick marknaden hela vägen upp till 2400 dollar på kort tid. Men på bara en vecka föll priset hela vägen tillbaka ner igen! Rapporter från marknaden antyder att många producenter tog tillfället i akt att prissäkra på de attraktiva höga nivåerna.

Tekniskt vände priset ner från tidigare motståndsnivåer. Det var inte konstigt att prisuppgången skulle stöta på patrull där. Rekylen nedåt inträffade samtidigt som andra marknader utvecklades svagt. Basmetaller, ädelmetaller, olja och hela jordbruksproduktsegmentet utvecklades svagt i veckan och det är inte bara en stark dollar som ligger bakom. Även om rekylen i zink kan vara oroväckande, anser vi att zinkmarknadens fundamentala situation med gradvis förbättring, gör zink till en av de mer köpvärda råvarorna och vi tycker att metallen är köpvärd på de här nuvarande nivåerna.

Vi rekommenderar köp av ZINK S.
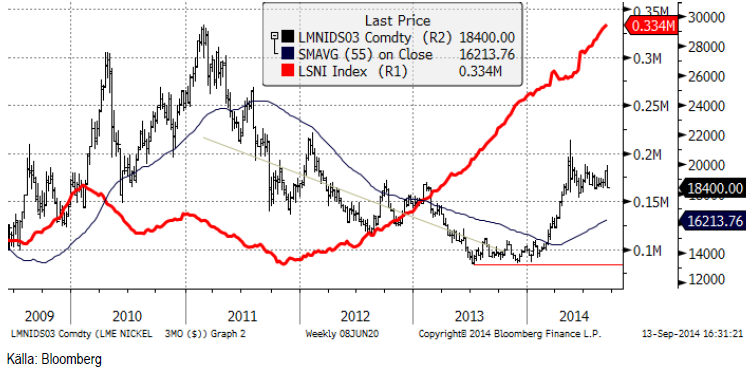
Zinkpris

Nickel

Vi skrev för en vecka sedan att vi tyckte att haussen upp mot 20,000 dollar var lite för tidig. Veckans högsta pris på 19,940 dollar per ton noterades direkt på morgonen i måndags. Marknaden orkade inte ta sig över motståndet från förra toppen, utan vände därefter direkt nedåt. Veckans lägsta pris noterades under asiatisk handel på fredag morgon, på 18320 dollar. Så marknaden är tillbaka på ruta ett. Priset är nere på samma nivå som förra rekylen nedåt bottnade ut på.

Reuters rapporterar att en Filippinsk politiker propagerar för att ett eventuellt exportförbud av malm från landet ska skjutas upp i fem år, för att ge industrin en möjlighet att bygga upp smältverkskapacitet inom landet. Så inget har egentligen förändrats. Det viktiga för nickelmarknaden är hur situationen i Indonesien förändras. Det mesta tyder på en gradvis förbättring i de fundamentala balanserna (mindre utbud, större efterfrågan). Som vi har påpekat förut, det är avgörande att detta också börjar visa sig i den viktigaste indikatorn av alla, i LME-lagret. För närvarande går det att med lite god vilja skönja en utplaning i lagerutvecklingen, men knappast någon klar trendförändring än.

Nickelpris

Guld

Priset på guld, som bröt den tekniska triangelformationen för ett par veckor sedan, har fortsatt att rasa i pris. Vi rekommenderar såld position av guld i dollartermer.

Teknisk analys av guldpris

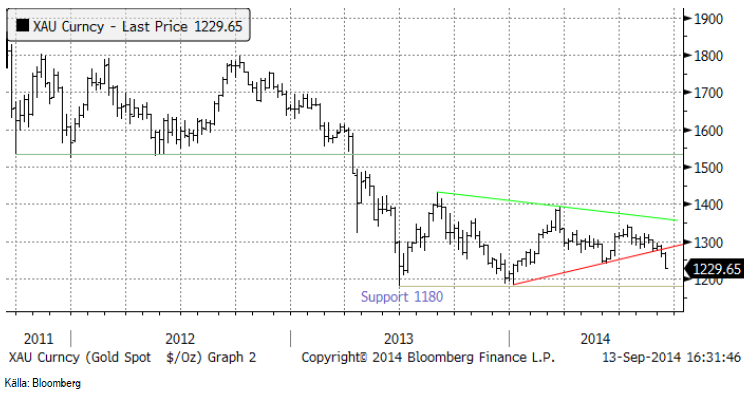
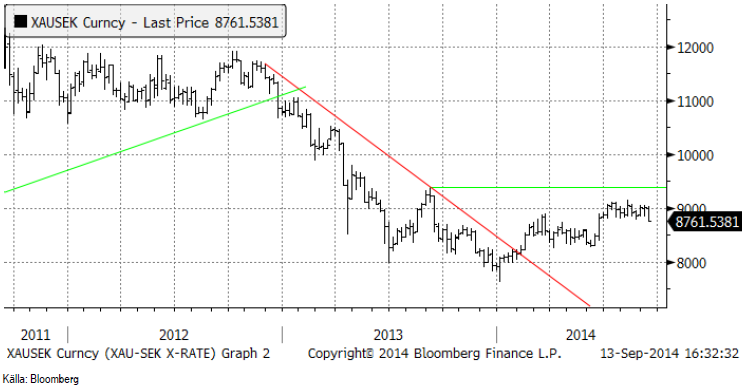
Chartet för guld i kronor (och i euro med för den delen) ser närmast ut som en omvänd head-and-shouldersformation, som alltså indikerar att stigande pris kan vara förestående. Vad detta kanske egentligen säger är att USD/SEK och USD/EUR kan vara köpvärd.

Chartet för guld i kronor

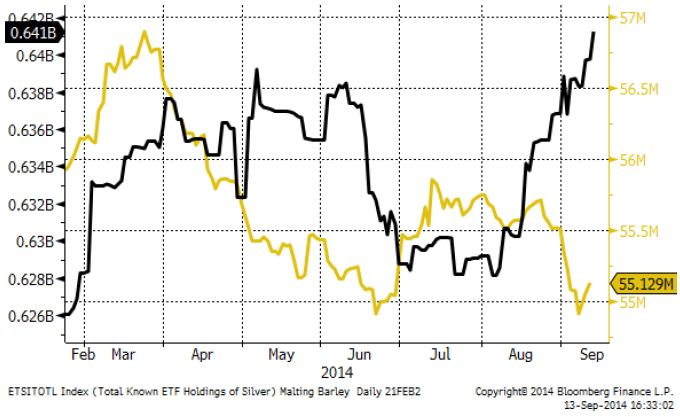
Det har fortsatt att vara inflöden i silver som investering. Även guld fick en släng av sleven i veckan som gick.

ETF holdings

Vi rekommenderar sälj av guld i dollartermer. Eftersom GULD S är en investering i guld i kron-termer väljer vi att stanna vid neutral vy. Den som vill kanske kan köpa en BEAR GULD X4 S, som till största delen har en kort position i guld i dollartermer. Den är dock också köpt med hävstång 1 USD/SEK.
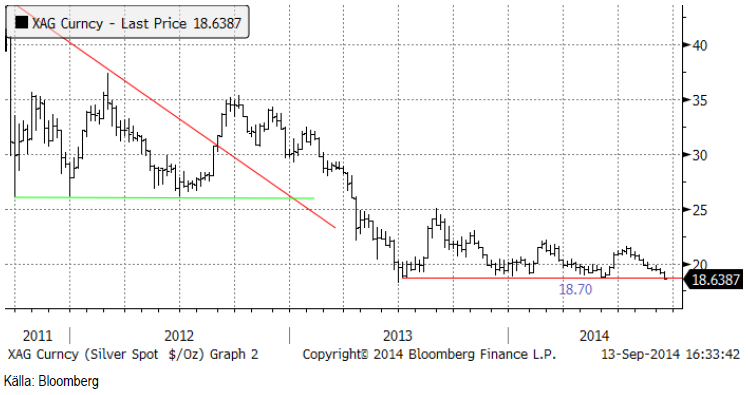
Silver

Silverpriset, i dollartermer, har brutit det tekniska stödet på 18.70 dollar per uns. Silverpriset stängde på 18.64 dollar i fredags. Vi har tidigare skrivit att stop-loss-nivån ligger vid ca 18.50. Det ser just nu inte särskilt ljust ut.

Silverpris

Silver är dock fortfarande ”billigt” i jämförelse med guld.

XAUXAG

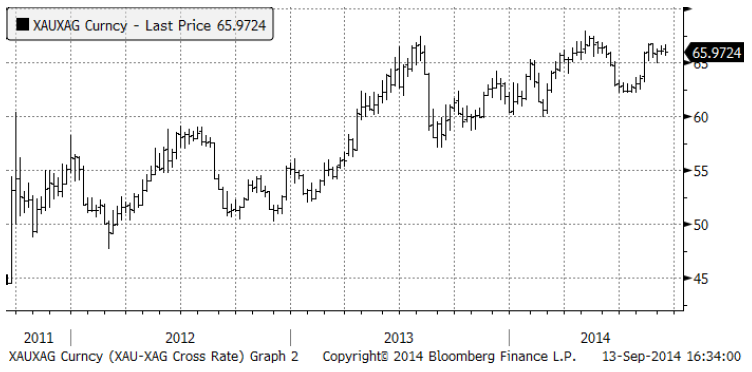
Vi rekommenderar fortfarande köp av silver, men stop-loss bör tas vid 18.50.

Platina & Palladium

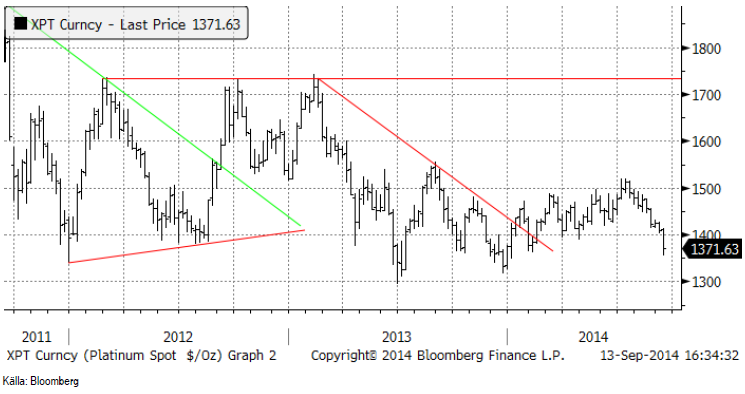
Platinapriset passerade 1400 dollar och föll kraftigt i veckan som gick. Nästa stödnivå är 1300.

Platina pris

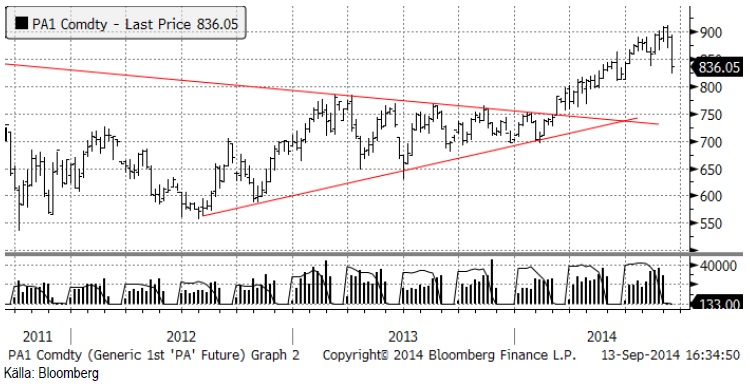
Palladium som förra veckan föll under 900 dollar, föll betydligt mycket mer i veckan som gick, ända ner till 836 dollar. Tekniskt stöd finns strax under den kursen.

Palladium pris

Nedanför ser vi hur mycket metall som finns i börshandlade fonder för platina respektive palladium. Det har varit små utflöden i båda metallerna.

Platina och palladium i ETF-fonder

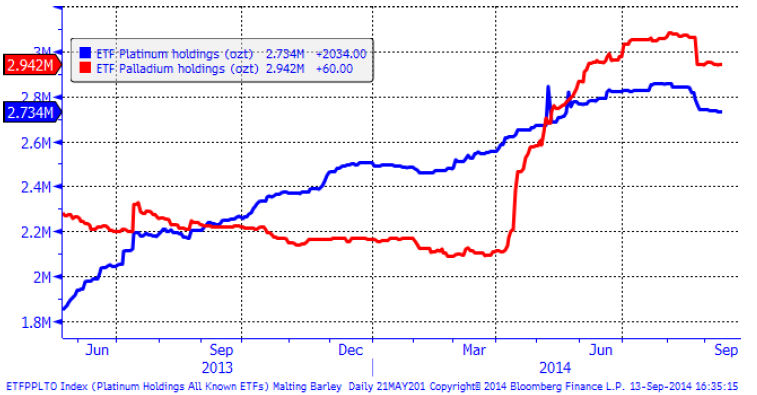
Vi fortsätter med neutrala vy på platina men rekommenderar en köpt position i palladium, helst om man kan köpa på en rekyl nära 800 dollar.
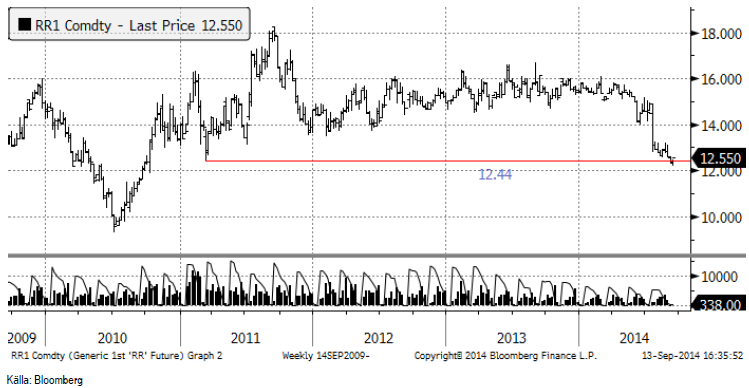
Ris

Priset på ris ligger kvar strax över det tekniska stödet på 12.44 dollar.

Pris på ris

WASDE sänkte global produktion och det gjorde även FAO / AMIS.

Risproduktion i världen

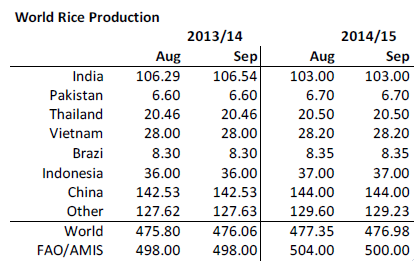
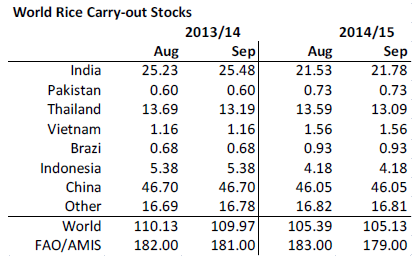
Utgående lager sänktes lika mycket. Både USDA och FAO sänker utgående lager lika mycket som produktionen minskar.

Carry out stocks av ris i världen

Vi fortsätter med neutral rekommendation.
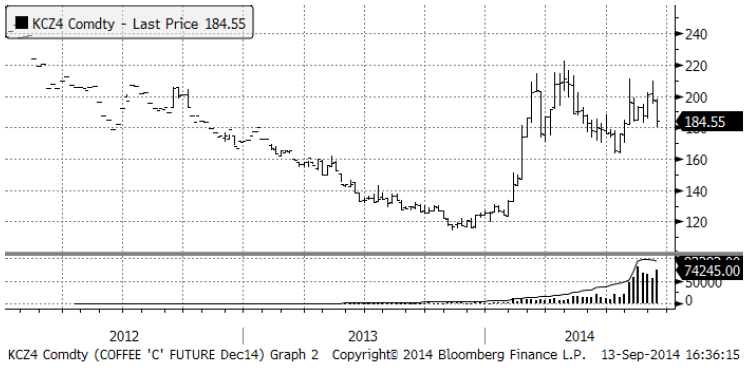
Kaffe

Regn över Minas Gerais gav prisfall på kaffet. 180 cent är ett visst tekniskt stöd. Vi ser väl inte någon trigger åt något håll. Sidledes rörelse tror vi kommer att fortsätta.

Kaffepris C

Vi rekommenderar neutral position i kaffe.
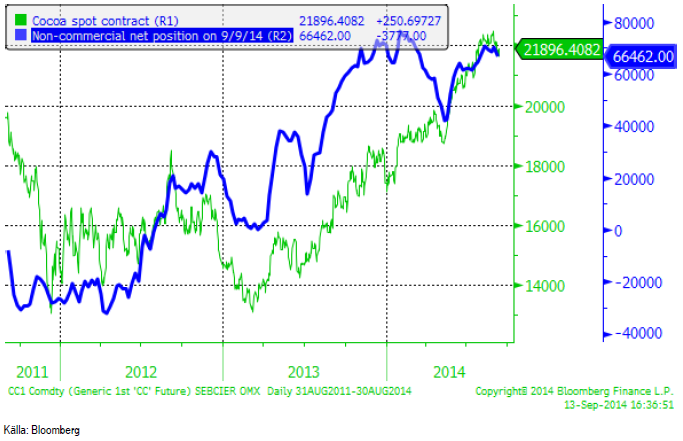
Kakao

Kakao har brutit uppgången och det är nu läge att ligga kort, t ex via ”SHORT KAKAO A S”.

Kakaopris

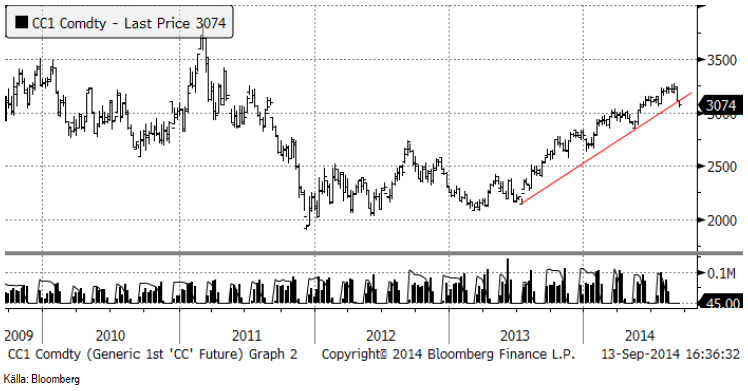
Spekulativ position ligger väldigt högt, historiskt sett. Det kan bli ”trångt i dörren” om trenden vänder nedåt.

Kakao


För analyser av fler jordbruksråvaror se SEBs jordbruksanalysbrev.

[box]SEB Veckobrev Veckans råvarukommentar är producerat av SEB Merchant Banking och publiceras i samarbete och med tillstånd på Råvarumarknaden.se[/box]

Disclaimer

The information in this document has been compiled by SEB Merchant Banking, a division within Skandinaviska Enskilda Banken AB (publ) (“SEB”).

Opinions contained in this report represent the bank’s present opinion only and are subject to change without notice. All information contained in this report has been compiled in good faith from sources believed to be reliable. However, no representation or warranty, expressed or implied, is made with respect to the completeness or accuracy of its contents and the information is not to be relied upon as authoritative. Anyone considering taking actions based upon the content of this document is urged to base his or her investment decisions upon such investigations as he or she deems necessary. This document is being provided as information only, and no specific actions are being solicited as a result of it; to the extent permitted by law, no liability whatsoever is accepted for any direct or consequential loss arising from use of this document or its contents.

About SEB

SEB is a public company incorporated in Stockholm, Sweden, with limited liability. It is a participant at major Nordic and other European Regulated Markets and Multilateral Trading Facilities (as well as some non-European equivalent markets) for trading in financial instruments, such as markets operated by NASDAQ OMX, NYSE Euronext, London Stock Exchange, Deutsche Börse, Swiss Exchanges, Turquoise and Chi-X. SEB is authorized and regulated by Finansinspektionen in Sweden; it is authorized and subject to limited regulation by the Financial Services Authority for the conduct of designated investment business in the UK, and is subject to the provisions of relevant regulators in all other jurisdictions where SEB conducts operations. SEB Merchant Banking. All rights reserved.

Fortsätt läsa
Annons
Klicka för att kommentera

Skriv ett svar

Din e-postadress kommer inte publiceras. Obligatoriska fält är märkta *

Analys

US inventories will likely rise less than normal in mths ahead and that is bullish

Publicerat

den

SEB - analysbrev på råvaror

US commercial crude and product stocks will now most likely start to rise on a weekly basis and not really start to decline again before in week 38. We do however expect US inventories to rise less than normal in reflection of a global oil market in a slight deficit. This will likely hand support to the Brent crude oil price going forward.

Bjarne Schieldrop, Chief analyst commodities at SEB
Bjarne Schieldrop, Chief analyst commodities, SEB

Shedding some value along with bearish metals and China/HK equity losses. Brent crude has trailed lower since it jumped to an intraday high of USD 87.7/b on 19. March spurred by Ukrainian drone attacks on Russian refineries. Ydy if fell back 0.6% and today it is pulling back another 1% to USD 85.4/b. But the decline today is accompanied by declines in industrial metals together with a 1.3% decline in Chinese and Hong Kong equities. Thus more broad based forces are helping to pull the oil price lower.

US API indicated a 5.4 m b rise in US oil stocks last week. But rising stocks are normal now onwards. The US API ydy indicated that US crude stocks rose 9.3 m b last week while gasoline stocks declined 4.4 m b while distillates rose 0.5 m b. I.e. a total rise in crude and products of 5.4 m b (actual EIA data today at 15:30 CET). That may have helped to push Brent crude lower this morning. It is however very important to be aware that US inventories seasonally tend to rise from week 12 to week 38. And from week 12 to 24 the average weekly rise is 4.1 m b per week. The increase indicated by the US API ydy is thus not at all way out of line with what is normally taking place in the months to come. What really matters is how US commercial inventories do versus what is normal at the time of year.

US commercial stocks have fallen 17 m b more than normal since end of 2023. So far this year we have seen a draw of  39 m b vs the last week of 2023. The normal draw over this period is only -22 m b. I.e. US commercial inventories have drawn down 17 m b more than normal over this period. This has been the gradual, bullish nudge on oil prices. US commercial stocks should normally rise 63.5 m b from week 12 to week 38. What matters to oil prices is thus whether US inventories rise more or less than that over this period.

Drone attacks on Russian refineries was a catalyst to release Brent to higher levels. Brent crude broke out to the upside on 13 March along with the Ukrainian drone attacks on Russian refineries. Some 800 k b/d of refining capacity was hurt and probably went off line. But in the global scheme of things this is a mere 1% or so of total global refining capacity. And if we assume that it is off line for say 3 months, then it equates to maybe 0.25% impact on global refining activity in 2024 which is easy to adapt to. Refining margins have not moved  much at all. ARA spot diesel cracks are now USD 2.25/b lower than it was in 12 March 2024. Thus no crisis for refined products at all.

We’ll probably not return to pre-drone attack price level of USD 82/b any time soon. Though a dip to that price level is of course not at all out of the question. The oil market may send the oil price lower in the short term since very little material impact in the global scope of things seems to follow from the drone attacks on Russian refineries. Our view is however that the attacks were more like a catalyst to release the oil price to the upside following a steady and stronger than normal decline in US commercial inventories. I.e. the latest price gains in our view is not so much about an added risk premium in the oil price but more about oil price finally adjusting higher according to the fundamentals which have played out since the start of the year with stronger than normal declines in US commercial inventories. We thus see no immediate return to pre-drone-attack price level of USD 82/b. Rather we expect to see continued support to the upside through steady, gradual inventory erosion versus normal like we have seen so far this year.

Voluntary cuts by Russia in Q2-24 could be bullish if delivered as promised. Earlier in March we saw Russia’n willingness to cut back supply in Q2-24 in a mix of production restraints and export restraints. Saudi Arabia and Russia are equal partners in OPEC+ with equal magnitudes of production. In a reflection of this they set equal baselines in May 2020 of 11.0 m b/d. Saudi Arabia produced 9.0 m b/d in February while Russia produced 9.4 m b/d. This is probably why Russia in early March stated that they were willing to cut back in Q2-24. To align more with what Saudi Arabia is producing. It has been of huge importance that Saudi Arabia last year cut its production down to 9.0 m b/d and thus below Russian production. This reactivated Russia as a dynamic, proactive participant in OPEC+. The actual effect of proclaimed production/export cuts by Russia in Q2-24 remains to be seen, but calls for USD 100/b as a consequence of such cuts have surfaced.

So far we haven’t lost a single drop of oil due to Houthie attacks in the Red Sea. We have lost some up-time in Russia refining due to Ukrainian drone strikes lately. But nothing more than can be compensated elsewhere in the world. Temporarily reduced volumes of refined hydrocarbons from Russian will instead lead to higher exports of unrefined molecules (crude oil).

For now OPEC+ is comfortably controlling the oil market and the market will likely be running a slight deficit as a result with inventories getting a continued gradual widening, negative difference versus normal levels thus nudging the oil price yet higher. SEB’s forecast for Brent crude average 2024 is USD 85/b. This means that we’ll likely see both USD 90/b and maybe also USD 100/b some times during the year. But do make sure to evaluate changes in US oil inventories versus what is normal at the time of year. Rising inventories are bullish if they rise less than what is normal from now to week 38.

US commercial crude and product stocks will likely rise going forward. But since the global oil market is likely going to be in slight deficit we’ll likely see slower than normal rise in US inventories with an increasing negative difference to normal inventory levels.

US commercial crude and product stocks
Source: SEB calculations and graph, Blbrg data feed, EIA data

Total US crude and product stocks incl. SPR are now 4 m b below the low-point from December 2022

Total US crude and product stocks incl. SPR
Source: SEB graph and calculations, Blbrg data feed, EIA data
Fortsätt läsa

Analys

From surge to slump for natural gas: Navigating the new normal in Europe

Publicerat

den

SEB - analysbrev på råvaror

Over the past 4-5 months, EU natural gas prices, indicated by the TTF benchmark, have plummeted by 50% from an October high of EUR 56/MWh to the current EUR 28/MWh for the front-month contract, defying expectations of seasonal price increases. This downturn can be attributed to robust EU inventories at 59% capacity and persistently subdued natural gas demand, down by 11% compared to historical norms. Mild weather in Northwest Europe and a prolonged industrial recession have suppressed consumption, resulting in a significant gas surplus despite nearing the end of the winter heating season (90% complete). These factors collectively exert downward pressure on prices.

Ole R. Hvalbye, Analyst Commodities, SEB

The correlation between Brent and TTF prices remains from times partly “fluid”. In our December 2023 natural gas price update, we predicted a constrained global natural gas market, anticipating a swift resurgence in demand following a decline in gas prices. Our projections were underpinned by a robust Brent Crude price outlook, set at USD 85/bl, USD 87.5/bl, and USD 90/bl for 2024, 2025, and 2026 respectively, with a Crude-to-gas rate of 80%. However, this scenario has yet to materialize as the anticipated demand recovery has been notably delayed, requiring even lower prices than initially predicted for its realization—a phenomenon unique in recent memory.

Achieving a global natural gas price convergence towards levels more aligned with Brent Crude appears plausible, signaling a return to a measure of normalcy. The absence of a winter premium during the 2023/24 winter season suggests a healthier outlook for Q2-24, mitigating the risk of substantial short-term price spikes in European gas markets. The sporadic spikes witnessed in 2022 and partially in 2023 are now a thing of the past, indicating a change from the volatility experienced in recent years.

Short-term EU gas prices hinge heavily on immediate weather patterns and industrial gas demand, both exerting considerable influence on inventory levels, which serve as a critical gauge of supply and demand dynamics. Looking further ahead, the trajectory of prices is linked with the global LNG balance, particularly contingent upon factors such as projected US natural gas production and the capacity of US LNG exports to the global market.

Moreover, the declining influence of Russia on the European gas market is notable, with sporadic gas export halts from the former energy powerhouse carrying reduced impact. Global market recalibrations indicate a sustained elevation in price levels, with EUR 30/MWh emerging as a feasible benchmark for the foreseeable future. We also call “the end of the energy crisis”, as the worst is history. Reflecting on the current year, EU TTF prices hit the lowest point in late February, with expectations of a potential slide/climb from current prices at EUR 28/MWh.

In essence, our current natural gas price forecast hinges on a delicate equilibrium among three pivotal factors. Firstly, the TTF price must strike a balance, remaining sufficiently low to stimulate a resurgence in demand. For context, the historical average real price hovers around EUR 27/MWh, with EUR 30/MWh anticipated to gradually encourage demand recovery, thereby mitigating the effects of demand destruction. Secondly, the TTF price should maintain a relatively ”normal” relationship with Crude prices, as historical trends indicate a natural correlation between the two. A notably low rate would invariably attract heightened interest from Asian markets, as LNG emerges as a cost-effective alternative to oil in terms of energy content. Lastly, the TTF price must also exhibit a level of elevation to cover the expenses associated with producing and transporting US natural gas to the European market. This entails factoring in costs related to Henry Hub, tolling fees, liquefaction, transportation, and regasification, among other associated expenses. Achieving a delicate equilibrium among these factors is vital for ensuring the stability and sustainability of natural gas pricing dynamics in the European market.

Consequently, our current stance reflects a delicate balancing act among these three critical factors. Settling on EUR 30/MWh, we predict that prices lower than this threshold would catalyze a swifter demand resurgence, while simultaneously enhancing the appeal of natural gas against oil as the spread widens. Moreover, importation from the USA would encounter mounting challenges as prices decline, particularly approaching the EUR 25/MWh mark when landed in ARA.

The TTF market has been complexly interlinked with the global LNG market at the margins since 2015, many years before the energy crisis. While the proportion of LNG consumed in Europe has surged significantly, the concept of LNG prices influencing TTF prices at the margin is not new. However, in terms of volume, the current situation declares us notably more vulnerable than in previous years.

In our updated projections, we have revised our price forecasts downward, particularly notable at the front end, encompassing Q2-24, Q3-24, and the Full-year (FY) 2024. Other adjustments, though marginally smaller, remain for FY 2025, 2026, and 2027. Despite these reductions, we anticipate a trajectory of increasing European natural gas prices from their current levels. Notably, Q1-24 is now expected to average EUR 27/MWh, followed by predictions of EUR 25/MWh, EUR 28/MWh, and EUR 32/MWh for Q2-24, Q3-24, and Q4-24 respectively. Consequently, the average for FY 2024 is forecasted at EUR 28/MWh, marking a notable decline from the previous estimate of EUR 40/MWh.

In our outlook for longer-term pricing, we anticipate an average of EUR 30/MWh for the years 2025, 2026, and 2027—a reduction of EUR 10/MWh compared to our previous update in December 2023, which projected EUR 40/MWh. This long-term forecast only sits marginally higher, by EUR 3-4/MWh, than the historical average real price of approximately EUR 27/MWh. Such pricing aligns intending to stimulate further demand recovery and maintain consumer affordability within the European economy. Reflecting on historical trends, previous price levels in the European market might be seen as reliant on potentially risky agreements with Russia. Consequently, the era of exceptionally low-cost energy is drawing to a close, indicating a new paradigm where European gas and power are priced slightly higher, establishing a ”new normal” for the foreseeable future.

TTF spot prices

PRICE ACTION

The absence of a winter premium for global natural gas is notable. Our longer-term natural gas price projection, set at EUR 30/MWh, demonstrates resilience compared to historical market norms. Last quarter (Q4-23) closed at EUR 43/MWh for the front-month contract, a figure approximately EUR 10/MWh lower than our recent expectations. Noteworthy market adjustments have transpired not only within the European gas market but also on a global scale. This ongoing adaptation is expected to continue influencing the gas market into 2024, resulting in fewer severe price spikes and a return to more normal price differentials.

Global natural gas prices, EUR/MWh

Maintaining our gas price forecast at EUR 30/MWh for 2025 suggests an expectation for European natural gas prices to stabilize at current market rates. This projection extends to 2026 and 2027, which stand roughly 30% higher than historical norms – a contrast to the previous era of favorable deals with Russia flooding European consumers with low-cost piped natural gas.

Considerable attention is drawn to the relationship between gas and oil prices. With our oil market outlook projecting USD 85/bl, USD 87.5/bl, and USD 90/bl for 2024, 2025, and 2026 respectively, the convergence of gas prices to more normal circumstances implies a corresponding alignment with oil prices. Historically, EU natural gas prices have traded at 0.55-0.6 times Brent crude prices, a figure that is expected to converge closer to historical norms. However, our forecasts for 2024, 2025, and 2026 slightly exceed historical norms, at 0.62 x Brent, 0.65 x Brent, and 0.62 x Brent respectively, reflecting a tighter natural gas balance in the coming years.

The transformation of global LNG trade, from roughly 5% spot and short-term LNG trade in 2000 to roughly 30% in 2023, underscores a higher degree of flexibility in negotiating spot and short-term LNG contracts. This evolution suggests a shift towards contracts potentially decoupled from Brent indexations, challenging the conventional reliance on oil prices as a benchmarking tool for global natural gas prices.


US LNG

A significant surge in global liquefaction (export) capacity is anticipated from the US and Qatar starting in 2026 and beyond. These large-scale liquefaction projects typically entail long-term contracts with predefined off-takers or demand centers, primarily serving power plants or industrial applications. The transportation of substantial LNG volumes from the US to Europe underscores strategic economic and energy considerations. The US, propelled by abundant shale gas resources and extensive LNG liquefaction infrastructure, has emerged as a major LNG exporter. Europe, seeking to diversify energy sources and reduce dependence on Russia, offers an attractive market for American LNG. Additionally, LNG’s flexibility as a cleaner-burning fuel aligns with Europe’s environmental sustainability objectives and transition away from coal.

The transatlantic LNG trade between the US and Europe capitalizes on arbitrage opportunities driven by regional gas price variations and demand-supply imbalances. This flow not only enhances energy security for European nations but also aids NE Asia in meeting environmental obligations.

The US-Europe netback for LNG cargo depends on various economic factors, including global natural gas prices, US regional supply and demand dynamics, and fluctuations in shipping costs.

The competitiveness of US LNG in the European market is influenced by several factors, including the US benchmark price for domestic natural gas (Henry Hub), source gas costs, voyage costs, shipping costs, and regasification costs at the destination.

In more detail the competitiveness of US LNG in the European market is influenced by factors such as the US benchmark price for domestic natural gas (Henry Hub); Source gas cost (Henry Hub + Tolling fee and liquefaction fee); voyage cost (Insurance, port, canal, boil-off, and fuel cost); shipping cost at day rate; and regasification cost in the other end.

A simplified calculation demonstrates the US-EU arbitrage opportunity. At current market figures, the total cost of delivering LNG from the US to Europe is roughly USD 7.05/MMBtu or approximately EUR 22/MWh. Comparatively, the EU TTF front-month contract trades at EUR 28/MWh, indicating an average EUR 6/MWh arbitrage opportunity and an equal profit margin for traders. However, with state-of-the-art LNG vessels, the total cost could decrease significantly, resulting in a substantial profit margin for traders.

The calculation (with current market figures all in USD per MMBtu as a standard unit):
Front-month Henry Hub (1.65) + 15% tolling fee (0.25) and liquefaction fee for conventional LNG ships (2.5) + Insurance, port, and canal (on average 0.33) + boil-off and fuel cost (on average 1.2) + regasification (0.5) + shipping cost at current day rate (0.62).

i.e., for total cost from the US to Europe we get 1.65 + 0.25 + 2.5 + 0.33 + 1.2 + 0.5 + 0.62 = USD 7.05/MMBtu – or roughly EUR 22/MWh. At the time of writing, the EU TTF front-month contract is trading at EUR 28/MWh. Hence, in the current spot market, the US-EU arbitrage is at roughly on average EUR 6/MWh and equally EUR 6/MWh profit to trader. However, this is a conservative estimate. In a situation with a state-of-the-art MEGI / X-DF LNG vessel, we would have a lower liquefaction fee and per unit insurance, boil-off, and fuel cost, which would imply a total cost of USD 6.0/MMBtu (EUR 18.5/MWh) – consequently, a massive EUR 9.5/MWh profit to the trader. Understating the massive economic argument in shipping LNG from the US to the EU (at current market rates).

But even though a substantial arrival of LNG export capacity in the US is approaching, it is not like the US has unlimited natural gas production, or unlimited LNG capacity to feed the global thirst for LNG. Hence, it is not like the EU TTF will plunge to levels comparable to the US Henry Hub + all associated costs for delivering to the EU.

A substantial surge in LNG export capacity is imminent, fueled by significant investments totaling USD 235 billion directed towards upcoming super-chilled fuel projects since 2019. The majority of these projects are slated to come online from the second half of 2025 onward, with an additional USD 55 billion investment expected by 2025, driving a remarkable 45% surge in LNG liquefaction capacity by the end of the decade.

Currently, the global LNG export market boasts a total capacity of approximately 420 million tonnes, projected to expand significantly to 610 million tonnes by 2030. The bulk of this expansion will stem from Qatar, Russia, and the US, with capacities increasing by roughly 23, 26, and 117 million tonnes respectively from 2024 to 2030.

However, it’s worth noting that on January 26, 2024, the Biden Administration paused LNG exports to non-FTA countries, awaiting updated analyses by the DOE. This affects 4 major projects and risks WTO challenges. The DOE cites outdated assessments, signaling a policy shift and raising market uncertainties.

This pause could have significant geopolitical and trade implications, as it also becomes an election issue. Stakeholders, including exporters and developers, now face uncertainties and must review agreements. Overall, the pause prompts a broader review of LNG export policies, impacting domestic and international markets. However, it’s too early to fully assess its impact, so the aforementioned capacity forecast remains firm for now.

The industry’s confidence is underpinned by the anticipation of rising LNG demand, driven by Europe’s efforts to reduce reliance on Russian gas and Asia’s shift away from coal, particularly in China. Yet, this expansion is not merely speculative; it represents a long-term commitment between suppliers and off-takers. These projects typically entail long-term contracts of 20+ years, often supplying power plants or industrial applications. Consequently, the new LNG export capacity is expected to match a similar scale of demand.

The significant export ventures from the United States to Qatar will further cement LNG’s role in the global energy landscape, with contracts extending well into the 2050s, even surpassing some carbon-neutral targets.

Moreover, there remains ample room for natural gas in the long run. The COP28 acknowledged that transitional fuels like LNG can facilitate the energy transition, signaling implicit support for LNG over dirtier fossil fuels.

Critics argue that natural gas isn’t the most environmentally friendly fossil fuel due to potential methane leakage along the supply chain. However, such concerns arise belatedly as the wave of new facilities is already underway. With oil demand reaching its peak and coal declining gradually, gas is expected to maintain its prominence in the energy mix.


SUPPLY & DEMAND

In the short term, the winter wildcard/premium is gone, pointing to a healthier Q2 2024. We have, a while back, pinpointed that the European natural gas market is in a limbo state between supply uncertainties and demand uncertainties. With a consequence of a winter wildcard largely being balanced by the short/medium-term weather and withdrawal rate of European natural gas inventories.

Recent weather forecasts predict slightly colder temperatures in early April across Northwest Europe, but the preceding winter months saw normal to milder conditions, resulting in lower-than-expected inventory drawdowns and weak price trends.

Looking ahead, forecasts for April to June 2024 suggest above-normal temperatures in Northwest Europe, reducing heating and power demand and maintaining subdued gas consumption. Prices in Q2-24 are forecasted to average around EUR 25/MWh.

Daily LNG imports - Europe

Furthermore, it is easy to think of the faded energy crisis as a European crisis. But the adaptation for global gas markets has been equally/more important. Very high global gas prices have resulted in adaption in all corners of the globe, consequently, easing the global natural gas balance and freeing more gas volumes to the highest bidder at more “reasonable” prices. During the peak of the crisis, the highest bidder was naturally Europe which was sucking up all excess global LNG volumes. However, at the current price levels, the “three importing giants”, namely China, South Korea, and Japan have finally woken up, and are no longer “re-routing” their LNG cargos, while also actively participating in the short-term/spot market.

Russia’s grip over the EU is expected to weaken in the spring/summer of 2024. Since February/March 2022, President Putin sought to balance revenue generation and geopolitical pressure by controlling the energy supply to the EU. This strategy faced challenges: reducing exports to zero would jeopardize revenue, while high exports would alleviate the EU’s energy crisis, as seen in winter 2022/23. Despite efforts, Putin’s goal of using natural gas as a strategic tool faltered in winter 2023/24.

Russia - Europe pipeline flow of natural gas

Market adaptation ensued. Since December 2022, Russian piped gas supply to Europe has fluctuated between 10-25% of historical averages, currently nearing 20%. To intensify geopolitical pressure, Russia may need to further reduce flows, possibly to around 10% in winter 2024/25. Despite the distant outlook, the market has already factored in potential price increases for next winter.

Two main pipelines deliver Russian gas to Europe: ”Turkstream,” to Turkey, and the ”Brotherhood,” through Ukraine to Slovakia. These pipelines each contribute roughly 50% of the 0.75 TWh per day flow. The pipeline via Ukraine faces physical risks, and a supply halt is likely next winter as the transit agreement between Gazprom and Naftogaz expires in December 2024, with little chance of renewal.


EU INVENTORIES

The trajectory of EU natural gas inventories for the upcoming summer is primarily influenced by both the global LNG market and European natural gas demand. In Q2-23 (one year ago), inventories commenced the injection season at an all-time high, leading to the current record-high inventory status. These comfortable inventories suggest the EU has the situation under control as it emerges from the winter season. Currently, inventories stand at 59%, a substantial 25% above the 2015-2022 average.

European natural gas inventories

Despite missing out on over 1,000 TWh of natural gas imports from Russia compared to historical levels, the mild winter of 2022/23, reduced demand due to high prices, and increased LNG imports compensated with an additional 1,400 TWh. This over-compensation of 400 TWh in Q1-23 facilitated an unprecedented injection rate into European inventories during Q1 and Q2 2023. As a result, European inventories shifted from a deficit of 180 TWh in January 2022 to a surplus of 259 TWh in April 2023, leading to the current record-high levels.

However, if NE Asia, predominantly led by China, continues to outbid the EU for LNG cargo and industrial gas demand increases due to favorable long-term hedging levels, current comfortable inventory levels will gradually return to normal. This suggests EU TTF prices will slowly climb towards over EUR 30/MWh by the next heating season, a trend partly factored into current pricing.

While the crisis urgency has faded, market adjustments now activate at lower price thresholds. Nonetheless, we anticipate slightly higher long-term price levels (EUR 30/MWh) due to increasing LNG bids from China (+NE Asia), a rebound in EU demand, and reduced LNG imports influenced by lower prices. This will result in a slower inventory build during Q2-24 and Q3-24 compared to last year. Despite diminishing supply from Russia, the EU remains focused on maintaining preparedness for future winters, leading to a new normal in natural gas inventory levels throughout the year.

The European energy crisis has significantly eased during 2023 and Q1-24. Softened front-end prices influence longer-dated prices, with the winter premium/seasonality fully washed out during the ongoing heating season. Healthy EU natural gas inventories, currently at 59% capacity (675 TWh) and surpassing the European Commission’s target of reaching 90% storage fullness by 1 November, contribute to this subsiding crisis. Continued subdued European consumption (11% below historical averages) and robust LNG imports set a ceiling on short-term prices, although increased EU demand could quickly alter this scenario, as EU demand has proven stickier than anticipated.

DEMAND RECOVERY

Reduced uncertainty and lower prices are expected to lead to more long-term hedging. Since the start of Q1 2024 (year-to-date), the TTF spot has averaged EUR 27/MWh, approximately USD 50/boe, only marginally below the ’historical norm’ when adjusted for inflation. Despite these price levels, a resurgence in European industrial gas consumption during the winter is not straightforward.

EU natura gas demand recuction vs normal

Industrial gas demand remains subdued, sitting 11% below historical averages. While this marks an improvement from the 25-30% drop experienced in mid-summer 2022 – a period characterized as the ”peak of the crisis” – when spot prices consistently traded at EUR 150/MWh (USD 255/boe).

The slower-than-expected recovery is largely attributed to industries hesitating to commit to longer-term prices. For example, during Q4 2023, despite tumbling spot prices, futures prices remained strong. In mid-October, gas for delivery in January 2024 was priced at EUR 55/MWh (USD 103/boe). Thus, during Q4 2023, peak-winter prices maintained a considerable premium over spot prices to a large extent.

However, the current landscape has changed. The winter premium has diminished as we exit the heating season, and weak spot prices predominantly drive forward. This reflects a market that is more certain and willing to forecast futures during a less turbulent phase. The convergence and narrowing gap between spot and long-term prices signify that ”peak natural gas has passed.” Major consumers in Europe are expected to adopt more long-term hedging for longer-term prices, ideally hedging these futures close to current spot prices. This suggests that current market prices will likely trigger increased consumption compared to Q3 and Q4 2023, although a full-scale comeback will take time.

As previously noted, substantial demand destruction occurred not only in Europe but also globally, particularly in Asia. Over the last couple of years, demand destruction amounted to approximately 800 TWh per year, while the normal growth rate in the global LNG market is 200 TWh per annum. This indicates that most of the demand will eventually return, although the timing remains uncertain. 


NE ASIAN LNG

EUR 25/MWh presents a favorable ”buy opportunity,” and prices are expected to either slide or climb from this point. The decline in prices can be attributed to sustained low demand and high inventories. We anticipate prices to either slide or increase from here, with minimal downside, as prices are likely to find support around EUR 25/MWh.

Forward prices for both JKM and TTF indicate that the NE Asian LNG market will remain a preferred destination for marginal LNG cargo in the near term. While the EU previously heavily relied on NE Asia, the European market can no longer solely depend on the economic vulnerabilities of NE Asia or China.

LNG arbitrage

A long-awaited pent-up demand for energy in China would lead to increased demand for goods and services, consequently boosting energy consumption, particularly natural gas, primarily in the form of LNG. In such a scenario, the JKM may command a larger premium over the TTF than the existing EUR 2.5/MWh (3-month rolling contract). This would divert LNG spot cargoes away from Europe, further reducing the EU’s natural gas surplus. Thus, the ongoing recovery in China’s economy is likely to stimulate Asia’s demand for natural gas, potentially resulting in EU LNG purchasers paying a premium to secure essential LNG imports in the future.

Daily LNG imports NE Asia

With current prices, we anticipate an increase in EU demand coupled with a decrease in EU LNG imports. This trend may persist until we observe a slight shortfall in compensation relative to the natural gas deficit from Russia, which could drive prices upward during the summer.


KEY TAKEAWAYS

The ongoing transition from coal to natural gas signifies a significant shift in the global energy landscape. Natural gas emerges as a crucial bridging technology, offering a cleaner alternative to coal and facilitating the transition toward widespread adoption of renewable energy sources. This transition underscores the environmental benefits of natural gas, positioning it as a pivotal component in mitigating climate change and reducing greenhouse gas emissions.

Despite challenges such as the reduction in Russian gas supply, the natural gas market is adapting rapidly. Europe, in particular, faces competition for global LNG volumes, primarily sourced from the US and Qatar. The market’s ability to swiftly adjust reflects its adaptability and resilience on a global scale, highlighting the importance of diversifying energy sources and supply routes.

Our current natural gas price forecast relies on achieving a delicate equilibrium among key factors. This includes stimulating demand, maintaining a correlation with crude prices, and ensuring cost coverage for US natural gas transportation. Striking this balance is essential for maintaining stability and sustainability in European gas pricing dynamics, ensuring energy security.

In response to changing market conditions, we have revised our price outlook downward for the short term, notably for Q2-24, Q3-24, and FY 2024. Specifically, Q1-24 is forecasted to average EUR 27/MWh, followed by predictions of EUR 25/MWh for Q2-24, EUR 28/MWh for Q3-24, and EUR 32/MWh for Q4-24. However, prices are expected to gradually increase over the longer term, with an average forecast of EUR 30/MWh for the years 2025, 2026, and 2027, slightly higher than historical averages.

This revised outlook reflects the evolving nature of the natural gas market and the need for flexibility in response to changing geopolitical landscapes and supply dynamics. Looking ahead, natural gas remains a crucial bridge over coal, facilitating the transition towards cleaner energy sources.

Fortsätt läsa

Analys

Fed cuts ahead bolstering oil prices

Publicerat

den

SEB - analysbrev på råvaror

Initially, Brent Crude experienced a decline yesterday following the release of US crude inventories data. However, nationwide US crude inventories, excluding those held in the Strategic Petroleum Reserve (SPR), saw a decline for the second consecutive week, remaining below the five-year seasonal average. Additionally, there was a larger-than-expected decline in gasoline holdings. While the overall draw presents a bullish narrative, it required some support from yesterday’s Federal Reserve announcement to trend in a positive direction.

Ole R. Hvalbye, Analyst Commodities, SEB

The Brent Crude front-month contract strengthened before yesterday’s close and has continued this positive momentum into today, currently trading at USD 86.5 per barrel. This reflects an increase of roughly USD 1 per barrel (1%) compared to yesterday evening’s low point.

The Federal Reserve signaled its intention to adhere to its outlook for three rate cuts this year, boosting both risk appetite and weakening the US dollar, which has benefited global crude prices.

In our analysis, global crude prices are currently supported by strong fundamentals. Demand growth remains robust, complemented by significant production cuts by OPEC+ and subdued output from US shale oil producers. Consequently, the global oil market is operating at a slight deficit, resulting in a gradual depletion of oil inventories, as evidenced by the recent declines in US crude and product inventories (further details below). This trend is expected to provide support for oil prices and potentially drive them sideways to upwards, with limited downside risks.

However, it’s important to note that while fundamentals appear promising and the oil market has found some reassurance in yesterday’s Federal Reserve announcement, expectations for enduring inflation may act as a headwind for oil prices over the longer term, potentially capping a significant oil price rally.

As a reminder, our assumptions for Brent oil prices have remained firm since September 2023. We anticipate Brent Crude to average USD 85/bl and USD 87.5/bl for 2024 and 2025, respectively, with projections of USD 90/bl for 2026 and 2027.


Yet another week of drawdown in US inventories. Commercial crude oil inventories in the U.S., excluding those held in the Strategic Petroleum Reserve, decreased by 2.0 million barrels from the previous week, reaching a total of 445.0 million barrels. This figure is approximately 3% below the five-year average for this time of year.

Total motor gasoline inventories saw a significant decline of 3.3 million barrels from the previous week, now standing approximately 2% below the five-year average. However, distillate fuel inventories experienced a marginal increase of 0.6 million barrels, remaining roughly 5% below the five-year average. Meanwhile, propane/propylene inventories rose by 0.4 million barrels, reaching a notable 9% above the five-year average.

Overall commercial petroleum inventories witnessed a decrease of 6.1 million barrels last week. Total products supplied over the last four-week period averaged 20.1 million barrels per day, indicating a 2.2% increase from the same period last year.

Motor gasoline product supplied averaged 8.8 million barrels per day over the past four weeks, showing a marginal increase of 0.3% from the same period last year. Conversely, distillate fuel product supplied averaged 3.7 million barrels per day, down by 1.9% from the same period last year. Jet fuel product supplied experienced a slight decrease of 0.2% compared to the same four-week period last year.

Fortsätt läsa

Populära