

Analys
SEB – Råvarukommentarer, 13 januari 2014

Rekommendationer
Inledning
Veckans vinnare blev MINIL KAFF B S med en uppgång på 46%, när kaffepriset steg förra veckan. Sedan Jul erbjuder vi även minifutures på råvaror. De är till för dem som vill ta extremt mycket risk. Risken är lika hög som i de riktiga terminerna, men i mindre storlek och tillgängliga över aktiebörsen.
Tre nyheter från förra veckan är viktiga för råvarumarknaden: I fredags publicerades antalet nyanställningar i USA kallad ”Non-Farm Payrolls”. Marknaden hade väntat sig 197,000 nyanställningar i december, men det blev bara 75,000. När FED just påbörjat nedtrappningen av takten i penningmängdsökningen den 18 december för att ekonomin i USA såg ut att klara sig, var NFP-siffran förvånande svag. Den fick en påverkan på dollarn, som föll och på guldet som steg. Den andra nyheten kom vid 18 i fredags från det amerikanska jordbruksdepartementet, årets första World Agricultural Supply and Demand Estimates (WASDE). Matif hann inte reagera fullt ut eftersom rapporten kom 30 minuter innan stängning i Europa. Dessutom är innehållet i rapporten inte lika positivt som ”rubriksiffrorna”. Vi går igenom rapporten i detalj i det här veckobrevet. Den sista nyheten är Indonesiens exportstopp avseende oberarbetad malm som ska ha trätt i kraft igår (söndag). Det påverkar främst marknaderna för aluminium och nickel.
Råolja – Brent
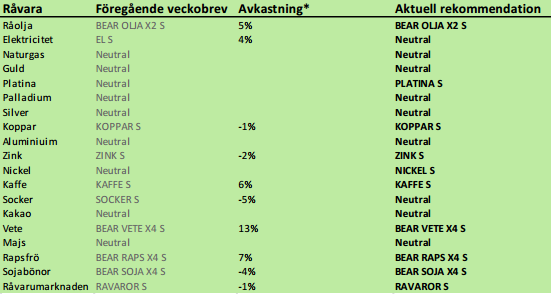
Efter prisfallet i början av året handlades oljan lugnare i veckan som gick. Tekniskt borde man se en ytterligare nedgång till ca 103 dollar.
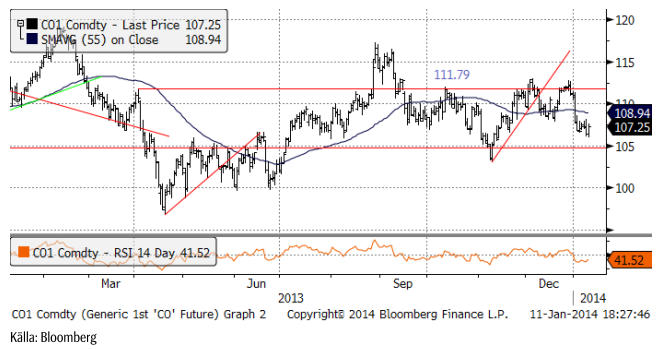
Det som gör att marknaden tvekar, att gå ner till 103 dollar / fat, är att där finns ett stöd, som vi ser i nedanstående diagram. Om priset skulle falla ner dit, skulle det signalera en säljsignal, som enligt den tekniska analysen mycket väl skulle kunna ta ner oljepriset till 80 dollar, 60 dollar eller rentav till 40 dollar. Det blir den största baissen på råvarumarknaden på många år.
Jag tror att det är värt att spekulera i nedgång redan innan oljepriset har brutit ner och rekommenderar köp av BEAR OLJA X2 S.
Du har väl sett att vi nu också har minifutures med mycket hög hävstång? MINIS OLJA B S är en ”mini short” med 6.5 gångers hävstång på nedsidan. Om oljepriset går ner med 1%, ökar värdet på den här mini-futuren med nästan 6.5% (och olyckligtvis vice versa om oljepriset stiger med 1%).
Elektricitet
Elpriset vände upp i veckan på prognosen om det kallare vinterväder vi har nu. I fredags föll priset när det kom lite mildare väder in i prognosfönstret igen. Priset vände ner i torsdags exakt på motståndet, som gavs av bottennoteringen på kontraktet i juni. Tekniskt ser det därmed negativt ut.
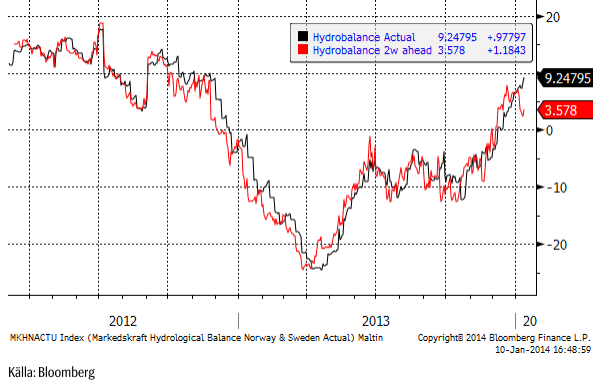
Hydrologisk balans har under hösten klättrat 20 TWh, från ett underskott på 10 till ett överskott på 10 TWh, som vi ser av Markedskrafts data. Vi ser också att prognosen för två veckor framåt har vänt när och där har vi en stor del av förklaringen till prisuppgången den senaste veckan.
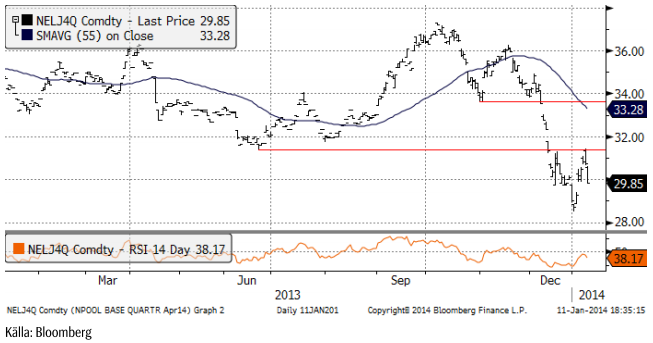
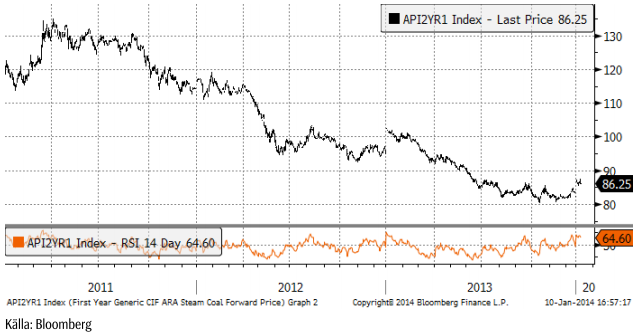
Enmånads termin på energikol steg flera procent i veckan och terminen för nästa år utvecklades också positivt. Nedan ser vi priset på energikol, det närmaste årets leveranstermin för de senaste tre åren.
Vi rekommenderar köp av EL S på lång sikt, men tycker att man ska vara försiktig på kort sikt pga den tekniska bilden.
SEB är ensam om att erbjuda mini futures på el. Mini futures har inte daglig hävstång, utan beter sig som en värdepapperiserad depå, som innehåller en del av en termin i position och kontanter. Om positionen går emot, och stop-loss utlöses, går minifuturen till förtidslösen. I en tabell längst bak i det här brevet ser du vilka minifutures som finns på elpriset (samma underliggande termin som EL S).
Naturgas
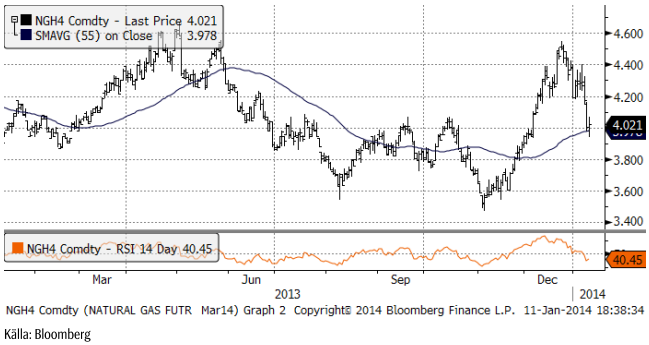
Naturgaspriset i USA har handlats upp på det kalla vädret. Det har varit och är just nu extremt kallt i USA, men det mildare väder kom in i prognosfönstret redan för ett par veckor sedan har redan börjat tina upp landet. Priset är tillbaka nere på 4 dollar, som är en stödnivå. Det mesta av prisfallet är därför förmodligen över.
Basmetaller – fokus på Indonesien
Basmetallhandlare har den senaste veckan försökt följa händelseutvecklingen i Indonesien vad gäller exportstoppet av obearbetad malm som ska ha trätt i kraft igår, söndag. Landet exporterar bland annat stora mängder kopparmalm, nickelmalm och bauxit (råvaran till aluminium). Förra veckan presenterades och antogs ett förslag i parlamentet att kopparkoncentrat med mer än 15% koppar skulle undantas från exportförbudet. Det har också cirkulerat rykten om övergångsregler till 2017. Minst en nickelgruva har stängts och arbetarna skickats hem. Trots att beslutet om exportförbud av obearbetad råvara fattades redan 2007 har inte inhemsk förädlingsindustri kommit på plats fullt ut än. Exportstoppet, om det implementeras kompromisslöst, ger framförallt nickelmarknaden stöd. Kina har emellertid lager av kopparmalm som täcker behovet i 6 – 9 månader. Aluminiummarknaden är mindre påverkad eftersom det finns gott om andra leverantörer av bauxit och för att bauxit inte är den huvudsakliga kostnadsposten i aluminiumframställning.
Koppar
Indonesiens förbud att exportera oförädlad malm ska av allt att döma vara i kraft idag måndag. Kopparkoncentrat som innehåller mer än 15% koppar ska vara exkluderat, enligt ett förslag som vad vi erfar antogs förra veckan.
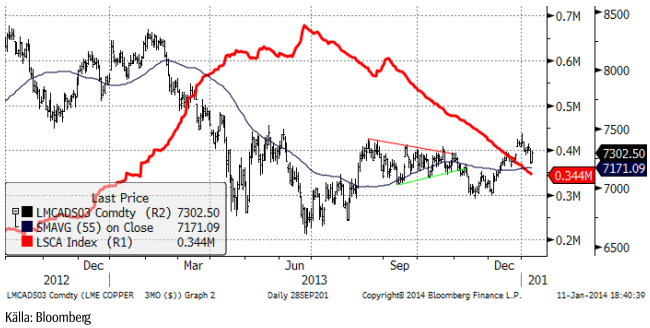
Kopparpriset höll sig starkt hela förra veckan, med en ganska kraftig likvidering på torsdagen. Kinesiska inflationssiffror skrämde marknaden och protokollet från FED:s möte i december som publicerades samma dag och detta räckte för att få priset att backa 1%. På fredagen fick marknaden dock nytt stöd när den inflytelserika Red Kite-fonden sade att den ”backwardation” som marknaden för terminer handlas i, kommer att fortsätta ett bra tag, med hänvisning till lägre lager. Backwardation gör att den som äger koppar via terminer tjänar en extra riskpremie på positionen.
Notera också att lagren vid LME (röd linje) minskar stadigt.
Vi rekommenderar köp av KOPPAR S.
Aluminium
Indonesiens förbud att exportera obearbetad malm var i fokus i veckan. Indonesien exporterar 2/3 av den bauxit som Kina importerar för sin aluminiumtillverkning. I onsdags publicerade Indonesiens handelskammare en varning om att 200,000 gruvarbetare blir arbetslösa när eller om exportförbudet träder i kraft. Indonesiens gruvministerium arbetar på ett förslag på övergångsregler som skulle göra det möjligt att exportera obearbetad malm fram till år 2017. Regeringen i Jakarta har kört en hård linje, men påtryckningarna är stora och det är ännu oklart vad som händer. De som drabbas värst av ett exportförbud är små gruvor, som saknar möjligheter att investera i förädling av malmen. Större företag som Freeport McMoRan och Newmont Mining har inte dessa problem. Exportförbudet slår därför mot de fattigaste i sektorn, vilket väger tungt i politiken.
Med det sagt, är bauxit inte svårt att hitta från andra håll än från Indonesien och det är inte den dyraste inputvaran för att tillverka aluminiium. Energipriset är långt viktigare. Indonesiens exportstopp spelar därför mindre roll för aluminiummarknaden än det gör för nickelmarknaden.
Produktionsneddragningar utanför Kina har gjort att marknaden väntas nå balans under året. Som vi ser i diagrammet nedan, har lagernivåerna börjat plana ut – på en mycket hög nivå (röd kurva). Prisutvecklingen befinner sig fortfarande i fallande trend och söker en botten.
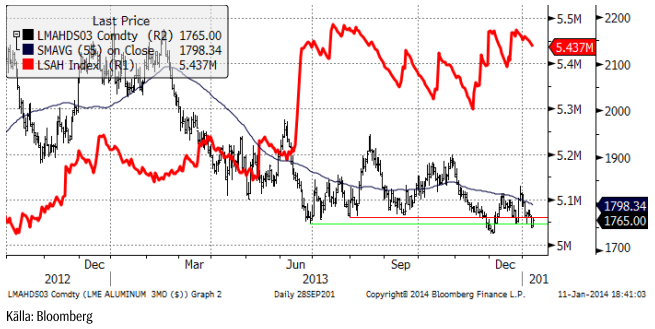
Vi fortsätter med neutral rekommendation på aluminium.
Zink
Zinkpriset som steg med 14% i december, drabbades av vinsthemtagningar vid 2100. Tekniskt är detta helt naturligt och vi tycker att det är ett köptillfälle nu.
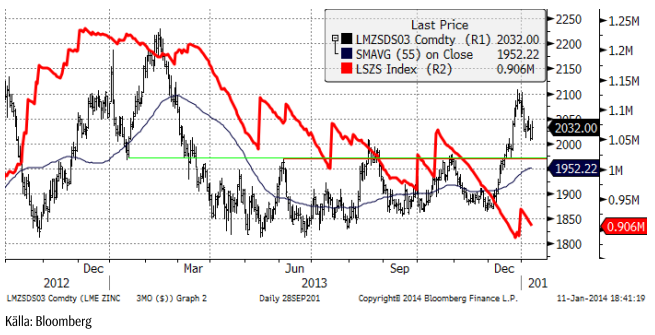
Vi rekommenderar köp av ZINK S.
Nickel
Det är ännu osäkert om Indonesiens förbud att exportera obearbetad nickelmalm trädde i kraft den 12 januari (igår). Indonesien är världens största exportör av nickelmalm och förser även Kina med 2/3 av dess behov av bauxit (råvaran för att tillverka aluminium). I veckan nåddes vi av nyheten att åtminstone en gruva stoppat all produktion. Samtidigt kom nyheten i torsdags att Indonesiens gruvministerium arbetar på att få igenom ett förslag med övergångsregler som gör det möjligt att exportera nickelmalm fram till år 2017. Förhoppningsvis klarnar bilden i veckan som kommer.
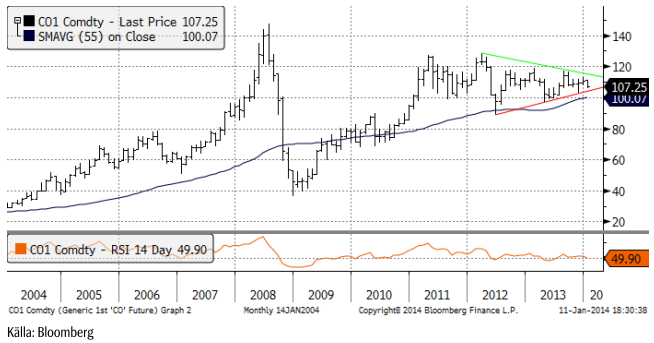
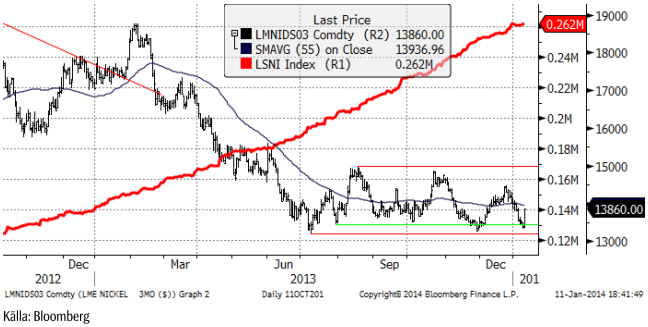
Det produceras mer nickel än vad som efterfrågas i världen. Det ser vi på de ständigt ökande lagren vid LME (röd linje i diagrammet nedan). Exportstoppet i Indonesien kan minska överskottet och kanske få marknaden i balans.
Sent på fredagen kom det indikationer på att exportstoppet verkligen skulle träda i kraft, vilket fick priset att gå upp kraftigt, som vi ser i diagrammet nedan. Nickelmarknaden har handlat metallen inom ett snävt prisintervall mellan dyrgt 13000 dollar och 15000 dollar. Förra veckan var priset ungefär mitt i, så vi gav en neutral rekommendation då. Vi tycker man kan försöka köpa nickel nära botten på prisintervallet. Vi är neutrala till positiva, men det är viktigt att följa utvecklingen i Indonesien noga.
Guld
Non-Farm Payrolls (antal nyanställda) för december kom in förvånande lågt i fredags. FED hade nog inte räknat med att antalet nyanställda skulle hamna på halva den tidigare och den förväntade nivån när de inledde nedtrappningen av ökningen av penningmängden i december. Marknaden tolkade omedelbart siffran som att den fördröjer takten i ”tapering” processen och handlade ner dollarn – vilket allt annat lika innebär ett högre pris på guld (som ju handlas i dollar) och som dessutom gynnas av ”mer pengar” att parkera. Det är dock lite för förhastat att dra för långtgående slutsatser bara av en månads arbetsmarknadsstatistik.
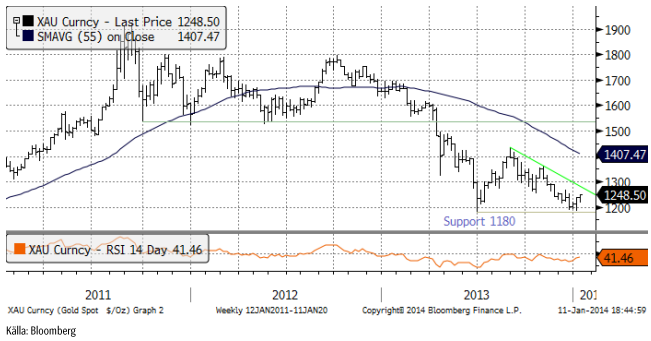
Nedan ser vi ett veckochart över guldpriset. Stödet på 1180 dollar har hållit två gånger. Det riktiga stödet finns emellertid på 1000 dollar och vi tror att priset går dit innan nedgången är över.
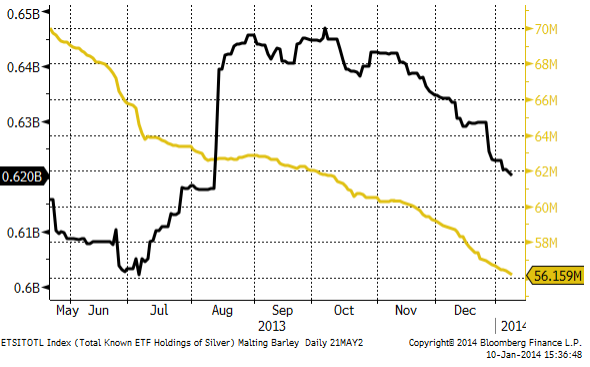
Placerares innehav av guld via börshandlade fonder fortsätter att minska. I diagrammet nedan ser vi guldinnehaven som gul linje och innehaven av silver via ETF:er visas av den svarta kurvan.
En del tycker att guld är intressant att köpa på kort sikt nu, eftersom priset är tillbaka på sommarens bottennivå vid 1200 dollar per ton. Året har också börjat med prisuppgång, men vi har ingen teknisk köpsignal, annat än att 1200 dollar har hållit. Det räcker inte för att ur teknisk synvinkel motivera en köprekommendation.
Vi fortsätter tills vidare med neutral vy på guld, men förbereder oss för att gå kort på riktigt igen vid ett brott av 1200 dollar på nedsidan.
Silver
Silver har till skillnad från guld, redan nått sitt ”ordentliga stöd”, som är 1000 dollar för guld. För silver är det 20 dollar. Å andra sidan, skulle det inte vara det, får man gå ända ner till 10 dollar för att hitta nästa avgörande stöd. Silverpriset har fortsatt att röra sig sidledes. I fredags stängde marknaden högre på NFP-siffran och den svagare dollarn. Motståndet för nedgången ligger helt nära ovanför och det ska bli intressant att se om den bryts eller om ett nytt prisfall inleds.
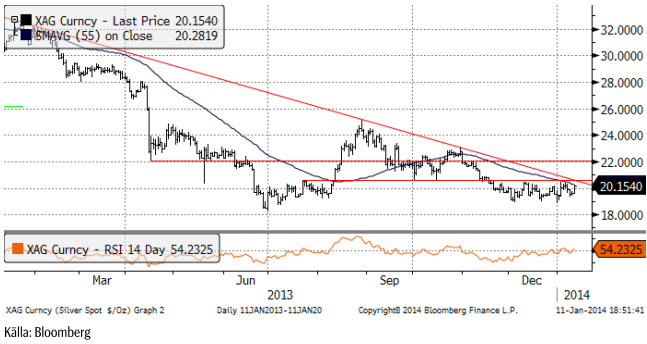
Vi gick över till neutral på silver förra veckan och fortsätter att hålla oss på sidlinjen till dess vi vet om det blir ett brott uppåt eller om priset vänder nedåt igen.
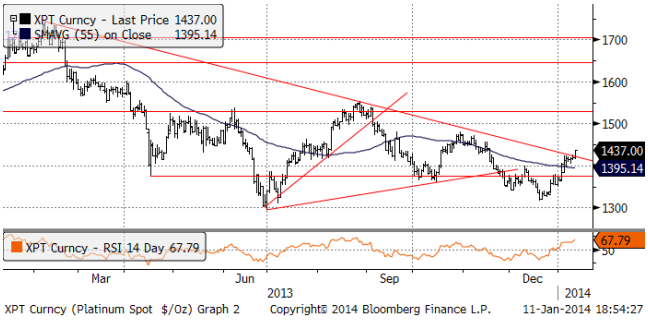
Platina & Palladium
Platina bröt faktiskt motståndslinjen i fredags och därför rekommenderar vi köp av PLATINA S.
Palladium handlades också upp, men befinner sig fortfarande inom det intervall som priset legat inom det senaste året.
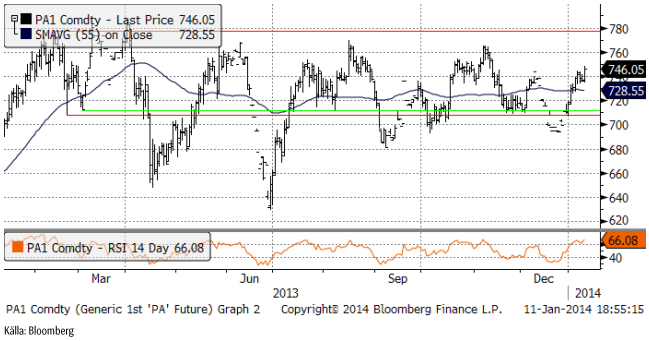
Vi rekommenderar alltså köp av platina, men vi förhåller oss än så länge neutrala till palladium.
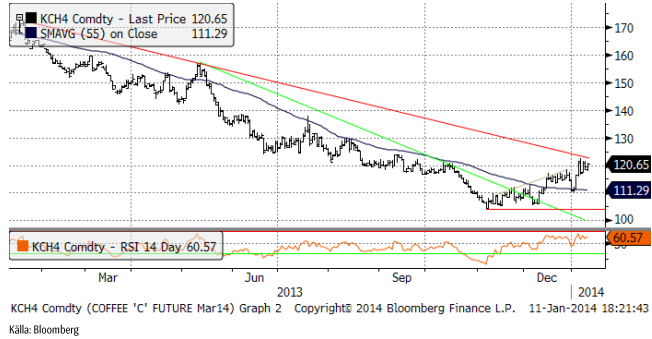
Kaffe
Kaffepriset har tagit sig ända upp till motståndet för den fallande trenden. Skulle priset på kaffe fortsätta bara lite till uppåt, är den fallande trenden bruten. Det betyder inte att en stigande trend är etablerad. Det är väldigt sällan en lång nedgångsfas omedelbart vänds i en stigande marknad, utan att det etablerats en botten. Sannolikheten är stor att uppgången från 105 cent till 120 nu vänds i en rekyl nedåt.
CONAB rapporterade i torsdags att kaffeskörden kan bli mindre än tidigare befarat. Total skörd av kaffe (arabica och robusta) väntas bli 46.53 – 50.15 miljoner säckar (à 60 Kg). Förra årets skörd var 49.15 miljoner säckar. Det kommande året i vartannatårs-cykeln ska annars normalt sett ha en högre skörd än året innan för arabica. Skörden av arabica väntas bli 35.1 – 37.5 miljoner säckar. Förra året producerades 38.3 miljoner säckar. För robusta väntas däremot en ökning, från förra årets 10.9 miljoner till 11.5 – 12.6 miljoner säckar. Marknaden hade väntat sig att Brasilien skulle skörda 60 miljoner säckar i år, så detta är väsentligt mindre än det och i synnerhet för arabica. Anledningen är att det låga priset inte motiverar odlare att sköta sina plantor. Enligt en rapport från USDA väntas den genomsnittliga produktionskostnaden i år uppgå till 147 cent per pund och med ett pris på 120 cent är det inte lönt att odla för optimal produktion. CONAB säger också att arealen är lägre i år än förra året. Uppenbarligen har gamla uttjänta odlingar ersatts med någon annan gröda, förmodligen till stor del med sockerrör.
Med reservation för att vi tror att det mest sannolika är en rekyl nedåt i veckan som kommer, tror vi ändå att kaffe är köpvärt på länge sikt och behåller därför köprekommendationen.
Det finns nu också mini futures på kaffe, som erbjuder högre hävstång.
För övriga jordbruksråvaror se Jordbruksbrevet.
[box]SEB Veckobrev Veckans råvarukommentar är producerat av SEB Merchant Banking och publiceras i samarbete och med tillstånd på Råvarumarknaden.se[/box]
Disclaimer
The information in this document has been compiled by SEB Merchant Banking, a division within Skandinaviska Enskilda Banken AB (publ) (“SEB”).
Opinions contained in this report represent the bank’s present opinion only and are subject to change without notice. All information contained in this report has been compiled in good faith from sources believed to be reliable. However, no representation or warranty, expressed or implied, is made with respect to the completeness or accuracy of its contents and the information is not to be relied upon as authoritative. Anyone considering taking actions based upon the content of this document is urged to base his or her investment decisions upon such investigations as he or she deems necessary. This document is being provided as information only, and no specific actions are being solicited as a result of it; to the extent permitted by law, no liability whatsoever is accepted for any direct or consequential loss arising from use of this document or its contents.
About SEB
SEB is a public company incorporated in Stockholm, Sweden, with limited liability. It is a participant at major Nordic and other European Regulated Markets and Multilateral Trading Facilities (as well as some non-European equivalent markets) for trading in financial instruments, such as markets operated by NASDAQ OMX, NYSE Euronext, London Stock Exchange, Deutsche Börse, Swiss Exchanges, Turquoise and Chi-X. SEB is authorized and regulated by Finansinspektionen in Sweden; it is authorized and subject to limited regulation by the Financial Services Authority for the conduct of designated investment business in the UK, and is subject to the provisions of relevant regulators in all other jurisdictions where SEB conducts operations. SEB Merchant Banking. All rights reserved.

Market is starting to take US/Iran headlines with a pinch of salt. Brent crude rose $2.8/b yesterday to an official close of $112.1/b. But after that it traded as low as $108.05/b before ending late night at around $109.7/b. Through the day it traded in a range of $106.87 – 112.72/b amid a flurry of news or rumors from Iran and the US. ”US temporary sanctions during negotiations” (falls alarm). ”We will bomb Iran” (not anyhow),… etc. While the market is still fluctuating to this kind of news flow, it is starting to take such headlines with a pinch of salt.

We’ll see. Maybe, maybe not. The Brent M1 contract is trading at $110.2/b this morning which very close to the average ticks through yesterday of $110.4/b.
Trump with bearish, verbal intervention whenever Brent trades above $110/b it seems. What seems to be a pattern is that Trump states something like ”very good negotiations going on with Iran”, ”New leaders in Iran are great,..”, ”Great progress in negotiations,…”, ”Deal in sight,..” etc whenever the Brent M1 contract trades above $110/b. An effort to cool the market. These hot air verbal interventions from Trump used to have a heavy bearish impact on prices, but they now seems to have less and less effect unless they are backed by reality.
As far as we can see there has been no real progress in the negotiations between the US and Iran with both sides still standing by their previous demands.
Iran is getting stronger while the cease fire lasts making a return to war for Trump yet harder. Iran is naturally in constant preparation for a return to war given Trump’s steady threats of bombing Iran again. Iran is naturally doing what ever is possible to prepare for a return to war. And every day the cease fire lasts it is better prepared. This naturally makes it more and more difficult and dangerous for the US to return to warring activity versus Iran as the consequences for energy infrastructure in the Persian Gulf will be more and more severe the longer the cease fire lasts. Israel seems to see it this way as well. That the war is not won and that current frozen state of a cease fire gives Iran opportunity to rebuild military and politically.
Global inventories are drawing down day by day. How much? In the meantime the Strait of Hormuz stays closed. There is varying measures and estimates of how much global inventories are drawing down. Our rough estimate, back of the envelope, is that global inventories are drawing down by at least some 10 mb/d or about 300 mb/d in a balance between loss of supply versus demand destruction. Other estimates we see are a monthly draw of 250-270 mb/d. The IEA only ’measured’ a draw in global observable stocks of 117 mb in April with oil on water rising 53 mb while on shore stocks fell 170 mb. But global stocks are hard to measure with large invisible, unmeasured stocks. As such a back of the envelope approach may be better.
Oil products is what the world is consuming. Oil product prices likely to rise while product stocks fall. Strategic Petroleum Reserves (SPR) are predominantly crude oil. Discharging oil from OECD SPR stocks, a sharp reduction in Chinese crude imports and a reduction in global refinery throughput of 6-7 mb/d has helped to keep crude oil markets satisfactorily supplied. But global inventories are drawing down none the less. And oil products is really what the world is consuming. So if global refinery throughput stays subdued, then demand will eventually have to match the supply of oil products. The likely path forward this summer is a steady draw down in jet fuel, diesel and gasoline. Higher prices for these. Then, if possible, higher refinery throughput and higher usage of crude in response to very profitable refinery margins. And lastly sharper draw in crude stocks and higher prices for these. But some 6 mb/d of oil products used to be exported through the Strait of Hormuz. And it may not be so easy to ramp up refinery activity across the world to compensate. Especially as Ukraine continues to damage Russian refineries as well as Russian crude production and export facilities.
Watch oil product stocks and prices as well as Brent calendar 2027. What to watch for this summer is thus oil product inventories falling and oil product premiums to crude rising. Another measure to watch is the Brent crude 2027 contract as it rises steadily day by day as the Strait of Hormuz stays closed and global oil inventories decline. The latter is close to the highest level since the start of the war and keeps rising.
The Brent M1 contract and the Brent 2027 prices and current price of jet fuel in Europe (ARA). All in USD/b

Our back of the envelope calculation of the global shortage created by the closure of the Strait of Hormuz. Note that 3.5 mb/d of discharge from SPR is also a draw. Note also that ’Forced demand loss’ of 2.5 mb/d is probably temporary and will fall back towards zero as logistics are sorted out leaving ’Price demand loss’ to do the job of balancing the market. Thus a shortfall of at least 9 mb/d created by the closure. More if SPR discharge is included and more if Forced demand loss recedes.

Brent is climbing higher. Front-month is at USD 106.3/bl this morning, close to a weekly high and a USD 9/bl jump from Mondays open. This is the move we flagged as a risk earlier in the week: the market shifting from ”a deal is around the corner” to ”this is going to take longer than we thought”.

Analyst Commodities, SEB
During April, rest-of-year Brent remained remarkably stable around USD 90/bl. A stability which rested on one single assumption: the SoH reopens around 1 May. That assumption is now slowly falling apart.
As we highlighted yesterday: every week of delay beyond 1 May adds (theoretically) ish USD 5/bl to the rest-of-year average, as global inventories draw 100 million barrels per week. i.e., a mid-May reopening implies rest-of-year Brent closer to USD 100/bl, and anything pushing into June or July takes us meaningfully higher.
What’s changed in the last 48 hours:
#1: The US military has formally warned that clearing suspected sea mines from SoH could take up to six months. That is a completely different timescale from what the financial market is pricing. Even a political deal tomorrow does not immediately reopen the strait.
#2: Trump has shifted his tone from urgency to ”strategic patience”. In yesterday’s press conference: ”Don’t rush me… I want a great deal.” The market is reading this as a president no longer feeling pressured by timelines, with the naval blockade running in the background.
#3: So far, the military activity is escalating, not de-escalating. Axios reports Iran is laying more mines in SoH. The US 3rd carrier strike group (USS George H.W. Bush) is arriving with two countermine vessels. Trump yesterday ordered the US Navy to destroy any Iranian boats caught laying mines. While CNN reports that the Pentagon is actively drawing up plans to strike Iranian SoH capabilities and individual Iranian military leaders if the ceasefire collapses. i.e., NOT a attitude consistent with an imminent deal!
Spot crude and product prices eased off the early-April highs on a combination of system rerouting and deal optimism. Both now weakening. Goldman estimates April Gulf output is reduced by 14.5 mbl/d, or 57% of pre-war supply, a number that keeps getting worse the longer this drags on.
Demand-side adaptation is ongoing: S. Korea has cut its Middle East crude dependence from 69% to 56% by pulling more from the Americas and Africa, and Japan is kicking off a second round of SPR releases from 1 May. But SPRs are finite.
Ref. to the negotiations, we should not bet on speed. The current Iranian leadership is dominated by genuine hardliners willing to absorb economic pain and run the clock to extract concessions. That is not a setup for a rapid resolution. US/Israeli media briefings keep framing the delay as ”internal Iranian divisions”, the reality is more complicated and points toward weeks and months, not days.
Our point is that the complexity is large, and higher prices have only just started (given a scenario where the negotiations drag out in time). The market spent April leaning on the USD 90/bl rest-of-year assumption; that case is diminishing by the hour. If ”early May reopening” is replaced by ”June, July or later” over the next week or two, both crude and products have meaningful room to reprice higher from here. There is a high risk being short energy and betting on any immediate political resolution(!).
Down on Friday. Up on Monday. The Brent June crude oil contract traded down 5.1% last week to a close of $90.38/b. It reached a high of $103.87/b last Monday and a low of $86.09/b on Friday as Iran announced that the Strait of Hormuz was fully open for transit. That quickly changed over the weekend as the US upheld its blockade of Iranian oil exports while Iran naturally responded by closing the SoH again. The US blew a hole in the engine room of the Iranian ship TOUSKA and took custody of the ship on Sunday. Brent crude is up 5.6% this morning to $95.4/b.
The cease-fire is expiring tomorrow. The US has said it will send a delegation for a second round of negotiations in Islamabad in Pakistan. But Iran has for now rejected a second round of talks as it views US demands as unrealistic and excessive while the US is also blocking the Strait of Hormuz.
While Brent is up 5% this morning, the financial market is still very optimistic that progress will be made. That talks will continue and that the SoH will fully open by the start of May which is consistent with a rest-of-year average Brent crude oil price of around $90/b with the market now trading that balance at around $88/b.
Financial optimism vs. physical deterioration. We have a divergence where the financial market is trading negotiations, improvements and resolution while at the same time the physical market is deteriorating day by day. Physical oil flows remain constrained by disrupted flows, longer voyage times and elevated freight and insurance costs.
Financial markets are betting that a US/Iranian resolution will save us in time from violent shortages down the road. But every day that the SoH remains closed is bringing us closer to a potentially very painful point of shortages and much higher prices.
The US blockade is also a weapon of leverage against its European and Asian allies. When Iran closed the SoH it held the world economy as a hostage against the US. The US blockade of the SoH is of course blocking Iranian oil exports. But it is also an action of disruption directed towards Europe and Asia. The US has called for the rest of the world to engaged in the war with Iran: ”If you want oil from the Persian Gulf, then go and get it”. A risk is that the US plays brinkmanship with the global oil market directed towards its European and Asian allies and maybe even towards China to force them to engage and take part. Maybe unthinkable. But unthinkable has become the norm with Trump in the White House.


Sommarväder skapar prisrally på elbörsen
Oil product price pain is set to rise as the Strait of Hormuz stays closed into summer

Solkraften pressar elpriserna dagtid

Michel Gubel ger sin syn på oljemarknaden