

Analys
SEB – Råvarukommentarer, 11 november 2013

Rekommendationer
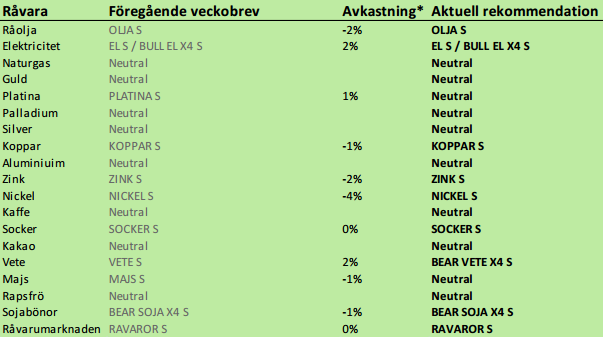
*) Avkastningen anges för 1:1 certifikaten där både BULL och 1:1 certifikat är angivna.
Inledning
I veckan som gick har flera stora händelser inträffat och rapporter av stor betydelse för råvarumarknaden har publicerats. ECB:s räntesänkning och starkare BNP och arbetsmarknadsstatistik från USA fick dollarn att stärkas i veckan – och euron och kronan att falla. Naturligtvis ledde ett högre pris på dollarn att råvaror noterade i dollar sjönk i motsvarande grad. Råvaror noterade i euro, eller omräknade till kronor höll sig stabila. På jordbrukssidan publicerade FAO / AMIS sin månadsrapport, som inte hade någon större inverkan på marknaden. Förväntningarna om ett riktigt fyrverkeri var inställda på USDA:s månatliga WASDE-rapport, som inte kommit ut på två månader. Det blev något av ett antiklimax när den väl kom klockan 18 i fredags. Efter en viss tvekan valde marknaden att handla upp majs och soja på basis av vad rapporten sade om den amerikanska marknaden. Ser vi till de globala utbuds- och efterfrågebalanserna är det inte lika uppenbart att priset ska upp.
Ny information medför att vi gjort flera revideringar av våra rekommendationer, framförallt pga WASDE-rapporten. Vi går över till neutral vy på majspriset och från köp till sälj på vete. Vi behåller sälj på sojabönor. Vi går också över från köp till neutral på platina och palladium (en försiktig köp i förra veckobrevet).
USA firar idag vapenstilleståndet i det första världskriget (klockan 11), omdöpt till ”Veteran’s Day”, men börserna är öppna. Det kan därför bli lite tunnare handel idag måndag, än vanligt.
Råolja – Brent
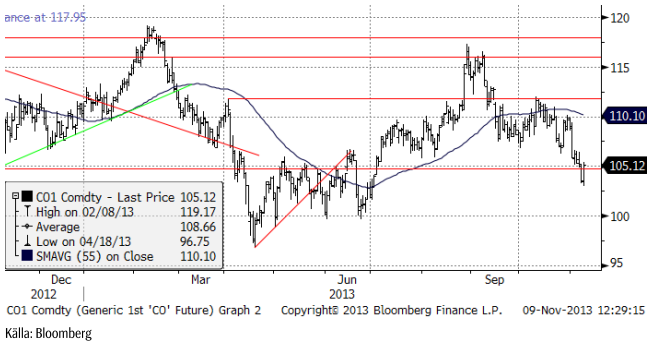
Oljepriset backade med 1% i veckan, efter att ha handlats på ännu lägre nivåer i torsdags. Oljeprisfallet på 1% ska ses mot bakgrund av att dollarn stärktes mot såväl euron som kronan med 1%. I dessa valutor var alltså oljepriset oförändrat.
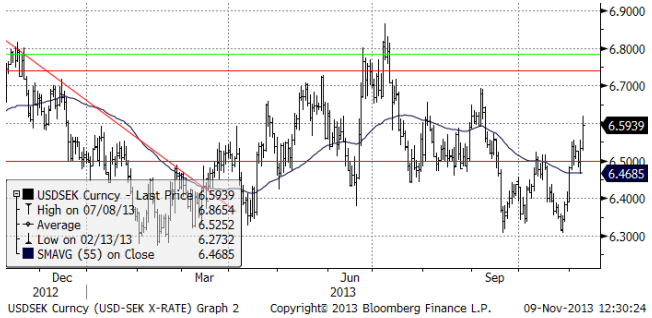
Nedanför ser vi kursutvecklingen på dollar mot kronor. Europeiska valutor, inklusive den svenska kronan, föll direkt efter ECB:s i och för sig väntade sänkning av styrräntan till 0.25%. Dollarn styrka fick sedan ytterligare skjuts när arbetsmarknadsstatistiken i USA visade att över 200,000 människor fått nytt jobb under oktober månad. Detta trots budgetbråket och stängningen av den amerikanska federala staten under månaden. En starkare dollar betyder automatiskt lägre noteringar på råvaror, när de uttrycks i dollar.
I onsdagens DOE-rapport steg råoljelagren för sjunde veckan på raken. Lagren ökade med 1.5 miljoner fat till 385 miljoner. Lagernivåerna ligger nu återigen på rekordnivåer för den här tiden på året, högre än förra året.
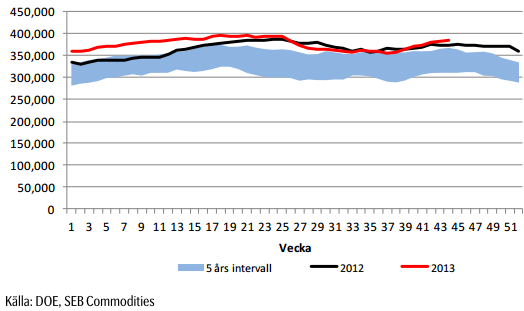
Lagerökningen i USA har skett trots att importen har minskat till 7.2 miljoner fat. Samma vecka förra året importerades 8 miljoner fat per dag. Detta har alltså substituerats med inhemsk produktion. Det höga priset på olja håller alltså på att stimulera fram mer produktion. Det är ett tydligt tecken på att pris och inte resonemanget om ”ändliga resurser” spelar en avgörande roll för hur mycket som produceras.
Det växande utbudet av råolja är en långsiktigt negativ faktor för oljemarknaden. Den kompenserande faktorn är rabatten på terminerna, som gör att en investering i olja trots allt kan vara långsiktigt lönsam. Förra veckan varnade vi att ”den som är intresserad kanske bör avvakta med köp ifall priset faller i veckan”. Vi anser att vi har haft det prisfallet och att det nu är säkrare att öka positionen i olja genom OLJA S.
Elektricitet
Elpriset, som föll när det blöta väder vi nu upplever började dyka upp i prognoserna, fann stöd på 39 euro per MWh och handlades upp till 41 euro. I torsdags fick vinsthemtagningar priset på fall, men handeln i fredags var stark. Marknaden kommer antagligen att testa 41 euro igen. Ovanför finns nästa motstånd vid 42.35 euro.
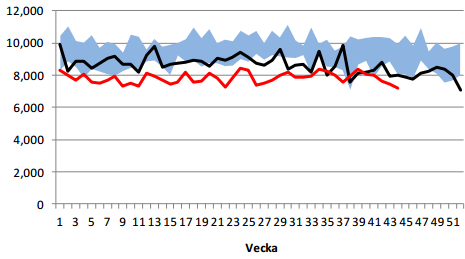
Nedan ser vi prisdiagrammet för det första kvartalet 2014:s kontrakt, uppdaterat till i fredags.
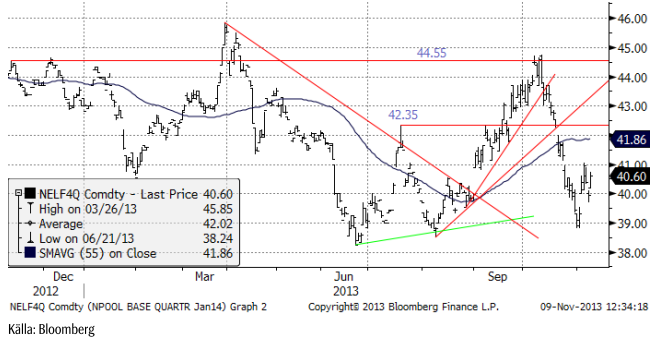
Nedan ser vi priset på energikol, den närmaste månadens leveranstermin. Priset har utvecklats stark i veckan. Priset ligger nu strax under ett kortsiktigt motstånd. Trenden är uppåtriktad, vilket ges av högre toppar och högre bottnar, samt att 55-dagars glidande medelvärde är stigande.
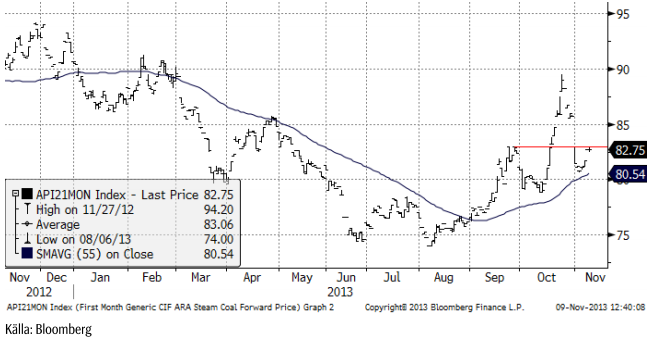
Utsläppsrätterna utvecklar sig däremot svagare, som vi ser i prisdiagrammet för decemberkontraktet på utsläppsrätter nedan. Marknaden var betydligt svagare i fredags än förväntat.
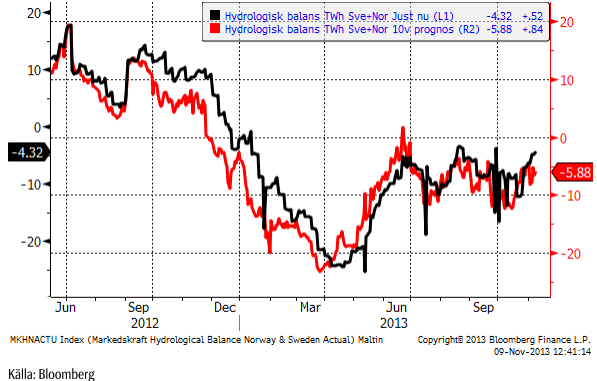
Hydrologisk balans har inte stigit så mycket som man kunde tro av allt regnande. Nederbörden har kommit på befolkningscentra och inte på högre höjder i norr, i samma utsträckning.
Vi rekommenderar köp av EL S eller BULL EL X4 S.
Naturgas
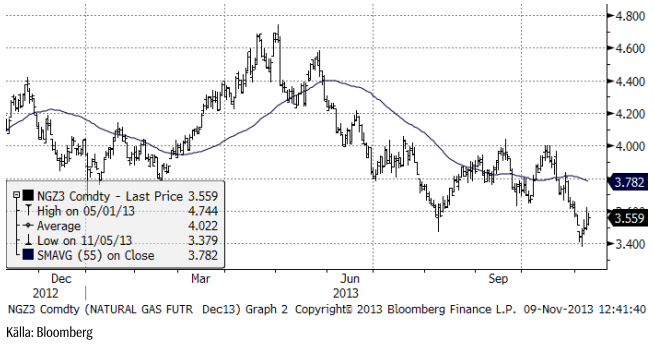
Naturgaspriset fann stöd på 3.40 och vände upp till 3.60, ett tekniskt motstånd. Trenden är nedåtriktad och enligt teknisk analys, är det mer troligt att priset vänder ner efter veckans uppgång, än att priset fortsätter upp.
Metaller
Veckans huvudtema har varit dollarns styrka å ena sidan och eurons och kronans å den andra. De amerikanska siffrorna fortsätter att överraska på uppsidan, i veckan både med BNP och NFP. Detta ökar i sin tur en eventuell start av nedtrappning av den monetära stimulansen i USA redan i december eller åtminstone tidigare än diskonterats. ECB sänkte som väntat (men uppenbarligen som en överraskning för några) styrräntan till 0.25%. Detta gav också en försvagning av europeiska valutor och en förstärkning av dollarn i veckan. ECB gjorde detta eftersom inflationen så tydligt är på väg nedåt och för att arbetslösheten i EU är så hög och ”hållbar”.
Så nu är vi i den något förvirrande situationen, där starka siffror i USA är negativt för metallpriserna, såsom uttryckta i dollar. Som vi har sagt tidigare att vi tror att detta är en kortsiktig effekt och att tillväxtutsikterna kommer att ta över, förr eller senare . Ännu viktigare för metallefterfrågan är naturligtvis Kina, varifrån vi såg viss uppmuntrande handelsstatistik. Viktigast var högre export, vilket är en indikation på bättre efterfrågan utanför Kina. I helgen började kommunistpartiet fyra dagars plenum, vilket förväntas ge information om hur ledarskapet kommer att stödja konjunkturen.
I Genève gör helgens förhandlingar om Irans nukleära program framsteg i skrivande stund . Ett avtal skulle ha en potentiellt baissig effekt på oljepriset, även om de inledande samtalen mellan parterna redan har gett ett negativt bidrag till oljeprisets utveckling de senaste veckorna.
Koppar
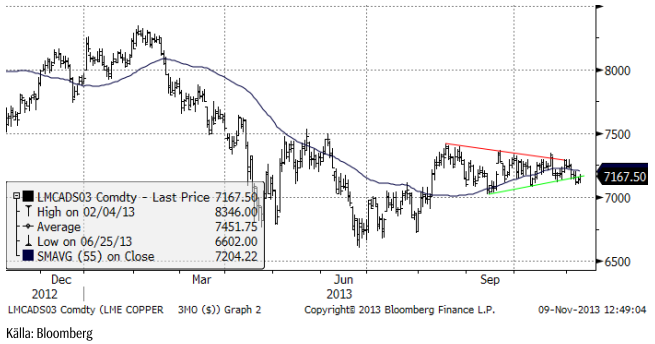
Koppar kunde inte stå emot den starka dollarn och priserna testade den nedre delen av intervallet i veckan som gick. Det såg ut som det skulle vara ett allvarligt test på nedsidan, men den tekniskt föranledda försäljningen blev väl absorberad av handelns intresse. Den kinesiska handelsbalansen i veckan visade en nedgång i importen av raffinerad koppar och halvfabrikat med 11% från föregående månad. Detta var dock inte oväntat på grund av den tidigare höga importen av koncentrat (som med befintlig raffinaderikapacitet lätt skulle kunna producera tillräckligt av koppar). Statistik i lördags visade en högre industriproduktion än väntat och att inflationen låg inom regeringens mål, bör ge stöd till marknaden den kommande veckan.
Aluminium
LME har godkänt de föreslagna ändringarna i sin lagerverksamhet för att minska köerna. Dessutom har LME meddelat vissa ändringar av förslaget. Minskningen i köerna siktar nu på att komma ner till 50 snarare än 100 kalenderdagar. Dessutom kommer LME att utreda och agera för att motiverka lagerhusföretagens incitament, som bidrar till att det bildas kö för att hämta ut material från lagren. LME har också sagt att de kommer att beställa en fullständig extern logistisk översyn av LME:s lagersystem.
Den samlade bedömningen efter tillkännagivandet var åt det baissiga hållet, speciellt när det gäller den fysiska premien (över LME:s börspris). Det finns dock diskussioner om att lagerhållarna kommer att öka hyran som kompensation! När det gäller priset skulle man kunna resonera att om LME:s förändringar gör det lättare att få ut tidigare ”låst” material, kan det leda till prispress. De flesta bedömare påpekar doch att så länge räntorna är låga och det är contango i terminsmarknaden, kommer materialet bara att flyttas till andra lager.
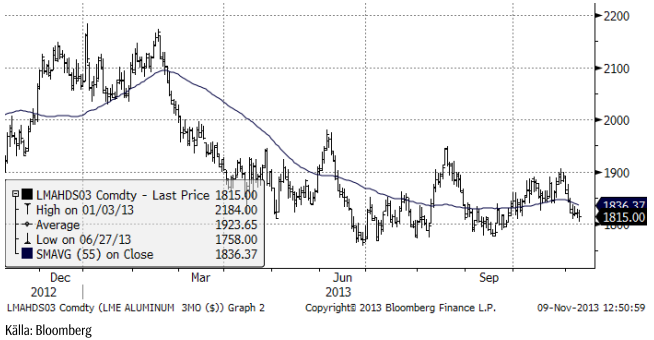
Dollarns styrka under veckan har satt tydlig press på priset (noterat i dollar). Efter fredagens NFP testades det långsiktiga stödet vid $ 1800, men det höll. Vi anser att stödet är tillräckligt starkt för att hålla marknaden i prisintervallet $ 1800 – $ 1900.
Vi har neutral rekommendation.
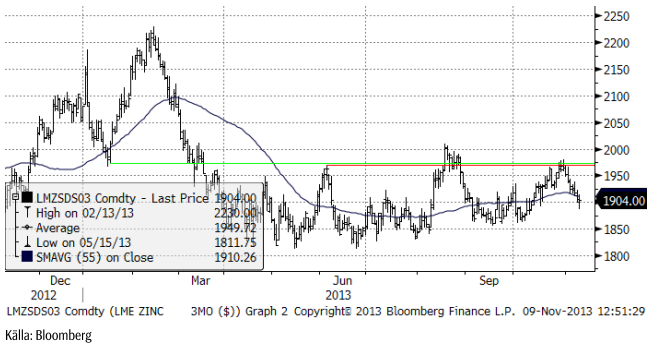
Zink
Det finns inte så mycket att rapportera om zink den här veckan. Priset följde den allmänna trenden och avslutar veckan med ett allvarligt test av nedsidan i det senaste prisintervallet. Tekniskt bestod marknaden ett styrkeprov i fredags när det tekniska stödet på $ 1886 testades ”spot on”, för att följas av ett ”upp-ställ” vid stängningen.
Nickel
Nickel föll kraftigare än resten av basmetallkomplexet under veckan som gick. Prisintervallet är bredare för nickel än för de andra basmetallerna, liksom volatiliteten i priset. Med det överskott som finns, kan man inte utesluta risken för ett test till på nedsidan. Men mot bakgrund av den allmänna bedömningen av marknaden för industrimetaller, tror vi att många kommer att passa på att köpa om ett gynnsamt pris skulle komma.
Vi anser att marknaden redan har diskonterat en kompromisslösning beträffande den indonesiska exporten eller exportförbudet, när den ska träda i kraft nästa år. En online ”survey” gjord av Metal Bulletin i frågan, visade att 44% av de svarande väntade sig en höjning av exportskatten istället för ett totalförbud. 26% ansåg att exportförbudet kommer att skjutas upp. 21% tror att exportförbudet kommer att införas, som beslutat, medan 9% av de svarande inte tror att den indonesiska regeringen kommer att förhindra exportmöjligheterna alls. Vi får alltså tolka dessa svar från industriella aktörer på marknaden, som att en stor majoritet av dem tror att utbudet av billig laterit nickelmalm kommer att fortsätta vara tillgänglig på ett eller annat sätt.
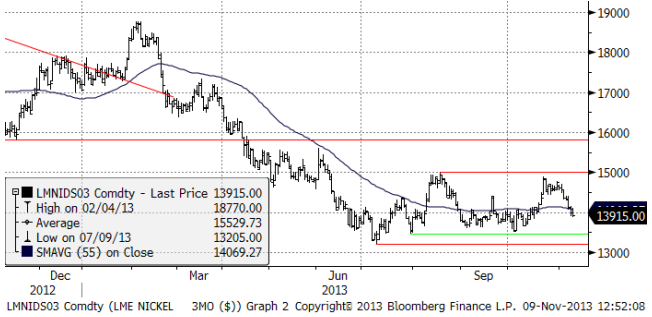
Vår grundsyn att man bör försöka köpa nickel och rekommenderar köp av NICKEL S, i synnerhet om priset kommer ner mot 13,500 dollar per ton. Priset (cash och 3 månaders termin, som vi alltid avser), går att följa på www.basemetals.com
Guld & Silver
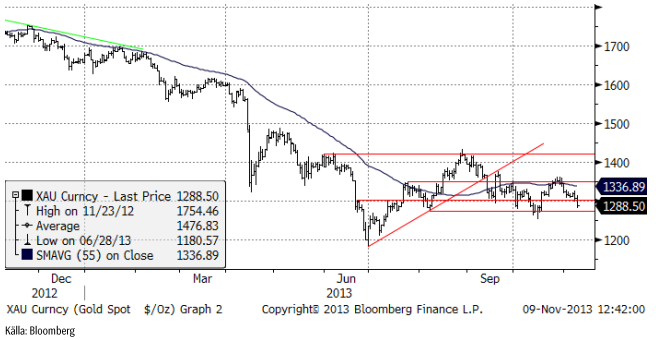
Guldpriset (i dollar) har de senaste månaderna handlats i ett intervall mellan 1250 och 1350. Med den senaste veckans starka dollar har priset (såsom noterat i dollar) fallit och stängde nästan på dagslägsta i fredags, som också var den svagaste handelsdagen för guld under veckan.
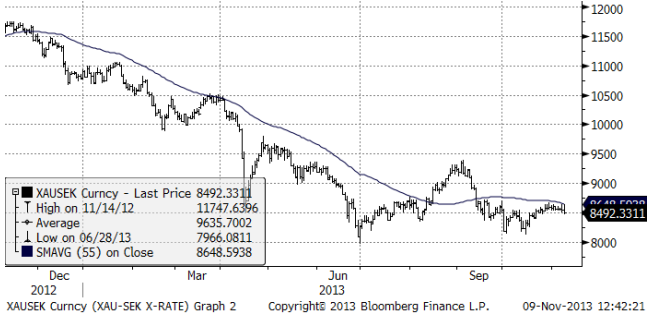
I termer av kronor, har priset hållit sig stabilt, med endast marginella prisrörelser under veckan. Vi ser kursdiagrammet på priset i kronor för ett troy uns nedan. Notera att vi inte har någon teknisk köpsignal, men vi har ett tekniskt stöd vid 8000 kr. Trenden är fortfarande nedåtriktad.
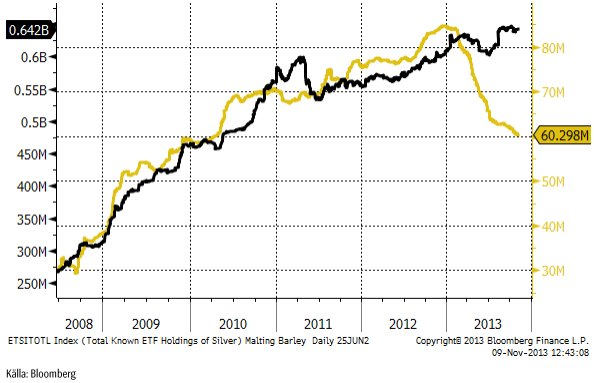
I diagrammet nedan ser vi antalet uns som innehas av börshandlade fonder. Den gula kurvan avser guld och den svarta silver. Vi ser att investerare fortsätter att likvidera sina likvida börshandlade fonder på guld. I och för sig är det anmärkningsvärt att priset inte faller, trots att säljtrycket från investerare är så starkt. I klassisk litteratur om marknadsanalys, finns resonemang om vad som händer efter ett stort kursfall. Det sägs att ägandet flyttas från ”svaga händer” till ”starka” i en process som kallas för ”konsolidering”. Det är möjligt att det är detta som håller på att ske nu. Många som köpt börshandlade fonder på guld har kanske gjort det utan särskilt mycket annan analys än att priset verkar gå upp (dvs tidigare) och nu säljer de för att priset verkar gå ner.
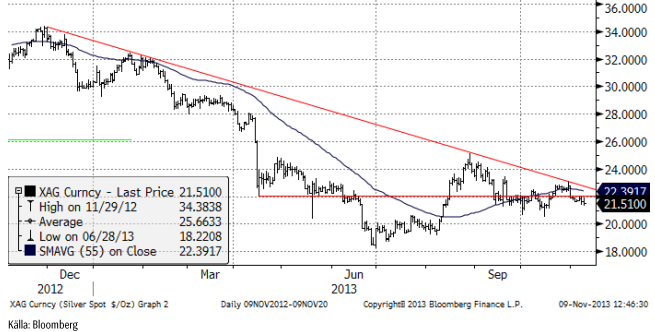
Nedan ser vi kursdiagrammet för silver i dollar per troy ounce. Vi noterar att den fallande trendlinjen / motståndet från toppen för ett år sedan, inte har brutits och att marknaden inte lyckades bryta igenom den. När sådana test misslyckas brukar det ofta leda till besvikelse, med kursfall som följd.
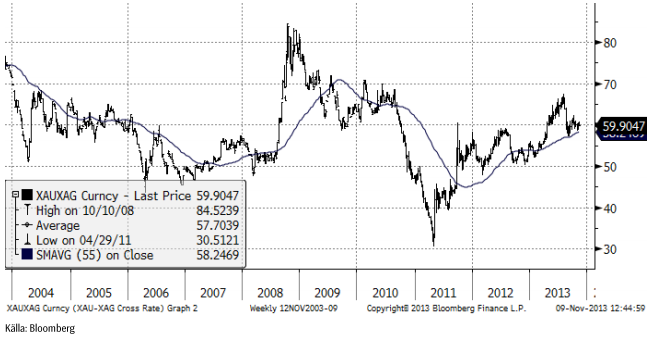
Silver handlas i relation till guld på 59.9, dvs guld är 59.9 gånger dyrare per uns än silver. Det är en hög nivå i ett historiskt perspektiv och ett resultat av allmänt fallande priset på guld och silver. Silver tar alltid ut svängarna mer än vad guld gör. Om prisnedgången fortsätter finns alltså risk att silver faller mer än guld och att silver blir ännu billigare i det historiska perspektivet.
Vi fortsätter att vara neutrala guld och silver.
Platina & Palladium
SEB:s certifikat PLATINA S steg med 1% i veckan och PALLADIUM S steg med 4%. Tekniskt ser vi att platina hittills inte lyckats gå igenom den fallande motstånds/trendlinjen. Risken för besvikelse är uppenbar.
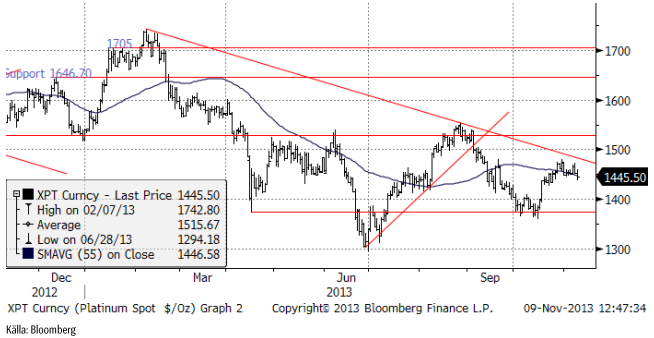
Detsamma gäller marknaden för palladium, som utvecklats mycket starkt den senaste tiden. Priset är uppe på nivåer i toppen på på det prisintervall som varit rådande det senaste året. Den kortsiktiga trenden är uppåtriktad, men motstånden kan få den trenden att ta slut.
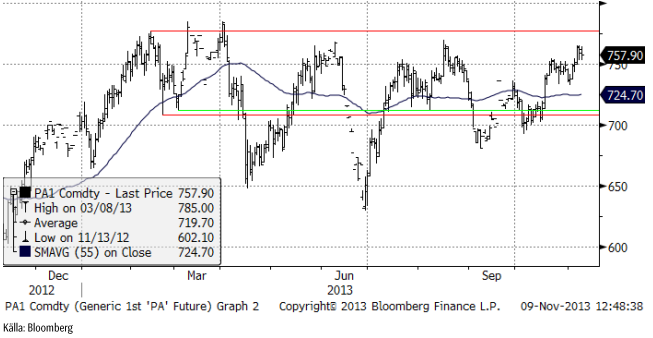
Pga de motstånd som finns, väljer vi att i alla fall för tillfället gå över till neutral rekommendation på platina och palladium.
Kaffe
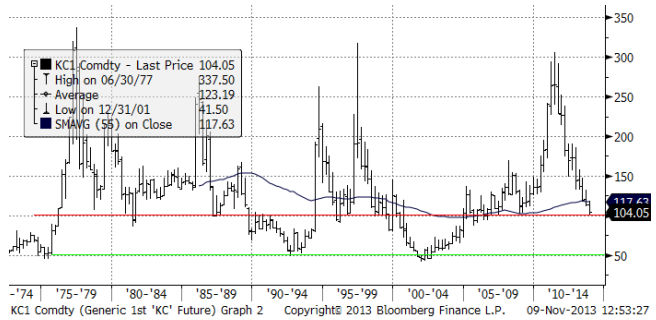
Kaffepriset föll ner mot 100 cent per pund i veckan, men fick stöd där. Nivån 100% har de senaste 40 åren varit en stödnivå. När priset kommit uppifrån har trenden i regel vänt upp. Räkna gärna själv hur många gånger det har hänt!
Den absoluta bottennivån har dock legat på 50 cent, vilket är ett djup som förskräcker om man köpt strax över 100.
Vi tror dock att det kan komma en rekyl från den här nivån, som åtminstone bör kunna ta upp priset till 150 cent. Eftersom trenden ännu inte vänt, vill vi dock inte rekommendera konkret ”köp”.
Nedan ser vi det senaste årets prisutveckling i mars-kontraktet på arabica i New York. Flera marknadsbedömare har tyckt sig känna igen den ”blow-out” som ofta sker när de sista tappar sugen, i den senaste tidens nedgång från 120 till 105 cent.
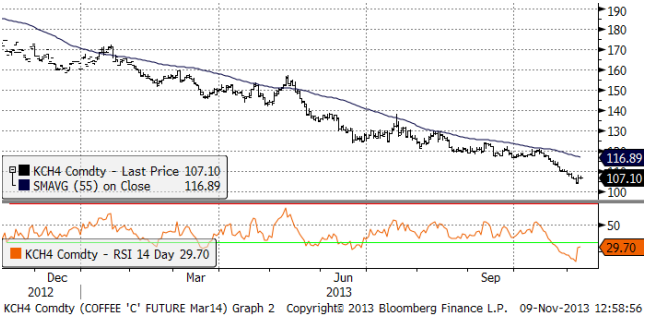
Vi behåller tills vidare neutral rekommendation, tills vi ser tecken på ett trendbrott.
[box]SEB Veckobrev Veckans råvarukommentar är producerat av SEB Merchant Banking och publiceras i samarbete och med tillstånd på Råvarumarknaden.se[/box]
Disclaimer
The information in this document has been compiled by SEB Merchant Banking, a division within Skandinaviska Enskilda Banken AB (publ) (“SEB”).
Opinions contained in this report represent the bank’s present opinion only and are subject to change without notice. All information contained in this report has been compiled in good faith from sources believed to be reliable. However, no representation or warranty, expressed or implied, is made with respect to the completeness or accuracy of its contents and the information is not to be relied upon as authoritative. Anyone considering taking actions based upon the content of this document is urged to base his or her investment decisions upon such investigations as he or she deems necessary. This document is being provided as information only, and no specific actions are being solicited as a result of it; to the extent permitted by law, no liability whatsoever is accepted for any direct or consequential loss arising from use of this document or its contents.
About SEB
SEB is a public company incorporated in Stockholm, Sweden, with limited liability. It is a participant at major Nordic and other European Regulated Markets and Multilateral Trading Facilities (as well as some non-European equivalent markets) for trading in financial instruments, such as markets operated by NASDAQ OMX, NYSE Euronext, London Stock Exchange, Deutsche Börse, Swiss Exchanges, Turquoise and Chi-X. SEB is authorized and regulated by Finansinspektionen in Sweden; it is authorized and subject to limited regulation by the Financial Services Authority for the conduct of designated investment business in the UK, and is subject to the provisions of relevant regulators in all other jurisdictions where SEB conducts operations. SEB Merchant Banking. All rights reserved.

Market is starting to take US/Iran headlines with a pinch of salt. Brent crude rose $2.8/b yesterday to an official close of $112.1/b. But after that it traded as low as $108.05/b before ending late night at around $109.7/b. Through the day it traded in a range of $106.87 – 112.72/b amid a flurry of news or rumors from Iran and the US. ”US temporary sanctions during negotiations” (falls alarm). ”We will bomb Iran” (not anyhow),… etc. While the market is still fluctuating to this kind of news flow, it is starting to take such headlines with a pinch of salt.

We’ll see. Maybe, maybe not. The Brent M1 contract is trading at $110.2/b this morning which very close to the average ticks through yesterday of $110.4/b.
Trump with bearish, verbal intervention whenever Brent trades above $110/b it seems. What seems to be a pattern is that Trump states something like ”very good negotiations going on with Iran”, ”New leaders in Iran are great,..”, ”Great progress in negotiations,…”, ”Deal in sight,..” etc whenever the Brent M1 contract trades above $110/b. An effort to cool the market. These hot air verbal interventions from Trump used to have a heavy bearish impact on prices, but they now seems to have less and less effect unless they are backed by reality.
As far as we can see there has been no real progress in the negotiations between the US and Iran with both sides still standing by their previous demands.
Iran is getting stronger while the cease fire lasts making a return to war for Trump yet harder. Iran is naturally in constant preparation for a return to war given Trump’s steady threats of bombing Iran again. Iran is naturally doing what ever is possible to prepare for a return to war. And every day the cease fire lasts it is better prepared. This naturally makes it more and more difficult and dangerous for the US to return to warring activity versus Iran as the consequences for energy infrastructure in the Persian Gulf will be more and more severe the longer the cease fire lasts. Israel seems to see it this way as well. That the war is not won and that current frozen state of a cease fire gives Iran opportunity to rebuild military and politically.
Global inventories are drawing down day by day. How much? In the meantime the Strait of Hormuz stays closed. There is varying measures and estimates of how much global inventories are drawing down. Our rough estimate, back of the envelope, is that global inventories are drawing down by at least some 10 mb/d or about 300 mb/d in a balance between loss of supply versus demand destruction. Other estimates we see are a monthly draw of 250-270 mb/d. The IEA only ’measured’ a draw in global observable stocks of 117 mb in April with oil on water rising 53 mb while on shore stocks fell 170 mb. But global stocks are hard to measure with large invisible, unmeasured stocks. As such a back of the envelope approach may be better.
Oil products is what the world is consuming. Oil product prices likely to rise while product stocks fall. Strategic Petroleum Reserves (SPR) are predominantly crude oil. Discharging oil from OECD SPR stocks, a sharp reduction in Chinese crude imports and a reduction in global refinery throughput of 6-7 mb/d has helped to keep crude oil markets satisfactorily supplied. But global inventories are drawing down none the less. And oil products is really what the world is consuming. So if global refinery throughput stays subdued, then demand will eventually have to match the supply of oil products. The likely path forward this summer is a steady draw down in jet fuel, diesel and gasoline. Higher prices for these. Then, if possible, higher refinery throughput and higher usage of crude in response to very profitable refinery margins. And lastly sharper draw in crude stocks and higher prices for these. But some 6 mb/d of oil products used to be exported through the Strait of Hormuz. And it may not be so easy to ramp up refinery activity across the world to compensate. Especially as Ukraine continues to damage Russian refineries as well as Russian crude production and export facilities.
Watch oil product stocks and prices as well as Brent calendar 2027. What to watch for this summer is thus oil product inventories falling and oil product premiums to crude rising. Another measure to watch is the Brent crude 2027 contract as it rises steadily day by day as the Strait of Hormuz stays closed and global oil inventories decline. The latter is close to the highest level since the start of the war and keeps rising.
The Brent M1 contract and the Brent 2027 prices and current price of jet fuel in Europe (ARA). All in USD/b

Our back of the envelope calculation of the global shortage created by the closure of the Strait of Hormuz. Note that 3.5 mb/d of discharge from SPR is also a draw. Note also that ’Forced demand loss’ of 2.5 mb/d is probably temporary and will fall back towards zero as logistics are sorted out leaving ’Price demand loss’ to do the job of balancing the market. Thus a shortfall of at least 9 mb/d created by the closure. More if SPR discharge is included and more if Forced demand loss recedes.

Brent is climbing higher. Front-month is at USD 106.3/bl this morning, close to a weekly high and a USD 9/bl jump from Mondays open. This is the move we flagged as a risk earlier in the week: the market shifting from ”a deal is around the corner” to ”this is going to take longer than we thought”.

Analyst Commodities, SEB
During April, rest-of-year Brent remained remarkably stable around USD 90/bl. A stability which rested on one single assumption: the SoH reopens around 1 May. That assumption is now slowly falling apart.
As we highlighted yesterday: every week of delay beyond 1 May adds (theoretically) ish USD 5/bl to the rest-of-year average, as global inventories draw 100 million barrels per week. i.e., a mid-May reopening implies rest-of-year Brent closer to USD 100/bl, and anything pushing into June or July takes us meaningfully higher.
What’s changed in the last 48 hours:
#1: The US military has formally warned that clearing suspected sea mines from SoH could take up to six months. That is a completely different timescale from what the financial market is pricing. Even a political deal tomorrow does not immediately reopen the strait.
#2: Trump has shifted his tone from urgency to ”strategic patience”. In yesterday’s press conference: ”Don’t rush me… I want a great deal.” The market is reading this as a president no longer feeling pressured by timelines, with the naval blockade running in the background.
#3: So far, the military activity is escalating, not de-escalating. Axios reports Iran is laying more mines in SoH. The US 3rd carrier strike group (USS George H.W. Bush) is arriving with two countermine vessels. Trump yesterday ordered the US Navy to destroy any Iranian boats caught laying mines. While CNN reports that the Pentagon is actively drawing up plans to strike Iranian SoH capabilities and individual Iranian military leaders if the ceasefire collapses. i.e., NOT a attitude consistent with an imminent deal!
Spot crude and product prices eased off the early-April highs on a combination of system rerouting and deal optimism. Both now weakening. Goldman estimates April Gulf output is reduced by 14.5 mbl/d, or 57% of pre-war supply, a number that keeps getting worse the longer this drags on.
Demand-side adaptation is ongoing: S. Korea has cut its Middle East crude dependence from 69% to 56% by pulling more from the Americas and Africa, and Japan is kicking off a second round of SPR releases from 1 May. But SPRs are finite.
Ref. to the negotiations, we should not bet on speed. The current Iranian leadership is dominated by genuine hardliners willing to absorb economic pain and run the clock to extract concessions. That is not a setup for a rapid resolution. US/Israeli media briefings keep framing the delay as ”internal Iranian divisions”, the reality is more complicated and points toward weeks and months, not days.
Our point is that the complexity is large, and higher prices have only just started (given a scenario where the negotiations drag out in time). The market spent April leaning on the USD 90/bl rest-of-year assumption; that case is diminishing by the hour. If ”early May reopening” is replaced by ”June, July or later” over the next week or two, both crude and products have meaningful room to reprice higher from here. There is a high risk being short energy and betting on any immediate political resolution(!).
Down on Friday. Up on Monday. The Brent June crude oil contract traded down 5.1% last week to a close of $90.38/b. It reached a high of $103.87/b last Monday and a low of $86.09/b on Friday as Iran announced that the Strait of Hormuz was fully open for transit. That quickly changed over the weekend as the US upheld its blockade of Iranian oil exports while Iran naturally responded by closing the SoH again. The US blew a hole in the engine room of the Iranian ship TOUSKA and took custody of the ship on Sunday. Brent crude is up 5.6% this morning to $95.4/b.
The cease-fire is expiring tomorrow. The US has said it will send a delegation for a second round of negotiations in Islamabad in Pakistan. But Iran has for now rejected a second round of talks as it views US demands as unrealistic and excessive while the US is also blocking the Strait of Hormuz.
While Brent is up 5% this morning, the financial market is still very optimistic that progress will be made. That talks will continue and that the SoH will fully open by the start of May which is consistent with a rest-of-year average Brent crude oil price of around $90/b with the market now trading that balance at around $88/b.
Financial optimism vs. physical deterioration. We have a divergence where the financial market is trading negotiations, improvements and resolution while at the same time the physical market is deteriorating day by day. Physical oil flows remain constrained by disrupted flows, longer voyage times and elevated freight and insurance costs.
Financial markets are betting that a US/Iranian resolution will save us in time from violent shortages down the road. But every day that the SoH remains closed is bringing us closer to a potentially very painful point of shortages and much higher prices.
The US blockade is also a weapon of leverage against its European and Asian allies. When Iran closed the SoH it held the world economy as a hostage against the US. The US blockade of the SoH is of course blocking Iranian oil exports. But it is also an action of disruption directed towards Europe and Asia. The US has called for the rest of the world to engaged in the war with Iran: ”If you want oil from the Persian Gulf, then go and get it”. A risk is that the US plays brinkmanship with the global oil market directed towards its European and Asian allies and maybe even towards China to force them to engage and take part. Maybe unthinkable. But unthinkable has become the norm with Trump in the White House.


Sommarväder skapar prisrally på elbörsen
Oil product price pain is set to rise as the Strait of Hormuz stays closed into summer

Solkraften pressar elpriserna dagtid

Michel Gubel ger sin syn på oljemarknaden