

Analys
SEB – Råvarukommentarer, 10 februari 2014

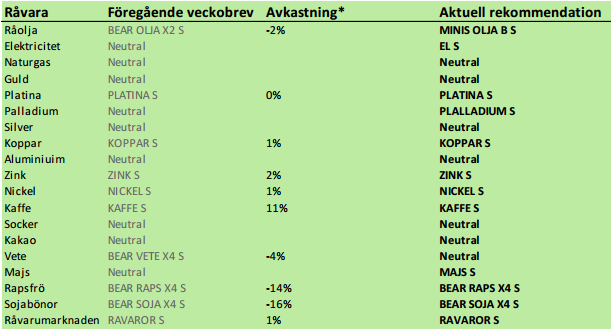
Rekommendationer
Inledning
Prisuppgången på kaffe, drivet av torkan i Minas Gerais, som vi skrev om för två veckor sedan, har ökat priset på våra två mini futures med 103 respektive 129%.
Våg två av rapporter – om skadorna – börjar komma nu. Regn är på väg och det kan bli en anledning för marknadsaktörer att ta hem vinster och en rekyl nedåt i priset. Uttömd markfukt, skador på kaffeträden och skador på skörden, gör dock att det finns förutsättningar för en längre ”bull market” i kaffe. Läs mer under kaffe-avsnittet.
Amerikansk arbetsmarknadsstatistik, som publicerades i fredags, var oväntat svag. Antalet nyanställda var 113,000 personer, väsentligt under 180,000 som marknaden väntat sig. Förra månaden var det 75,000 mot väntade nästan 200,000. Medan januaris statistik sågs som en ”glitch”, kan man nu inte bortse från siffrorna. USA:s ekonomi växer inte alls som FED förutsatte när de inledde sin nedtrappning av penningmängdsexpansionen (tapering) strax före Jul. Marknaden tänker sig nu att FED ska minska takten på sin ”tapering” eller rentav ta tillbaka den minskning som gjorts. Vi ska dock komma ihåg att FED:s tro att mer pengar i cirkulation ska ha en effekt på realekonomin inte delas av alla ekonomer. Monetarister menar att mer pengar endast försämrar pengarnas köpkraft, förr eller senare. Non-Farm Payrolls statistiken fick WTI-oljan att stiga över 100 dollar för första gången i år och drog med sig brent-oljan upp. Guldet påverkades dock inte alls.
Basmetallerna koppar och zink börjar uppvisa positiva tecken. Lagren faller, terminsmarknaden går mer in i backwardation och tekniskt har de köpsignaler. Det ser inte lika positivt ut för aluminium, men nickel som är väl understödd tekniskt kan få draghjälp av koppar och zink.
Vi går över till köprekommendation på majs och går över till neutral på vete. Det amerikanska jordbruksdepartementet publicerar sina månatliga estimat på utbud och efterfrågan på spannmål och oljeväxter i USA och i resten av världen ikväll klockan 18. Analytiker väntar sig en ”bullish” rapport.
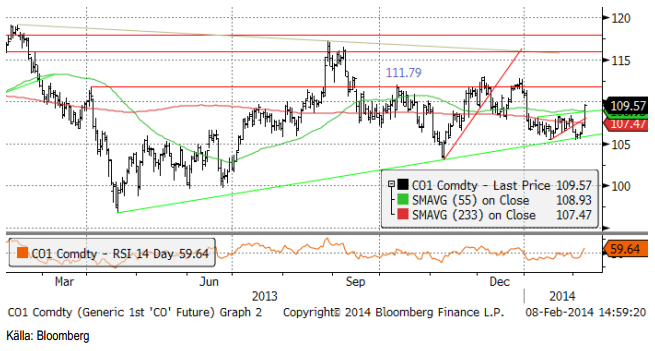
Råolja – Brent
Oljepriset steg kraftigt i fredags kväll. Marknaden gjorde tolkningen att FED kommer att vara mer expansiv och göra mindre ”tapering” än de tidigare annonserat, efter att arbetsmarknadsstatistiken återigen varit oväntat svag. Prisuppgången i fredags beror sannolikt på att några som satsat stort på ett trendbrott nedåt, valde att köpa tillbaka sina korta positioner. Fundamentalt i världen talar balanserna för ett trendbrott, men det blev inte nu. Det återigen ganska höga priset är dock en ny bra startpunkt för en kort position i oljepriset.
Amerikansk råolja ”WTI”, har de senaste veckorna haft stöd av den extrema kylan i landet, som gjort att diesellagren nu är på sin lägsta nivå på 10 år. I USA ställer raffinaderierna nu om för sommarproduktion. Det innebär att efterfrågan på råolja är låg fram till april. Råoljelagren kommer att öka under den här tiden, vilket gör att marknaden blir orolig. Nuförtiden finns en pipeline, Keystone South, som förbinder Cushing i Oklahoma med Gulfkusten. Lagren har inte ökat i Cushing, däremot har de ökat tre veckor i rad vid gulfkusten. När dessa lager nu är fulla, kommer överskottet att lagras i Cushing och hamna i den DOE-statistik som alla på marknaden följer.
Det har varit en bristsituation på diesel, inte minst pga efterfrågan på eldningsolja i USA. Under våren kommer ny dieselkapacitet i drift om 700,000 fat. Raffinaderikapaciteten ligger i Asien, men den ökade produktionen av diesel på global basis lättar ändå trycket på den amerikanska och europeiska marknaden.
Vi har sett WTI handla upp mot Brent, men med ovanstående kunskaper i bakfickan, tror vi att WTI kommer att falla. Gulf-crudes kommer under press och det sätter i sin tur brentoljan under press.
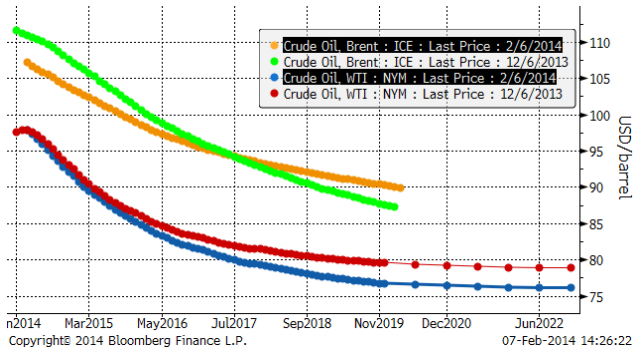
Terminskurvorna har rört sig på ett mycket intressant sätt de senaste två månaderna. I diagrammet nedan ser vi att Brent (de två övre) har fått en flackare terminskurva. Den korta änden har fallit samtidigt som den långa gått upp. Det är ett tecken på större utbud av olja nu. Den amerikanska WTI-oljan har däremot hamnat ännu mer i backwardation. De längre kontrakten har fallit kraftigt, och i kontrast till brentoljan. Bakom ligger ökade förväntningar på att skifferoljan kommer att öka i betydelse. Samtidigt har inte spotpriset på amerikansk råolja rört sig alls. Orsaken är naturligtvis det kalla vädret, som hållit efterfrågan uppe. Priset för ett fat råolja i USA år 2019 (om fem år) är 15 dollar lägre än priset på ett fat Brent.
Fracking är till 99% en amerikansk företeelse, men USA har bara 9% av alla hittills kända skifferoljeresurser på jorden. Det är rimligt att tänka sig att den här tekniken kommer att sprida sig. Brent ser mot det perspektivet alldeles för dyrt ut. Fracking är idag lönsamt ner till ett oljepris på 45 dollar. Utvecklingen går snabbt. De tre senaste åren har producerad volym per borr rigg trefaldigats, vilket i princip är detsamma som att kostnaden minskat till en tredjedel. Teknikutvecklingen går rasande snabbt. Naturligtvis kommer takten i teknikutvecklingen att avta, men å andra sidan har den geografiska spridningen av tekniken börjat.
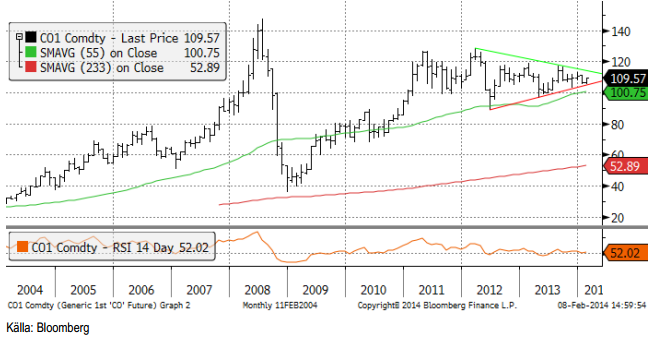
Vi ser i månadsdiagrammet nedan, att ett brott nedåt (eller uppåt, också en möjlighet) inte är långt borta.
Vi rekommenderar en kort position i oljepriset, t ex med BEAR OLJA X2 S eller mini future ”MINIS OLJA B S”. ”MINIS OLJA B S” har stopp-loss vid 115 dollar per fat. Den ökar med 79% i värde om oljepriset faller med 10%.
Elektricitet
Elpriset bröt rekylen uppåt i slutet av januari och föll ner till årsskiftets bottennivå vid 28.50 euro för en vecka sedan. Därifrån en rekyl upp till 30 euro, där priset vände ner i fredags. Ett nytt test av stödet vid 28.50 verkar troligt ur teknisk synvinkel.
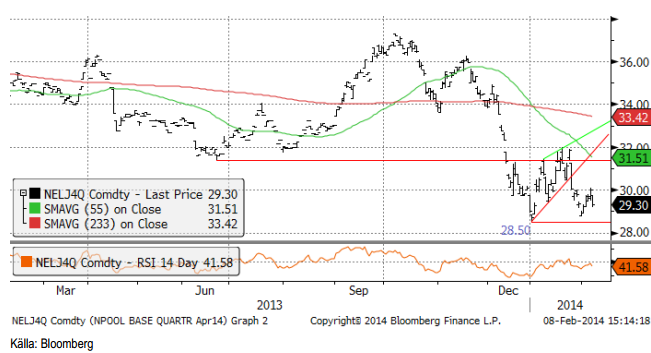
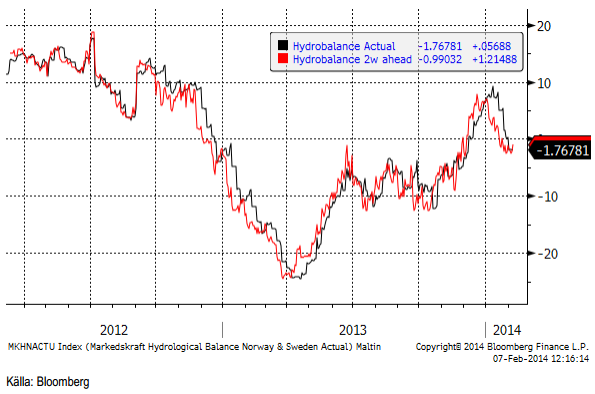
Prognosen för hydrologisk balans har legat still den senaste veckan på -1.8 TWh. För Norden som helhet är magasinfyllnaden 55.1% och det ska jämföras med medianvärdet som är 58.1% för vecka 5. Elanvändningen i Sverige var åt det låga hållet i veckan som gick, 3.4 TWh där de senaste 20 årens intervall varit 3.2 – 3.8 TWh. Elproduktionen var 3.8 TWh. Kärnkraften gick på 95% av den installerade effekten i Norden. Det är endast Oskarshamn 2 som är avstängd, liksom tidigare.
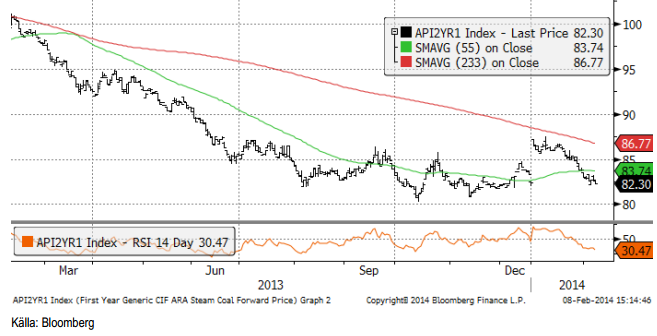
Terminspriset för leverans av kol nästa år har fallit från 87 dollar till 82.30. Priset är alltså tillbaka på bottennivåerna från oktober. Priset ligger under produktionskostnaden för gruvorna i Australien, Sydamerika och Kanada. Den australiensiska dollar har under samma period fallit med 8% mot US-dollarn, så där är en av förklaringarna till varför kolpriset inte har stigit i US-dollartermer.
Den 6 februari fattade EU beslut om att tillhandahålla utsläppsrätter för 400 miljoner ton mindre än tidigare planerade 300 miljoner ton. Det kallas för ”backloading”. Dels minskar utbudet av utsläppsrätter redan i år med 100 miljoner ton, vilket var oväntat mycket och dels är den politiska signalen till marknaden central. EU vill att marknaden ska finnas kvar och att priset ska vara signfikant. Ett pris på 5 euro per ton, där priset låg fram till mitten av januari var uppenbarligen för lågt för EU:s politiker. Vi tror inte att dagens pris på 6.59 euro per ton är den prisnivå som EU tänker på, utan snarare 10 euro och kanske 15 euro. Det är helt tydligt nu att marknaden för utsläppsrätter INTE är en fri marknad, utan en politiskt styrd marknad, där den politiska styrningen är avgörande för priset.
Allt annat lika skulle en fördubbling av priset på utsläppsrätter ge ett elpris som är 33% högre.
EU fattade också beslut om att slopa de nationella målen för minskningen i CO2-utsläpp. Frankrike, Tyskland, Italien och Spanien har alla, liksom Sverige, förbundit sig att minska utsläppen med 40% till 2013 och 80% till 2050. Detta behöver de inte göra längre, utan minskningen ska ske på EU-nivå, heter det. EU politikerna i Bryssel kallar det för ”flexibilitet”. Det innebär i praktiken att det är fritt fram för dessa länder att brassa på med kolkraft, givet att man har utsläppsrätter. Den nye tyske finansministern Sigmar Gabriel har sagt att de förnybara energikällorna har blivit en ”albatross runt halsen på industrin” så att de kan leda till en ”avindustrialisering” av Tyskland. Förbundskansler Angela Merkel har tidigare sagt att en för stor andel förnybar elproduktion kan leda till problem med energitillförseln.
Vi tycker att priset på el kommit ner så långt att vi väljer att gå tillbaka till en köprekommendation. Då volatiliteten är hög och vi tror att den kommer att fortsätta att vara det, är inte BULL-certifikat bäst, utan EL S eller om man vill ta mer risk, en ”mini long” mini future. Bäst är att försöka köp om terminspriset kommer ner mot 28.50. Går priset under 28.50 måste man dock gå ur (stop loss).
Naturgas
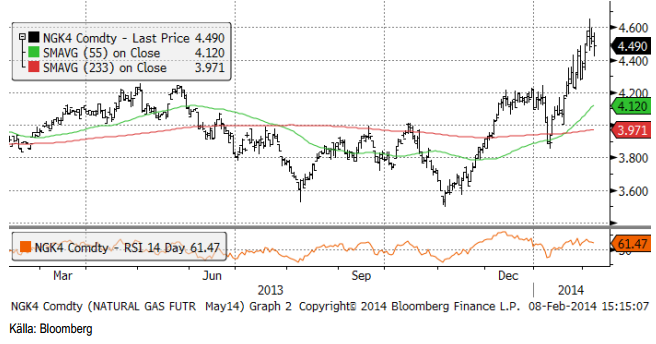
Ordentligt kallt väder i USA har ökat efterfrågan på gas och minskat lagren, vilket får ytterligare kallt väder att direkt påverka priset. Sedan början på november har priset på maj-terminen gått upp med 1 hel dollar från 3.60 per MMBtu till 4.60.
Koppar
Koppar, liksom andra basmetaller, köptes upp inför årsskiftet och det hotande exportstoppet av malm från Indonesien. Det var ett klassiskt fall av ”buy on rumour, sell on fact”. Priset föll tillbaka, men inte hela vägen ner. Tekniskt har vi en köpsignal sedan uppgången i december. Rekylen nedåt ska därför betraktas som ett köptillfälle.
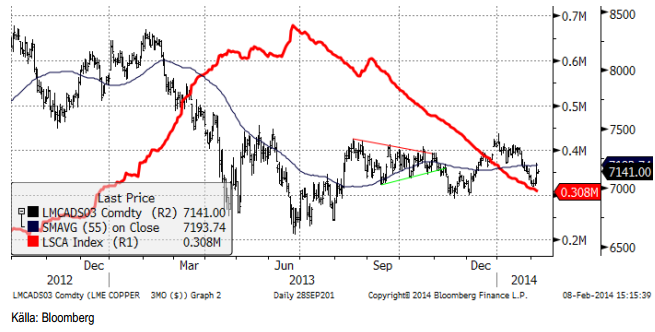
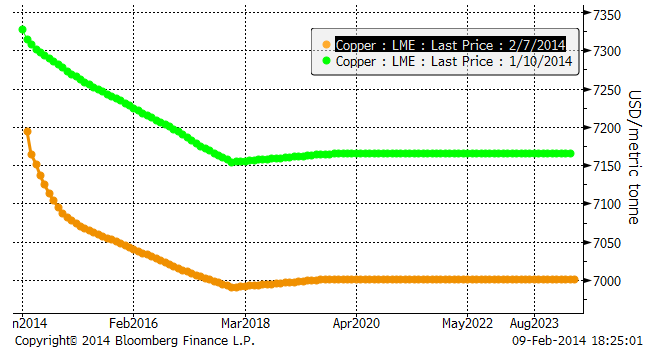
Efterfrågan på koppar i världen är större än utbudet, vilket visar sig i de fallande lagren på LME. Lagret på 308,000 ton är på en nivå där det tidigare talats om brist på material. Även terminskurvan uppvisar tilltagande tecken på brist. Sedan den 10 januari, en månad sedan, ligger priserna visserligen lägre, men graden av backwardation har ökat. Det är ett ”bullish” tecken. Den som investerar i koppar nu via terminsmarknaden kan förvänta sig stigande pris och kan också göra investeringen i terminer som handlas till rabatt i förhållande till spotpriset. Vi ser detta i terminskurvorna nedan (10 januari och i fredags 7 februari).
Vi rekommenderar köp av KOPPAR S.
Aluminium
Aluminium, den svagaste bland basmetallerna, föll under den tekniska stödnivån under januari. Sedan dess har priset rekylerat upp, samtidigt som lagren sjunkit. Vi skulle ändå inte vilja köpa aluminium än.
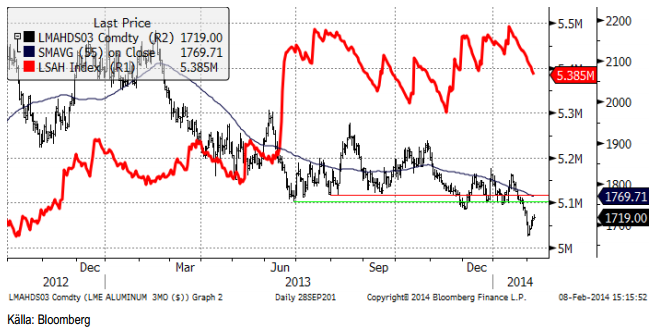
Vi fortsätter med neutral rekommendation på aluminium.
Zink
Priset på zink rekylerade ner till stödnivån vid 1950 dollar och vände sedan uppåt i veckan. Lagren fortsätter att rasa i en skrämmande takt. Lagren är visserligen fortfarande stora, men i den här takten når de noll om drygt ett år.
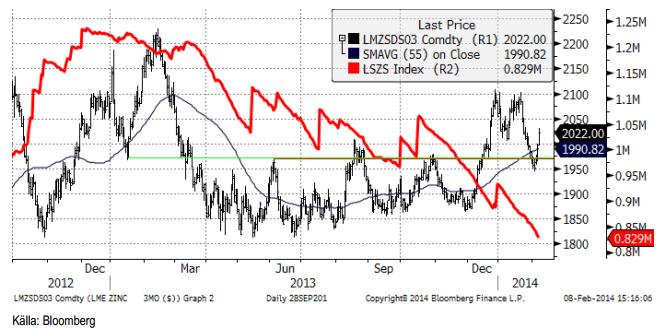
Vi rekommenderar köp av ZINK S eller BULL ZINK X4 S.
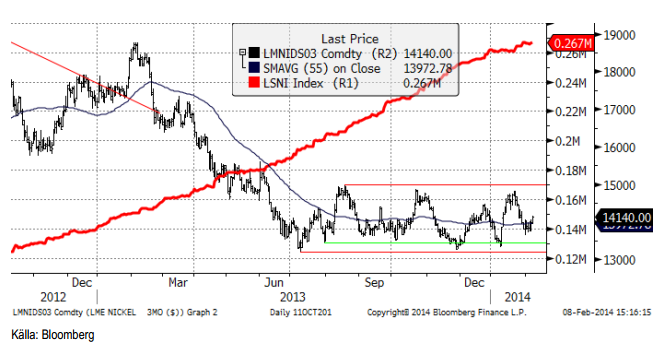
Nickel
Lagren av nickel fortsätter att öka, trots exportstoppet av malm från Indonesien. Priset verkar vara väl understött, men motståndet vid 15000 dollar per ton har inte brutits än och såsom lagersituationen utvecklar sig är nickel inte lika ”bullish” som koppar och zink. Just nu ligger dock nickelpriset på tekniskt stöd vid 14,140 dollar och bör kunna gå upp till 15,000 dollar. En köpt position i BULL NICKEL X4 S bör kunna ha goda möjligheter att bli en lönsam placering, givet detta.
Guld
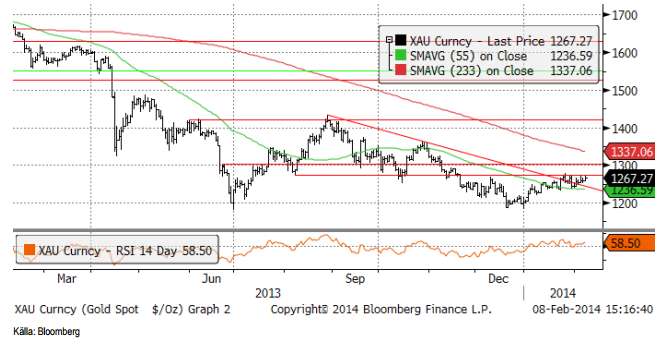
Guldet borde ha reagerat med stigande pris efter Non-Farm Payrolls, som råoljepriset gjorde. Nu lyckades inte guldmarknaden handla positivt, när den borde det, och det är ett negativt tecken. Priset ligger precis under ett tekniskt stöd på 1270, som det inte lyckats ta sig över den senaste månaden.
Fysiska handlare av investeringsguld säger att de sålt lika mycket hittills i år som under hela förra året. Skrotningen av gamla smycken har helt torkat upp, dels för att priset är så lågt och dels antagligen för att reserverna hos folk har tömts. På den fysiska sidan, i alla fall i Sverige, är efterfrågan på fysiskt guld alltså stark, samtidigt som utbudet av skrot minskat kraftigt. För att par år sedan var skrotningen av smycken i Sverige mycket större än efterfrågan på guld, investeringsguld inräknat. Detta ser nu helt annorlunda ut.
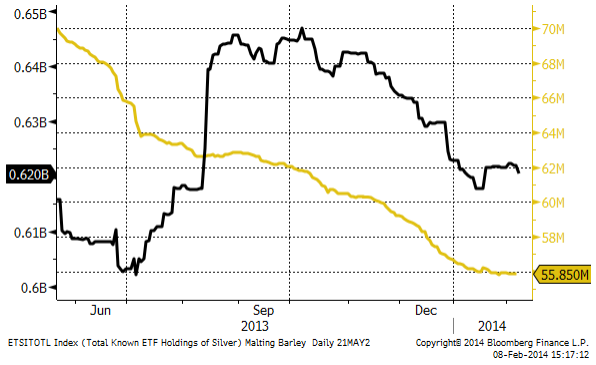
Det ökande intresset för att köpa investeringsguld syns även i ETF-statistiken. Fondernas innehav av guld har slutat minska från mitten av januari och kurvan har planat ut vid 56 miljoner uns.
Vi fortsätter tills vidare med neutral vy på guld. Tecknen på en vändning till det positiva har ökat, men det är negativt att priset inte steg på NFP-statistiken i fredags.
Silver
Silver fortsätter att ligga under ett tekniskt motstånd. Priset är har också gott stöd på nedsidan. Som vi sett ovanför fortsätter placerare att sälja andelar i börshandlade fonder på silver, men detta tycks inte ha någon negativ effekt på priset.
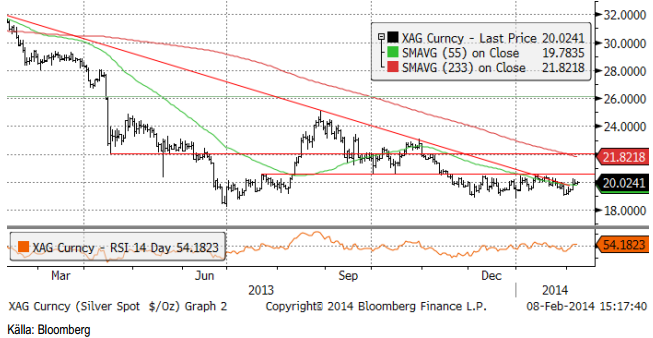
Vi fortsätter med neutral vy på silver, till dess vi får en tydlig teknisk signal.
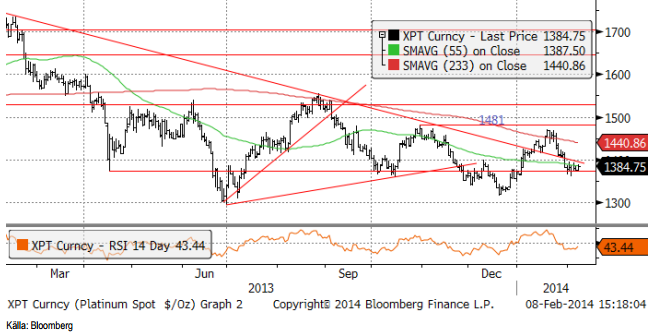
Platina & Palladium
Platina orkade inte över det tekniska motståndet vid 1481 dollar och vände ner till det tekniska stödet, som hittills har hållit. Vi tycker att det här är ett köptillfälle.
Palladium föll också tillbaka och stängde i fredags på 708.8 cent. Vi tycker att palladium är köpvärt på den här nivån.
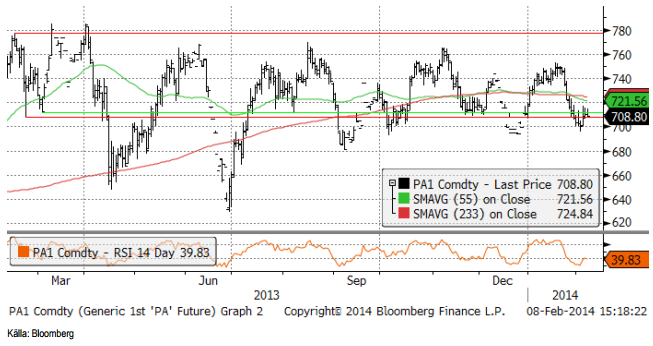
Vi rekommenderar alltså köp av både platina och palladium.
Kaffe
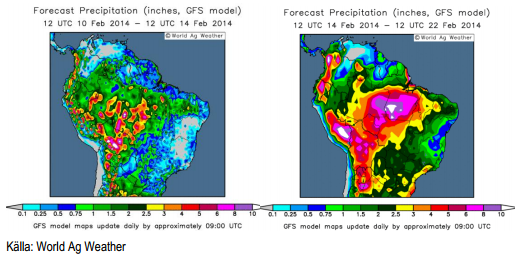
För två veckor kunde du här läsa utförligt om torkan i de brasilianska delstaterna Minas Gerais och Espirito Santo, som är centrum för kaffeproduktionen i landet och därmed i världen. Torkan har fortsatt och det är klart att årets kommande skörd blir mindre än förväntat. Det talas också om att nästa års skörd också kommer att påverkas, i kanske ännu större utsträckning. I fredags kom dock de första väderleksrapporterna med nederbörd för området. Somar Meteorologia skrev i en emailad rapport i fredags att torkan kommer att bestå under den första halvan av februari. Därefter kommer de kallfronter som finns över Argentina och Uruguay att röra sig norrut och med kallare väder och nederbörd.
Vi ser skillnaden mellan prognosticerad nederbörd för perioden 10 – 12 februari respektive 14 – 22 februari. I den vänstra (fram till 14 februari) är det mycket blått över Minas Gerais och Espirito Santo, vilket betyder extremt lite nederbörd. I bilden till höger är det mer grönt och gult, som indikerar 1 – 3 tum nederbörd.
Förra årets skörd som var klar i oktober var enligt CONAB 49.2 miljoner säckar (om 60 Kg). Årets skörd har estimerats till 48.3 miljoner säckar, men det står klart att torkan kommer att minska det. Ett odlingskooperativ i Brasilien som heter Cooparaiso säger att deras skörd kan hamna på 2.7 – 2.8 miljoner säckar istället för 3 miljoner. Om vi överför den minskningen på 8.5% till hela Brasilien skulle det innebära att skörden blir 44.2 miljoner säckar istället för 48.3.
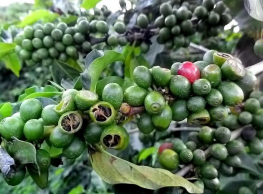 Det finns dock andra rapporter, som pekar på en ännu lägre skörd. I södra Minas Gerais finns rapporter om fenomenet som kallas ”Coracao Negro”, eller ”svart hjärta. När man delar på kaffebären finns där två små vissnade, torkade och svarta bönor, som inte duger för att göra kaffe av. En lantbrukare, intervjuad av Bloomberg, sade berättade att han trodde att skörden skulle bli minst 30% mindre än normalt. Förra året hade han sålt hela sin skörd – i år ingenting, eftersom han inte vet om han kommer att ha något att sälja. Nedanför ser vi en bild på ”Coracao Negro”.
Lantbrukarna hade ställt in sig på att priset skulle bli lågt. Därför beskar man träden innan blomningen i oktober. Torkan har dock gjort att de beskurna träden inte växer. I de fält som har nyplanterats har plantorna vissnat i.
Normalt sett är det regnperiod fram till april och därefter torrt fram till september. I Minas Gerais har det inte regnat sedan december och det är mycket ovanligt. Det innebär att markfukten, reserverna som behövs under april till september, inte finns där. För att återställa markfukten behöver det regna mycket mer än normalt fram till dess.
Nedan ser vi ett diagram på skörden i Brasilien i antal miljoner säckar. Arabica i Brasilien är en ”vartannatårsgröda”. Gröna år är de med hög skörd och röda de med lägre. Skörden i somras (mellan april och oktober) var en skörd som var lägre, men rekordhög för att vara en sådan. Det pressade priset på kaffe förra året. Årets skörd ska vara en hög, men förutspåddes i januari av CONAB att bli lägre än förra årets skörd. Det var innan torkans effekt uppmärksammades. Den blåa stapeln längst till höger, visar en 9% lägre skörd (som torkan kan medföra).
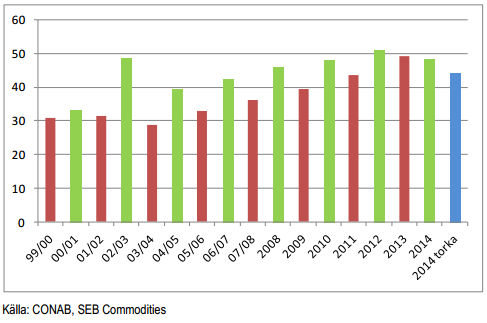
En skörd på 9% innebär att globala lager, allt annat lika, inte ökar som tidigare väntat, utan stannar på samma nivå. Blir skörden ännu lägre, som vi har sett att det finns indikationer på, blir lagren lägre. Effekten av torkan är inte heller begränsad till en skörd och ett år, utan kommer att ha en effekt på produktionen även nästa år.
Priset på kaffe rusade upp när informationen om torkan väl sjönk in (långt efter att du kunde läsa om det här för två veckor sedan). Priset gick från 113 cent den 27 januari till 144.15 i torsdags den 6 februari. Vi ska komma ihåg att produktionskostnaden ligger på 147 cent i år, enligt en rapport från USDA. Medan priset ännu ligger under produktionskostnaden är det trots allt så att det strukturellt råder överproduktion av kaffe på global basis. På kort sikt tycker vi att kaffepriset är fullvärderat och vi tror att marknaden kommer att ta hem vinster.
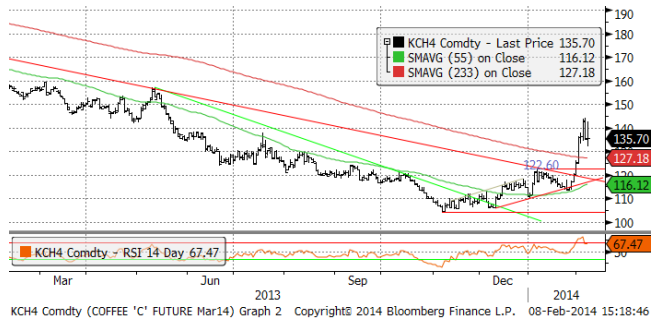
På lite längre sikt än det allra mest kortsiktiga, tror vi att kaffeprisets fallande trend är slut och att effekten av torkan i Brasilien har skyndat på vändningen i kaffemarknaden. På lite längre sikt rekommenderar vi köp av kaffe. I nedanstående diagram ser vi prisutvecklingen de senaste tio åren. Kan man köpa på ca
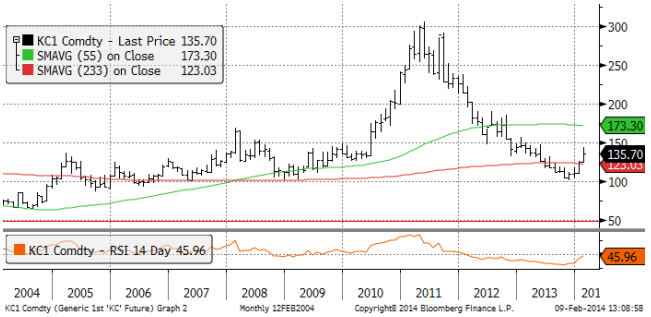
Vi rekommenderar att man tar hem sina vinster på mycket kort sikt och försöker köpa ner mot 130 cent. En rekyl nedåt kan vara förestående, föranlett av såväl kommande nederbörd som vinsthemtagningar och i så fall ta ner priset till 122 – 127 cent, men i en stark marknad kanske priset inte når ner dit. Generellt sett behåller vi köprekommendationen på kaffe.
Det finns nu också mini futures från SEB på kaffe, som erbjuder högre hävstång.
Se även analysbrevet på övriga jordbruksråvaror från SEB.
[box]SEB Veckobrev Veckans råvarukommentar är producerat av SEB Merchant Banking och publiceras i samarbete och med tillstånd på Råvarumarknaden.se[/box]
Disclaimer
The information in this document has been compiled by SEB Merchant Banking, a division within Skandinaviska Enskilda Banken AB (publ) (“SEB”).
Opinions contained in this report represent the bank’s present opinion only and are subject to change without notice. All information contained in this report has been compiled in good faith from sources believed to be reliable. However, no representation or warranty, expressed or implied, is made with respect to the completeness or accuracy of its contents and the information is not to be relied upon as authoritative. Anyone considering taking actions based upon the content of this document is urged to base his or her investment decisions upon such investigations as he or she deems necessary. This document is being provided as information only, and no specific actions are being solicited as a result of it; to the extent permitted by law, no liability whatsoever is accepted for any direct or consequential loss arising from use of this document or its contents.
About SEB
SEB is a public company incorporated in Stockholm, Sweden, with limited liability. It is a participant at major Nordic and other European Regulated Markets and Multilateral Trading Facilities (as well as some non-European equivalent markets) for trading in financial instruments, such as markets operated by NASDAQ OMX, NYSE Euronext, London Stock Exchange, Deutsche Börse, Swiss Exchanges, Turquoise and Chi-X. SEB is authorized and regulated by Finansinspektionen in Sweden; it is authorized and subject to limited regulation by the Financial Services Authority for the conduct of designated investment business in the UK, and is subject to the provisions of relevant regulators in all other jurisdictions where SEB conducts operations. SEB Merchant Banking. All rights reserved.

Market is starting to take US/Iran headlines with a pinch of salt. Brent crude rose $2.8/b yesterday to an official close of $112.1/b. But after that it traded as low as $108.05/b before ending late night at around $109.7/b. Through the day it traded in a range of $106.87 – 112.72/b amid a flurry of news or rumors from Iran and the US. ”US temporary sanctions during negotiations” (falls alarm). ”We will bomb Iran” (not anyhow),… etc. While the market is still fluctuating to this kind of news flow, it is starting to take such headlines with a pinch of salt.

We’ll see. Maybe, maybe not. The Brent M1 contract is trading at $110.2/b this morning which very close to the average ticks through yesterday of $110.4/b.
Trump with bearish, verbal intervention whenever Brent trades above $110/b it seems. What seems to be a pattern is that Trump states something like ”very good negotiations going on with Iran”, ”New leaders in Iran are great,..”, ”Great progress in negotiations,…”, ”Deal in sight,..” etc whenever the Brent M1 contract trades above $110/b. An effort to cool the market. These hot air verbal interventions from Trump used to have a heavy bearish impact on prices, but they now seems to have less and less effect unless they are backed by reality.
As far as we can see there has been no real progress in the negotiations between the US and Iran with both sides still standing by their previous demands.
Iran is getting stronger while the cease fire lasts making a return to war for Trump yet harder. Iran is naturally in constant preparation for a return to war given Trump’s steady threats of bombing Iran again. Iran is naturally doing what ever is possible to prepare for a return to war. And every day the cease fire lasts it is better prepared. This naturally makes it more and more difficult and dangerous for the US to return to warring activity versus Iran as the consequences for energy infrastructure in the Persian Gulf will be more and more severe the longer the cease fire lasts. Israel seems to see it this way as well. That the war is not won and that current frozen state of a cease fire gives Iran opportunity to rebuild military and politically.
Global inventories are drawing down day by day. How much? In the meantime the Strait of Hormuz stays closed. There is varying measures and estimates of how much global inventories are drawing down. Our rough estimate, back of the envelope, is that global inventories are drawing down by at least some 10 mb/d or about 300 mb/d in a balance between loss of supply versus demand destruction. Other estimates we see are a monthly draw of 250-270 mb/d. The IEA only ’measured’ a draw in global observable stocks of 117 mb in April with oil on water rising 53 mb while on shore stocks fell 170 mb. But global stocks are hard to measure with large invisible, unmeasured stocks. As such a back of the envelope approach may be better.
Oil products is what the world is consuming. Oil product prices likely to rise while product stocks fall. Strategic Petroleum Reserves (SPR) are predominantly crude oil. Discharging oil from OECD SPR stocks, a sharp reduction in Chinese crude imports and a reduction in global refinery throughput of 6-7 mb/d has helped to keep crude oil markets satisfactorily supplied. But global inventories are drawing down none the less. And oil products is really what the world is consuming. So if global refinery throughput stays subdued, then demand will eventually have to match the supply of oil products. The likely path forward this summer is a steady draw down in jet fuel, diesel and gasoline. Higher prices for these. Then, if possible, higher refinery throughput and higher usage of crude in response to very profitable refinery margins. And lastly sharper draw in crude stocks and higher prices for these. But some 6 mb/d of oil products used to be exported through the Strait of Hormuz. And it may not be so easy to ramp up refinery activity across the world to compensate. Especially as Ukraine continues to damage Russian refineries as well as Russian crude production and export facilities.
Watch oil product stocks and prices as well as Brent calendar 2027. What to watch for this summer is thus oil product inventories falling and oil product premiums to crude rising. Another measure to watch is the Brent crude 2027 contract as it rises steadily day by day as the Strait of Hormuz stays closed and global oil inventories decline. The latter is close to the highest level since the start of the war and keeps rising.
The Brent M1 contract and the Brent 2027 prices and current price of jet fuel in Europe (ARA). All in USD/b

Our back of the envelope calculation of the global shortage created by the closure of the Strait of Hormuz. Note that 3.5 mb/d of discharge from SPR is also a draw. Note also that ’Forced demand loss’ of 2.5 mb/d is probably temporary and will fall back towards zero as logistics are sorted out leaving ’Price demand loss’ to do the job of balancing the market. Thus a shortfall of at least 9 mb/d created by the closure. More if SPR discharge is included and more if Forced demand loss recedes.

Brent is climbing higher. Front-month is at USD 106.3/bl this morning, close to a weekly high and a USD 9/bl jump from Mondays open. This is the move we flagged as a risk earlier in the week: the market shifting from ”a deal is around the corner” to ”this is going to take longer than we thought”.

Analyst Commodities, SEB
During April, rest-of-year Brent remained remarkably stable around USD 90/bl. A stability which rested on one single assumption: the SoH reopens around 1 May. That assumption is now slowly falling apart.
As we highlighted yesterday: every week of delay beyond 1 May adds (theoretically) ish USD 5/bl to the rest-of-year average, as global inventories draw 100 million barrels per week. i.e., a mid-May reopening implies rest-of-year Brent closer to USD 100/bl, and anything pushing into June or July takes us meaningfully higher.
What’s changed in the last 48 hours:
#1: The US military has formally warned that clearing suspected sea mines from SoH could take up to six months. That is a completely different timescale from what the financial market is pricing. Even a political deal tomorrow does not immediately reopen the strait.
#2: Trump has shifted his tone from urgency to ”strategic patience”. In yesterday’s press conference: ”Don’t rush me… I want a great deal.” The market is reading this as a president no longer feeling pressured by timelines, with the naval blockade running in the background.
#3: So far, the military activity is escalating, not de-escalating. Axios reports Iran is laying more mines in SoH. The US 3rd carrier strike group (USS George H.W. Bush) is arriving with two countermine vessels. Trump yesterday ordered the US Navy to destroy any Iranian boats caught laying mines. While CNN reports that the Pentagon is actively drawing up plans to strike Iranian SoH capabilities and individual Iranian military leaders if the ceasefire collapses. i.e., NOT a attitude consistent with an imminent deal!
Spot crude and product prices eased off the early-April highs on a combination of system rerouting and deal optimism. Both now weakening. Goldman estimates April Gulf output is reduced by 14.5 mbl/d, or 57% of pre-war supply, a number that keeps getting worse the longer this drags on.
Demand-side adaptation is ongoing: S. Korea has cut its Middle East crude dependence from 69% to 56% by pulling more from the Americas and Africa, and Japan is kicking off a second round of SPR releases from 1 May. But SPRs are finite.
Ref. to the negotiations, we should not bet on speed. The current Iranian leadership is dominated by genuine hardliners willing to absorb economic pain and run the clock to extract concessions. That is not a setup for a rapid resolution. US/Israeli media briefings keep framing the delay as ”internal Iranian divisions”, the reality is more complicated and points toward weeks and months, not days.
Our point is that the complexity is large, and higher prices have only just started (given a scenario where the negotiations drag out in time). The market spent April leaning on the USD 90/bl rest-of-year assumption; that case is diminishing by the hour. If ”early May reopening” is replaced by ”June, July or later” over the next week or two, both crude and products have meaningful room to reprice higher from here. There is a high risk being short energy and betting on any immediate political resolution(!).
Down on Friday. Up on Monday. The Brent June crude oil contract traded down 5.1% last week to a close of $90.38/b. It reached a high of $103.87/b last Monday and a low of $86.09/b on Friday as Iran announced that the Strait of Hormuz was fully open for transit. That quickly changed over the weekend as the US upheld its blockade of Iranian oil exports while Iran naturally responded by closing the SoH again. The US blew a hole in the engine room of the Iranian ship TOUSKA and took custody of the ship on Sunday. Brent crude is up 5.6% this morning to $95.4/b.
The cease-fire is expiring tomorrow. The US has said it will send a delegation for a second round of negotiations in Islamabad in Pakistan. But Iran has for now rejected a second round of talks as it views US demands as unrealistic and excessive while the US is also blocking the Strait of Hormuz.
While Brent is up 5% this morning, the financial market is still very optimistic that progress will be made. That talks will continue and that the SoH will fully open by the start of May which is consistent with a rest-of-year average Brent crude oil price of around $90/b with the market now trading that balance at around $88/b.
Financial optimism vs. physical deterioration. We have a divergence where the financial market is trading negotiations, improvements and resolution while at the same time the physical market is deteriorating day by day. Physical oil flows remain constrained by disrupted flows, longer voyage times and elevated freight and insurance costs.
Financial markets are betting that a US/Iranian resolution will save us in time from violent shortages down the road. But every day that the SoH remains closed is bringing us closer to a potentially very painful point of shortages and much higher prices.
The US blockade is also a weapon of leverage against its European and Asian allies. When Iran closed the SoH it held the world economy as a hostage against the US. The US blockade of the SoH is of course blocking Iranian oil exports. But it is also an action of disruption directed towards Europe and Asia. The US has called for the rest of the world to engaged in the war with Iran: ”If you want oil from the Persian Gulf, then go and get it”. A risk is that the US plays brinkmanship with the global oil market directed towards its European and Asian allies and maybe even towards China to force them to engage and take part. Maybe unthinkable. But unthinkable has become the norm with Trump in the White House.


Sommarväder skapar prisrally på elbörsen
Oil product price pain is set to rise as the Strait of Hormuz stays closed into summer

Solkraften pressar elpriserna dagtid

Michel Gubel ger sin syn på oljemarknaden