Analys
SEB – Jordbruksprodukter vecka 8, 2012
 Den senaste veckan har det varit små rörelser på marknaderna för jordbruksprodukter. Det betydande fallet i vetepriset efter den ”key reversal day” vi berättade om för två veckor sedan följdes av en liten rekyl uppåt i veckan som gått, men överlag står marknaderna för spannmål och väger, utan att vare sig köpare eller säljare har fått övertaget.
USDA:s Outlook Forum går av stapeln idag torsdag och på fredag och det väntas komma ny information från USDA från denna på fredag. Konferensen sänds som ”webinar” och mer om detta kan läsas på: www.usda.gov/oce/forum .”Plantings” väntas uppgå till 94 miljoner acres för majs, 74 miljoner acres för sojabönor och 56.5 miljoner acres för vete.
Informationen väntas allmänt av marknaden att vara ”bearish” för spannmål. Enligt USDA väntas amerikanska bönder så mest majs sedan 1944. Mer finns att läsa på Bloomberg.
Detsamma gäller sojabönor, men minutiösa gissningar om arealen för USAs areal om 1-2 miljoner acres måste förstås ställas mot skördeestimaten för Argentina som ligger på mellan 43 och 48 mt. Den skillnaden motsvarar nästan 5 miljoner acres.
Vete
Vi har haft en negativ tro på vetets prisutveckling framöver, främst baserat på att La Niña väntas klinga av. En stor del av ”marknaden” tycks dela vår negativa syn. Till bilden av betydande lager hör Australiens lagernivå som i januari uppgick till 25.6 mt. Kanada som de senaste två åren drabbats av översvämningar väntas i år inte råka ut för detta, eftersom det tvärtom är torrt.
Algeriet har annonserat en tender för leverans i maj på 125,000 ton. Frankrike väntas ta hem denna, men det är sannolikt den sista för säsongen och vi är bara i februari månad. Algeriet väntas importera 6.1 mt under 2011/12-säsongen som slutar i juni. Inköpen görs av Algeriets statliga Office Algerien Interprofessionnel de Cereales (”OAIC”).
 Trots att det ännu är tidigt och därmed svårt att uttala sig om och bedöma konsekvenserna för grödor utsatta för den extrema kylan som drabbade Europa, med temperaturer under -30 grader i vissa delar, gör franska Strategie Grains ett försök och säger att köldknäppen inte kommer att orsaka någon allvarligare skada utan enligt deras första analys ”så kommer kylan inte att leda till större bortfall än vid ett normalår” men att en viss risk kvarstår. Där skador uppstått kommer dessa dock att ersättas med vårgrödor och de justerar upp sitt estimat för majsproduktion med 300 000 ton till 62.6 mt, vilket fortfarande är en minskning med 4 procent jämfört med 2011. Estimatet för korn ökades med 100 000 ton till 54.6 mt vilket återspeglar förhoppningar om en ökad sådd av vårgrödor i Tjeckien och Slovakien. Prognosen för EU’s ”mjuka” veteproduktion i år justeras ned med 600 000 ton till 132.7 mt vilket fortfarande är en ökning med 3 procent jämfört med förra året och lägger man till durumvete så estimeras den totala veteproduktion till 141.5 mt. Nedjusteringen beror huvudsakligen på förändringar i areal.
Produktionen av spannmål och oljeväxter i Kanada 2012/13 förväntas bli något lägre än vad som estimerades för en månad sedan, men kommer att överstiga produktionen för 2011/12 enligt uppdaterad statistik från Ag Canada.
Produktionen avser de åtta huvudsakliga spannmålen och oljeväxterna och beräknas uppgå till 70.12 mt under 2012/13, en nedjustering från 70.32 mt i januari och en jämförelse med 65.85 mt 2011/12. I detta inkluderas canola, linfrö, sojabönor, vete, havre, korn, majs och råg.
Utgående lager för 2012/13 justeras ned till 11.70 mt (från 13.28 mt i januari) och den totala exporten för samma period estimeras till 33.27 mt, en liten ökning från förra månadens 33.04 mt.
Egyptens GASC har återigen köpt vete från USA, denna gång 180 000 ton. USA:s vete är just nu billigare än franskt, även med frakten beaktad.
Det amerikanska vetet har haft svårt att hävda sig under 2011/12 och förlorat marknadsandelar till i första hand Ryssland, eftersom ryskt vete flödat in på marknaden efter att exportförbudet hävdes förra sommaren, men har även haft svårt att konkurrera prismässigt med både Argentina och Frankrike.
I den senaste budgivningen fanns dock vare sig Ryssland eller Argentina med och det franska vetet som erbjöds var betydligt dyrare, trots högre fraktkostnad från USA till Egypten. Rysslands frånvaro denna gång kan troligtvis härledas till väderrelaterade logistik problem. Det är fruset i hamnarna och till och med lastade fartyg rapporteras ha svårt att segla ut.
Rysslands spannmålsexport har avtagit och uppgick endast till 250 000 ton under de två första veckorna i februari, en klar skillnad från en tidigare exporttakt på ungefär 2.8 mt per månad under 2011/12 fram till slutet på januari. Landet ska dock ha tillräckligt med spannmål för att täcka sitt eget behov och planerar därför att fortsätta med sin export som förväntas uppgå till 25 mt. Fram till idag har Ryssland exporterat ca 19.8 mt.
Ukraina har exporterat ca 600 000 ton spannmål, framförallt majs, de 15 första dagarna i februari till följd av den ovanligt stränga kylan och efter att regeringen bett handlare att vara restriktiva i sin export av vete. Det kan jämföras de 1.9 mt som exporterades under januari. Exporten av vete under första halvan av februari var lägre än 100 000 ton, jämfört med 540 000 ton under månaden innan.
Det sägs också att regeringen och landets spannmålshandlare nu har kommit överens om ett inofficiellt tak på 1.7 mt för export av vete under perioden februari till juli till följd av den svåra torkan i höstas. Med den begränsningen skulle den totala veteexporten komma att uppgå till 4.8 mt (jämfört med USDA’s prognos på 6.0 mt). Kazakstan räknar med en möjlig halvering av sin spannmålsskörd i år med en estimerad genomsnittlig nivå på 13-15 mt enligt landets jordbruksminister. Ett sådant resultat skulle ligga långt under de 27 mt spannmål som landet skördade förra året till följd av ett utmärkt väder under hela växtsäsongen, men det skulle fortfarande vara i linje med det 20-åriga genomsnittet. Vi har lite svårt att tolka detta påstående, eftersom Kazakstans jordbruksminister samtidigt påstår att arealen kommer att vara högre i år än förra året…. (Låter lite som ”Vremja” har återuppstått).
Pakistan kan komma att exportera upp till 1.5 mt vete i år, vilket matchar förra årets rekord, delvis tack vare en förväntad rekordskörd för tredje året i rad. Skörden förväntas uppgå till 24 mt ton i år, i stort sett oförändrad från förra året. Pakistan har en geografisk fördel i att exportera vete till Sydostasien och där kostnaderna för containerfrakt är försumbara. Landet var också en stor exportör förra året eftersom dess vete var bland det billigaste i världen under perioden maj-juli men exporten avtog efter att Ryssland hävde sitt exportförbud.
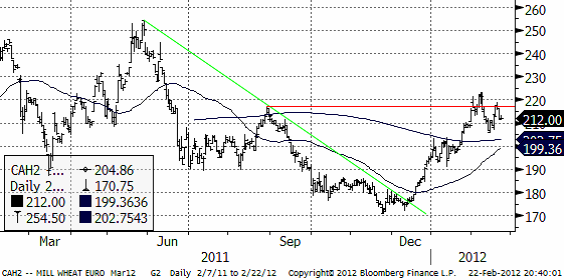
Nedan ser vi kursdiagrammet för marskontraktet på Matif. Uppgången den senaste veckan lyckades inte notera en ny toppnotering (över 225) och det får tolkas som ett svaghetstecken.
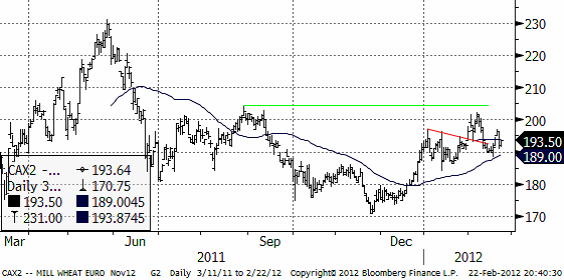
Nedan ser vi novemberkontraktet, som inte lyckats ta sig över huvudmotståndet på 205 euro per ton. Priset står och väger. 190 euro ser ut att utgöra ett förhållandevis starkt stöd och på ovansidan finns motståndet på 205. Just nu finns inga tecken på att marknaden på ett förestående utbrott från det här intervallet.
Maltkorn
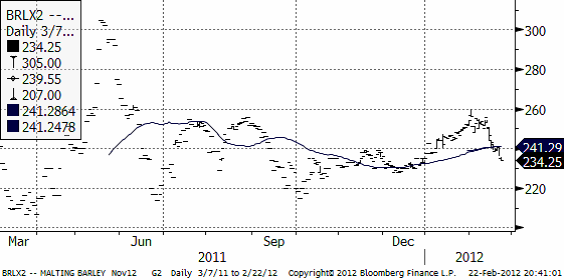
Maltkornet har handlats ner kraftigt. Tekniska stöd är brutna och nästa finns först nere på 220 euro för novemberleverans. Terminen handlas just nu i 234 euro.
Potatis
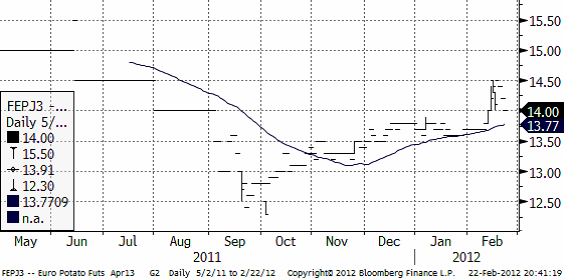
Priset på industripotatis steg upp till 14.50 euro för leverans i april 2013, men rekylerade sedan ner till 14 euro per deciton. Pristrenden är uppåtriktad.
Majs
Nederbörden i norra Argentina, Paraguay och södra Brasilien ligger på en normal nivå för den här årstiden. Torkan är historia och odlingsförhållandena har stabiliserats. Uruguay är dock fortfarande torrt.
Kina importerade 750 kt majs i januari och det är den högsta noteringen för månaden på 12 år. Spreaden mellan kinesiska priser och importpriser ligger på rekordnivåer. Det finns ett sug efter majs in mot Kina.
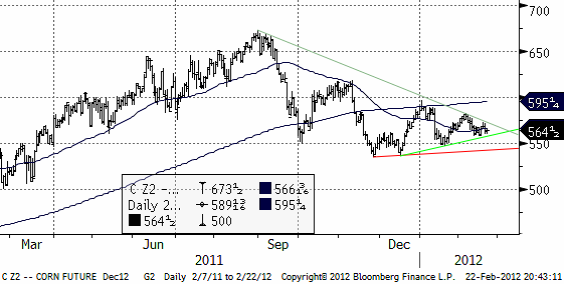
Nedan ser vi decemberkontraktet på majs på CBOT, där priserna bildat en klassisk ”triangelformation”. När priserna lämnar den, brukar detta vara starten på en större kursrörelse. Vi har trott och tror på fallande priser, men vill inte ta några positioner just nu, utan vill avvakta utbrottet ur triangeln. I synnerhet Kinas efterfrågan är ett stort frågetecken.
Sojabönor
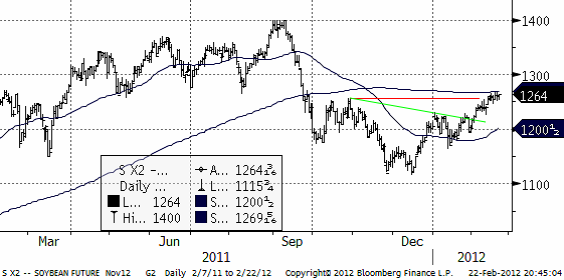
Sojabönorna gynnas av att vädret i Sydamerika har stabiliserats, eller rättare sagt, priset missgynnas. Priset har segat sig upp, efter att ha brutit en motståndslinje (den gröna i diagrammet nedan), men har inte på ett övertygande sätt gått över den röda motståndslinjen i diagrammet. Uppgången har förlorat momentum de senaste dagarna och det skulle kunna förebåda en kortsiktig rekyl nedåt.
Raps
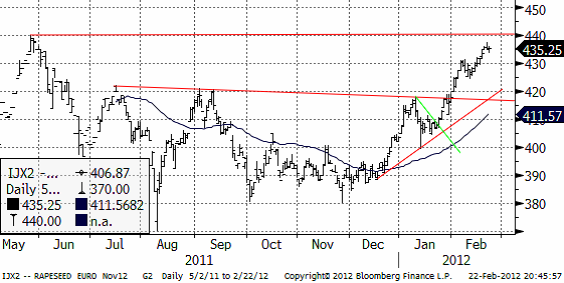
Novemberkontraktet har visat exceptionell styrka. Vi ser dock i diagrammet att priset nu ligger ganska nära 440 euro per ton. Detta är toppnoteringen från maj förra året och också en jämn siffra. Folk brukar hänga upp sina ”take profit” ordrar på jämna siffror. Av denna anledning tycker vi att det är ett utmärkt tillfälle att sälja terminer på novemberraps på dagens kursnivå om 435 euro.
Mjölk
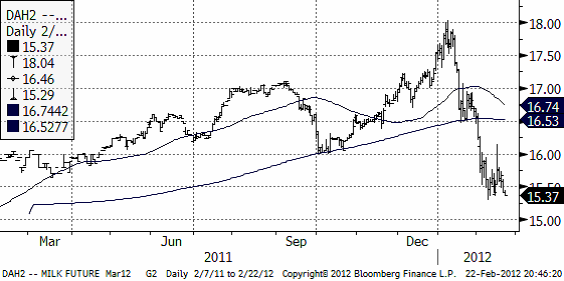
För två veckor sedan skrev vi att vi ansåg att prisfallet endast nått halvvägs och antog att fallet kunde nå 16. Det visade sig vara lite för försiktigt när vi nu ser att priset ligger på 15.37. Ser vi priset falla under februaris lägsta notering på marskontraktet finns potential att nå 15, men lejonparten av kursfallet bör vara över.
Gris
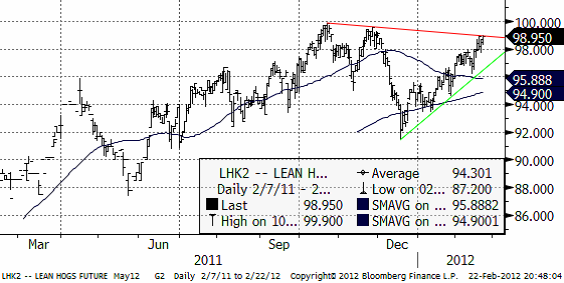
Priset på lean hogs som för majkontraktet nått 98.95 cent per pund, ligger precis under en motståndslinje (röd i diagrammet nedan). 100 cent borde vara ett hårt motstånd för priset att ta sig igenom. Det finns alltså gott om motstånd ansamlade precis ovanför dagens kurs. Om man måste välja, så väljer vi att vara sålda lean hogs här. Skulle priset bryta 100 måste vi omvärdera detta, naturligtvis.
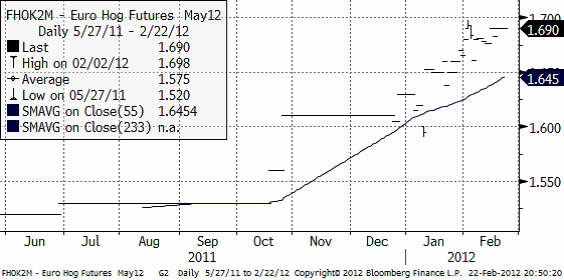
Priset i Europa har för majleverans stigit sedan i oktober och ligger nu på 1.69 euro per kilo. Bakom ligger bland annat eurons svaghet, men det förklarar inte allt. För ett år sedan var priserna så låga att bland annat svensk produktion inte bar sig. Med dagens priser är branschen vid vattenytan. Det fundamentala ”golvet” för priset ligger alltså bara precis under eller vid den här prisnivån, trots prisuppgången. Med det sagt, så är det ovanligt med en så lång prisuppgång utan rekyl och tyska priser ligger långt över amerikanska.
Valutor
EURSEK
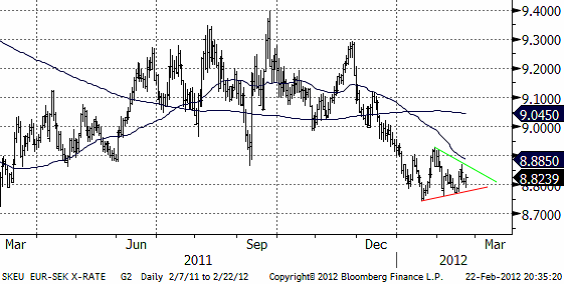
En ”triangelformation” har bildats sedan mitten av januari. Man bör invänta riktningen på utbrottet från den för att fatta beslut om att köpa eller sälja eursek.
8.70 har tidigare varit ett starkt ”golv” för växelkursen.
EURUSD
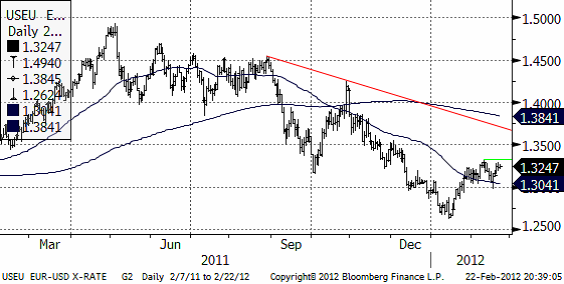
Kursen ligger inom ett intervall på 1.30 och 1.33.
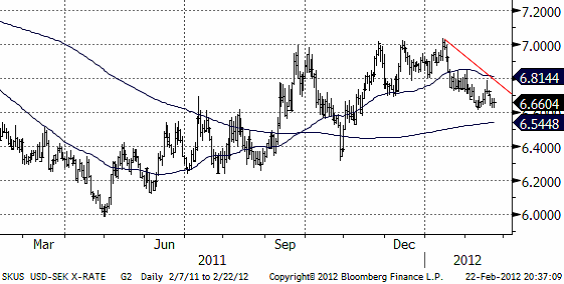
USDSEK
Dollarn ligger för närvarande i sjunkande trend.
[box]SEB Veckobrev Jordbruksprodukter är producerat av SEB Merchant Banking och publiceras i samarbete och med tillstånd på Råvarumarknaden.se[/box]
Disclaimer
The information in this document has been compiled by SEB Merchant Banking, a division within Skandinaviska Enskilda Banken AB (publ) (“SEB”).
Opinions contained in this report represent the bank’s present opinion only and are subject to change without notice. All information contained in this report has been compiled in good faith from sources believed to be reliable. However, no representation or warranty, expressed or implied, is made with respect to the completeness or accuracy of its contents and the information is not to be relied upon as authoritative. Anyone considering taking actions based upon the content of this document is urged to base his or her investment decisions upon such investigations as he or she deems necessary. This document is being provided as information only, and no specific actions are being solicited as a result of it; to the extent permitted by law, no liability whatsoever is accepted for any direct or consequential loss arising from use of this document or its contents.
About SEB
SEB is a public company incorporated in Stockholm, Sweden, with limited liability. It is a participant at major Nordic and other European Regulated Markets and Multilateral Trading Facilities (as well as some non-European equivalent markets) for trading in financial instruments, such as markets operated by NASDAQ OMX, NYSE Euronext, London Stock Exchange, Deutsche Börse, Swiss Exchanges, Turquoise and Chi-X. SEB is authorized and regulated by Finansinspektionen in Sweden; it is authorized and subject to limited regulation by the Financial Services Authority for the conduct of designated investment business in the UK, and is subject to the provisions of relevant regulators in all other jurisdictions where SEB conducts operations. SEB Merchant Banking. All rights reserved.
Analys
Crude oil soon coming to a port near you

Rebounding along with most markets. But concerns over solidity of Gaza peace may also contribute. Brent crude fell 0.8% yesterday to $61.91/b and its lowest close since May this year. This morning it is bouncing up 0.9% to $62.5/b along with a softer USD amid positive sentiment with both equities and industrial metals moving higher. Concerns that the peace in Gaza may be less solid than what one might hope for also yields some support to Brent. Bets on tech stocks are rebounding, defying fears of trade war. Money moving back into markets. Gold continues upwards its strong trend and a softer dollar helps it higher today as well.

US crude & products probably rose 5.6 mb last week (API) versus a normal seasonal decline of 2.4 mb. The US API last night partial and thus indicative data for US oil inventories. Their data indicates that US crude stocks rose 7.4 mb last week, gasoline stocks rose 3.0 mb while Distillate stocks fell 4.8 mb. Altogether an increase in commercial crude and product stocks of 5.6 mb. Commercial US crude and product stocks normally decline by 2.4 mb this time of year. So seasonally adjusted the US inventories rose 8 mb last week according to the indicative numbers by the API. That is a lot. Also, the counter seasonal trend of rising stocks versus normally declining stocks this time of year looks on a solid pace of continuation. If the API is correct then total US crude and product stocks would stand 41 mb higher than one year ago and 6 mb higher than the 2015-19 average. And if we combine this with our knowledge of a sharp increase in production and exports by OPEC(+) and a large increase in oil at sea, then the current trend in US oil inventories looks set to continue. So higher stocks and lower crude oil prices until OPEC(+) switch to cuts. Actual US oil inventory data today at 18:00 CET.
US commercial crude and product stocks rising to 1293 mb in week 41 if last nights indicative numbers from API are correct.

Crude oil soon coming to a port near you. OPEC has lifted production sharply higher this autumn. At the same time demand for oil in the Middle-East has fallen as we have moved out of summer heat and crude oil burn for power for air-conditioning. The Middle-East oil producers have thus been able to lift exports higher on both accounts. Crude oil and condensates on water has shot up by 177 mb since mid-August. This oil is now on its way to ports around the world. And when they arrive, it will likely help to lift stocks onshore higher. That is probably when we will lose the last bit of front-end backwardation the the crude oil curves. That will help to drive the front-month Brent crude oil price down to the $60/b line and revisit the high $50ies/b. Then the eyes will be all back on OPEC+ when they meet in early November and then again in early December.
Crude oil and condensates at sea have moved straight up by 177 mb since mid-August as OPEC(+) has produced more, consumed less and exported more.

Analys
The Mid-East anchor dragging crude oil lower

When it starts to move lower it moves rather quickly. Gaza, China, IEA. Brent crude is down 2.1% today to $62/b after having traded as high as $66.58/b last Thursday and above $70/b in late September. The sell-off follows the truce/peace in Gaze, a flareup in US-China trade and yet another bearish oil outlook from the IEA.

A lasting peace in Gaze could drive crude oil at sea to onshore stocks. A lasting peace in Gaza would probably calm down the Houthis and thus allow more normal shipments of crude oil to sail through the Suez Canal, the Red Sea and out through the Bab-el-Mandeb Strait. Crude oil at sea has risen from 48 mb in April to now 91 mb versus a pre-Covid normal of about 50-60 mb. The rise to 91 mb is probably the result of crude sailing around Africa to be shot to pieces by the Houthis. If sailings were to normalize through the Suez Canal, then it could free up some 40 mb in transit at sea moving onshore into stocks.
The US-China trade conflict is of course bearish for demand if it continues.
Bearish IEA yet again. Getting closer to 2026. Credibility rises. We expect OPEC to cut end of 2025. The bearish monthly report from the IEA is what it is, but the closer we get to 2026, the more likely the IEA is of being ball-park right in its outlook. In its monthly report today the IEA estimates that the need for crude oil from OPEC in 2026 will be 25.4 mb/d versus production by the group in September of 29.1 mb/d. The group thus needs to do some serious cutting at the end of 2025 if it wants to keep the market balanced and avoid inventories from skyrocketing. Given that IEA is correct that is. We do however expect OPEC to implement cuts to avoid a large increase in inventories in Q1-26. The group will probably revert to cuts either at its early December meeting when they discuss production for January or in early January when they discuss production for February. The oil price will likely head yet lower until the group reverts to cuts.
Dubai: The Mid-East anchor dragging crude oil lower. Surplus emerging in Mid-East pricing. Crude oil prices held surprisingly strong all through the summer. A sign and a key source of that strength came from the strength in the front-end backwardation of the Dubai crude oil curve. It held out strong from mid-June and all until late September with an average 1-3mth time-spread premium of $1.8/b from mid-June to end of September. The 1-3mth time-spreads for Brent and WTI however were in steady deterioration from late June while their flat prices probably were held up by the strength coming from the Persian Gulf. Then in late September the strength in the Dubai curve suddenly collapsed. Since the start of October it has been weaker than both the Brent and the WTI curves. The Dubai 1-3mth time-spread now only stands at $0.25/b. The Middle East is now exporting more as it is producing more and also consuming less following elevated summer crude burn for power (Aircon) etc.
The only bear-element missing is a sudden and solid rise in OECD stocks. The only thing that is missing for the bear-case everyone have been waiting for is a solid, visible rise in OECD stocks in general and US oil stocks specifically. So watch out for US API indications tomorrow and official US oil inventories on Thursday.
No sign of any kind of fire-sale of oil from Saudi Arabia yet. To what we can see, Saudi Arabia is not at all struggling to sell its oil. It only lowered its Official Selling Prices (OSPs) to Asia marginally for November. A surplus market + Saudi determination to sell its oil to the market would normally lead to a sharp lowering of Saudi OSPs to Asia. Not yet at least and not for November.
The 5yr contract close to fixed at $68/b. Of importance with respect to how far down oil can/will go. When the oil market moves into a surplus then the spot price starts to trade in a large discount to the 5yr contract. Typically $10-15/b below the 5yr contract on average in bear-years (2009, 2015, 2016, 2020). But the 5yr contract is usually pulled lower as well thus making this approach a moving target. But the 5yr contract price has now been rock solidly been pegged to $68/b since 2022. And in the 2022 bull-year (Brent spot average $99/b), the 5yr contract only went to $72/b on average. If we assume that the same goes for the downside and that 2026 is a bear-year then the 5yr goes to $64/b while the spot is trading at a $10-15/b discount to that. That would imply an average spot price next year of $49-54/b. But that is if OPEC doesn’t revert to cuts and instead keeps production flowing. We think OPEC(+) will trim/cut production as needed into 2026 to prevent a huge build-up in global oil stocks and a crash in prices. But for now we are still heading lower. Into the $50ies/b.
Analys
More weakness and lower price levels ahead, but the world won’t drown in oil in 2026

Some rebound but not much. Brent crude rebounded 1.5% yesterday to $65.47/b. This morning it is inching 0.2% up to $65.6/b. The lowest close last week was on Thursday at $64.11/b.

The curve structure is almost as week as it was before the weekend. The rebound we now have gotten post the message from OPEC+ over the weekend is to a large degree a rebound along the curve rather than much strengthening at the front-end of the curve. That part of the curve structure is almost as weak as it was last Thursday.
We are still on a weakening path. The message from OPEC+ over the weekend was we are still on a weakening path with rising supply from the group. It is just not as rapidly weakening as was feared ahead of the weekend when a quota hike of 500 kb/d/mth for November was discussed.
The Brent curve is on its way to full contango with Brent dipping into the $50ies/b. Thus the ongoing weakening we have had in the crude curve since the start of the year, and especially since early June, will continue until the Brent crude oil forward curve is in full contango along with visibly rising US and OECD oil inventories. The front-month Brent contract will then flip down towards the $60/b-line and below into the $50ies/b.
At what point will OPEC+ turn to cuts? The big question then becomes: When will OPEC+ turn around to make some cuts? At what (price) point will they choose to stabilize the market? Because for sure they will. Higher oil inventories, some more shedding of drilling rigs in US shale and Brent into the 50ies somewhere is probably where the group will step in.
There is nothing we have seen from the group so far which indicates that they will close their eyes, let the world drown in oil and the oil price crash to $40/b or below.
The message from OPEC+ is also about balance and stability. The world won’t drown in oil in 2026. The message from the group as far as we manage to interpret it is twofold: 1) Taking back market share which requires a lower price for non-OPEC+ to back off a bit, and 2) Oil market stability and balance. It is not just about 1. Thus fretting about how we are all going to drown in oil in 2026 is totally off the mark by just focusing on point 1.
When to buy cal 2026? Before Christmas when Brent hits $55/b and before OPEC+ holds its last meeting of the year which is likely to be in early December.
Brent crude oil prices have rebounded a bit along the forward curve. Not much strengthening in the structure of the curve. The front-end backwardation is not much stronger today than on its weakest level so far this year which was on Thursday last week.

The front-end backwardation fell to its weakest level so far this year on Thursday last week. A slight pickup yesterday and today, but still very close to the weakest year to date. More oil from OPEC+ in the coming months and softer demand and rising inventories. We are heading for yet softer levels.

-

 Nyheter3 veckor sedan
OPEC+ missar produktionsmål, stöder oljepriserna
-

 Nyheter3 veckor sedan
Ett samtal om guld, olja, fjärrvärme och förnybar energi
-

 Nyheter2 veckor sedan
Guld nära 4000 USD och silver 50 USD, därför kan de fortsätta stiga
-

 Analys3 veckor sedan
Are Ukraine’s attacks on Russian energy infrastructure working?
-

 Nyheter1 vecka sedan
Goldman Sachs höjer prognosen för guld, tror priset når 4900 USD
-

 Nyheter2 veckor sedan
Blykalla och amerikanska Oklo inleder ett samarbete
-

 Nyheter4 veckor sedan
Guldpriset uppe på nya höjder, nu 3750 USD
-

 Nyheter2 veckor sedan
Ett samtal om guld, olja, koppar och stål


