Analys
SEB – Jordbruksprodukter, vecka 3
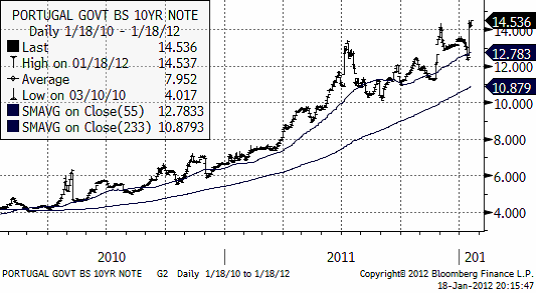
 Torkan i Argentina och södra Brasilien och effekten på soja- och majsskörden är i fokus i nyhetsflödet. Kanske är det eurokris-utmattning som gjort att Portugals nedgradering till ”skräp” passerat obemärkt förbi. Marknaden räknar med en 65% chans att landet går i konkurs inom fem år. Staten lånar nu till över 14.5% ränta, som vi ser i diagrammet nedan.
 Kina rapporterade en tillväxt på låga 8.9%, vilket är närmast chockerande lågt när landet legat på 10% i nästan tio år. Samtidigt noterar vi att tillväxten på landsbygden i Kina ligger på 11% och att halva Kinas befolkning bor där. Kina är också ett land som rapporterar högre veteskörd för 2011, trots minskad areal. Mycket tyder på att Kina släppt på monetär stimulans under december och att detta – tillsammans med solid tillväxt på landsbygden, bidrar till att ge landet en mjuklandning. Den monetära stimulansen – att staten släpper på likviditet – brukar slå igenom med ett maximum av effekt efter ca 6 månader.
Vete
USA var stängt i måndags och det är ovanlig nyhetstorka. Det är relativt torrt i USA och det saknas snötäcke på sina håll. Det är också kallare än normalt, så utvintring kan möjligen bli ett tema framöver. Ukraina har samma situation. En uppgift finns om att så mycket som 35% av vetet skulle kunna vara i dåligt skick. Ryskt vete har snötäcke. Nederbörden i Europa har varit normal, utom i Spanien.
Lagren av vete är höga i världen och om det inte uppstår stora problem under våren borde vetet kunna falla från de här nivåerna.
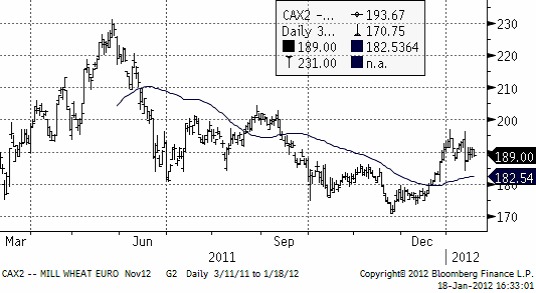
Nedan ser vi kursdiagrammet för novemberkontraktet på Matif.
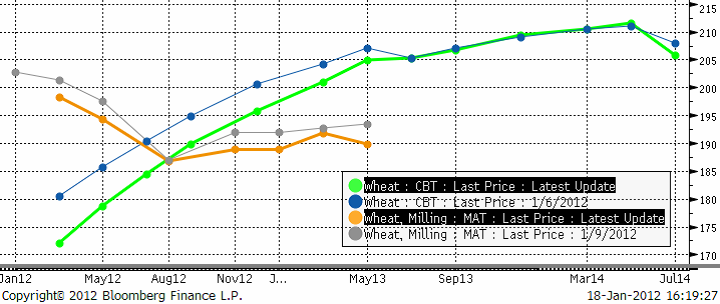
Nedan ser vi terminskurvan för Chicagovete och Matif nu och för en vecka sedan. De ”feta” kurvorna är de aktuella. De ”smala” är förra veckans. Det fortsätter att vara ”backwardation” på Matif, dvs terminspriserna för längre löptid är lägre än för korta. I USA är det däremot ”contango”, högre terminspriser ju längre ut i tiden man kommer. Det är lagringskostnaden som orsakar contangot.
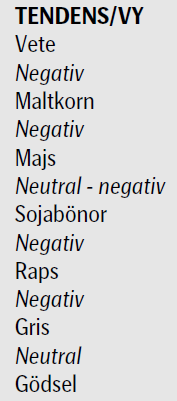
Vi fortsätter att tro på en nedgång i vetepriset under året.
Maltkorn
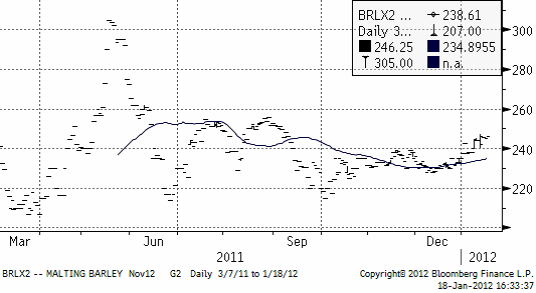
Maltkornsmarknaden har behållit sin styrka relativt andra spannmål med novemberleverans på Matif på 246.25, upp från 242 euro per ton förra veckan.
Potatis
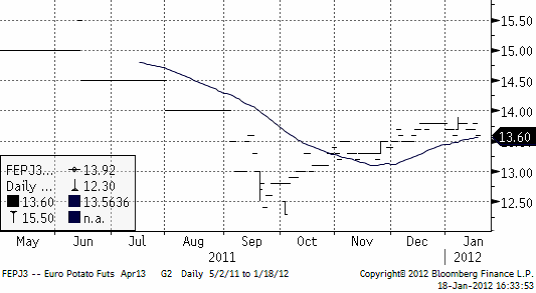
Priset på potatis har fortsatt att stiga, för leverans nästa år (av sommarens skörd), men uppgången har förlorat lite av sin kraft.
Majs
Förra året producerade Argentina 23 mt majs och inför sommaren (i Argentina) hade man hoppats kunna nå 28 – 29 mt. USDA förutspådde förra veckan att skörden blir 26 mt (en sänkning med 3 mt).
Maizar, som representerar majsodlarna i Argentina rapporterar att 20% av majssådden inte blev av och att 10% av det som såddes gått förlorat. Man kan så om och man kan så en andra gröda, safrinha, men om den blir för sen kan den skadas av tidig frost i mars och april. Oftast är det sojabönor man sår som andra gröda.
Det finns två väderleksprognoser för norra Argentina / södra Brasilien. En säger regn till helgen och sedan torrt igen. Den andra har mer generell nederbörd i prognosen.
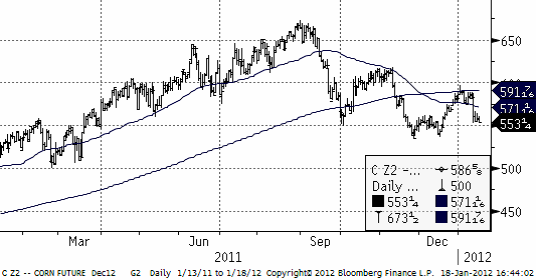
Enligt en rapport från Global Weather Monitoring på onsdagseftermiddagen ska det regna 25 mm från 21 januari. Förra veckan regnade det 50 mm, efter att det varit torrt i 40 dagar. Nedan ser vi decemberkontraktet på CBOT, där priset just fallit ner från 600-cent-nivån.
Tekniskt ser det ut som om priset skulle kunna falla ner mot 500 cent, men 550 cent är ett starkt stöd, där det funnits starka köpintressen tidigare.
Sojabönor
Conab, som gör skördeprognoserna inom det brasilianska jordbruksdepartementet estimerar att landet kommer att bärga en skörd på 71.75 mt i år. Det är 4.7% mindre än förra året. Att det blir en så liten minskning trots torkan i Parana (15 mt normal produktion) i söder, beror på att det vuxit frodigt i den väldiga delstaten Mato Grosso (där det knappt finns någon skog kvar, bara till namnet). Privata analysfirmor i Brasilien, som t ex Agroconsult förutspår en nedgång på 2% totalt till 73.52 mt och AgRural väntar sig en skörd på 73.06 mt.
I Argentina sänkte USDA skörden förra veckan från 52 mt till 50.5 mt. Förra året skördades 49 mt soja, så det är ändå en uppgång. Jordbrukare i Argentina kan fortfarande så ”andrasojan”. I delstaten Cordoba, som vi skrev om förra veckan, och som är näst största producenten av majs, utlystes katastroftillstånd den här veckan. Det betyder att nödhjälp kan betalas ut till jordbrukarna. Hela landet Paraguay gjordet detsamma.
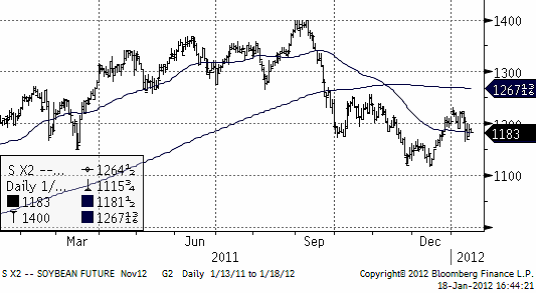
Tekniskt står priset och väger. Vädret håller på att förbättras i Sydamerika. Å andra sidan tyder det mesta på att Kina har startat monetär stimulans och det kan öka efterfrågan senare under året.
Enligt USDA kommer Brasilien att gå om USA som världens största exportör av sojabönor i år, året som slutar den 30 september 2012.
Raps
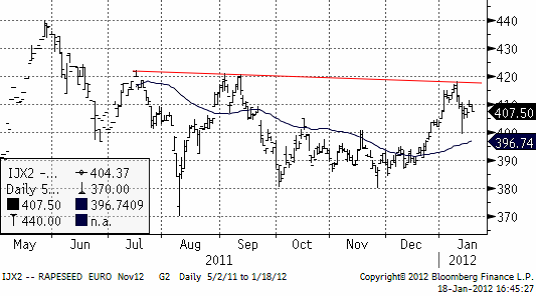
Priset på rapsfrö har varit förbluffande starkt på Matif. Tekniskt ser vi i diagrammet nedan att det finns en motståndslinje precis ovanför. Det skulle förvåna mycket om raps, som är mycket dyrare än kandensisk canola och sojabönor skule lyckas bryta upp över 420 euro per ton.
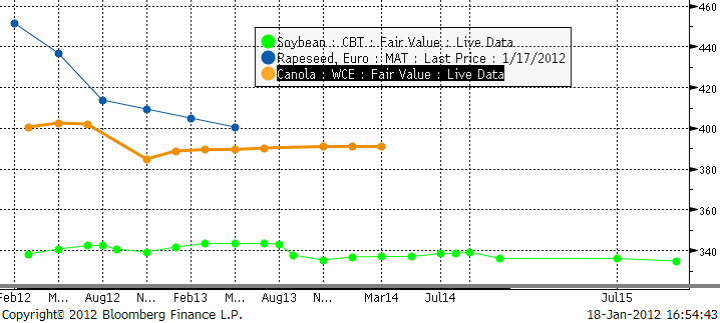
Nedan ser vi terminspriserna framåt i tiden för Matif raps, kanadensisk canola och för CBOT sojabönor, allt uttryckt i euro per metriskt ton.
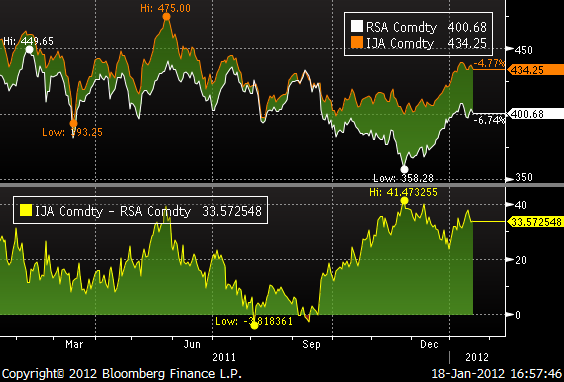
I diagrammet nedan ser vi att rapsfrö är ovanligt dyrt i förhållande till kanadensisk canola (IJA=raps, RSA=canola).
Vi har en negativ vy på Matif raps.
Mjölk
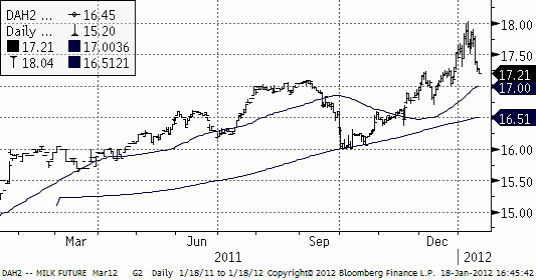
Nedan ser vi priset på marskontraktet på flytande mjölk (kontant avräknat mot USDA:s prisindex). Marknaden stötte på säljare på 18 och priset föll tillbaka kraftigt ner till 17.21.
Gris
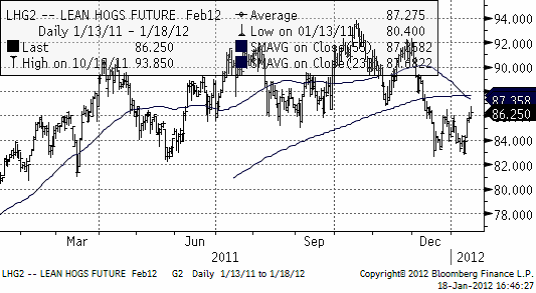
Priset på lean hogs rekylerade upp kraftigt de senaste dagarna, vilket gör att priset fortfarande ligger kvar i det breda prisintervall som etablerades redan under förra våren.
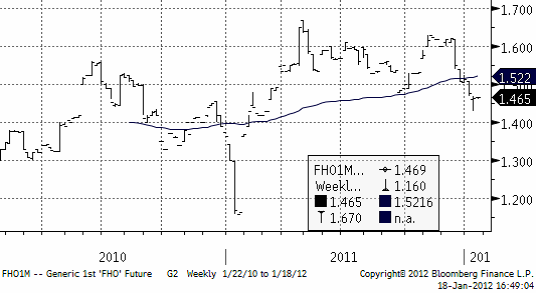
Priset i Europa har betett sig på samma sätt. Nedan ser vi det vid var tid kortaste terminskontraktet (närmast spot):
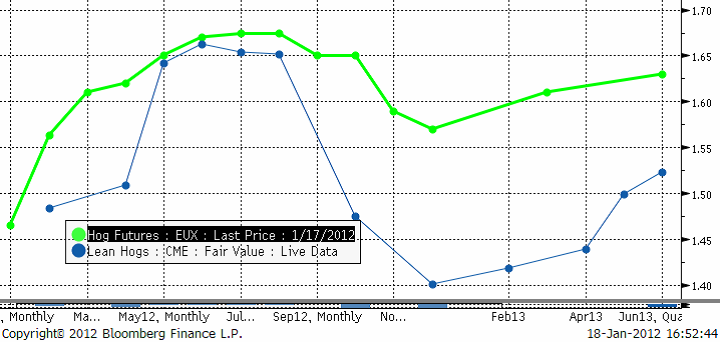
Nedan ser vi terminspriserna med förfall framåt i tiden. Amerikanska Lean Hogs-priserna är omräknade till euro per kilo. Vi ser att Lean Hogs ligger lägre i pris och att skillnaden är riktigt stor från oktober och framåt.
Valutor
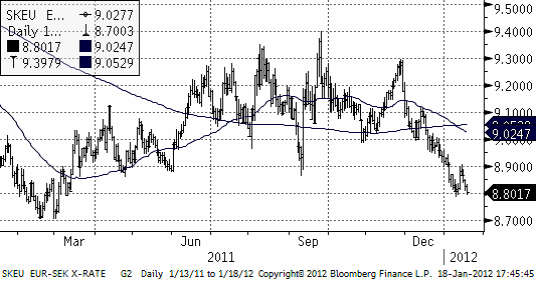
EURSEK har helt naturligt noterat lägre priser och borde fortsätta att falla.
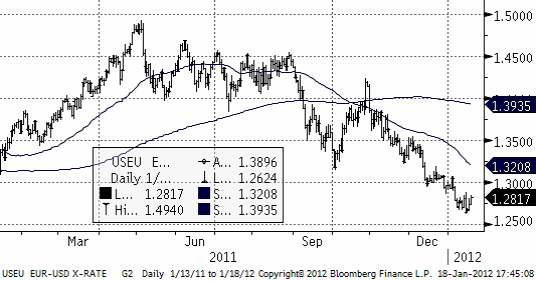
EURUSD är i en tydlig negativ trend.
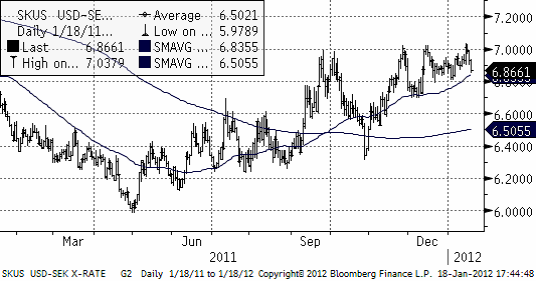
USDSEK har en stigande trend och har nått upp till heltalet 7 kr per dollar, varifrån det återigen vänt ner. 7 kronor verkar vara ett starkt motstånd. Köpsignal torde vi ta på allvar om kursen noteras över 7.05 kr, väl över motståndsnivån.
Gödsel
Kväve
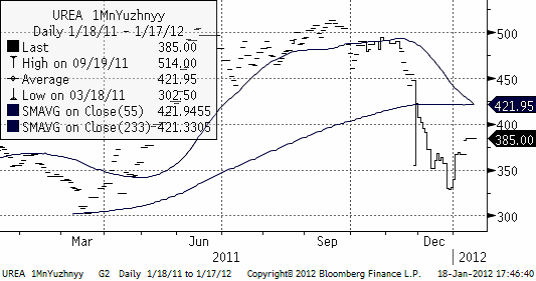
Nedan ser vi 1 månads terminspris på Urea fob Uyzhnyy. Priset har inte rört sig från den nivån den senaste veckan.
[box]SEB Veckobrev Jordbruksprodukter är producerat av SEB Merchant Banking och publiceras i samarbete och med tillstånd på Råvarumarknaden.se[/box]
Disclaimer
The information in this document has been compiled by SEB Merchant Banking, a division within Skandinaviska Enskilda Banken AB (publ) (“SEB”).
Opinions contained in this report represent the bank’s present opinion only and are subject to change without notice. All information contained in this report has been compiled in good faith from sources believed to be reliable. However, no representation or warranty, expressed or implied, is made with respect to the completeness or accuracy of its contents and the information is not to be relied upon as authoritative. Anyone considering taking actions based upon the content of this document is urged to base his or her investment decisions upon such investigations as he or she deems necessary. This document is being provided as information only, and no specific actions are being solicited as a result of it; to the extent permitted by law, no liability whatsoever is accepted for any direct or consequential loss arising from use of this document or its contents.
About SEB
SEB is a public company incorporated in Stockholm, Sweden, with limited liability. It is a participant at major Nordic and other European Regulated Markets and Multilateral Trading Facilities (as well as some non-European equivalent markets) for trading in financial instruments, such as markets operated by NASDAQ OMX, NYSE Euronext, London Stock Exchange, Deutsche Börse, Swiss Exchanges, Turquoise and Chi-X. SEB is authorized and regulated by Finansinspektionen in Sweden; it is authorized and subject to limited regulation by the Financial Services Authority for the conduct of designated investment business in the UK, and is subject to the provisions of relevant regulators in all other jurisdictions where SEB conducts operations. SEB Merchant Banking. All rights reserved.
Analys
Also OPEC+ wants to get compensation for inflation

Brent crude has fallen USD 3/b since the peak of Iran-Israel concerns last week. Still lots of talk about significant Mid-East risk premium in the current oil price. But OPEC+ is in no way anywhere close to loosing control of the oil market. Thus what will really matter is what OPEC+ decides to do in June with respect to production in Q3-24 and the market knows this very well. Saudi Arabia’s social cost-break-even is estimated at USD 100/b today. Also Saudi Arabia’s purse is hurt by 21% US inflation since Jan 2020. Saudi needs more money to make ends meet. Why shouldn’t they get a higher nominal pay as everyone else. Saudi will ask for it

Brent is down USD 3/b vs. last week as the immediate risk for Iran-Israel has faded. But risk is far from over says experts. The Brent crude oil price has fallen 3% to now USD 87.3/b since it became clear that Israel was willing to restrain itself with only a muted counter attack versus Israel while Iran at the same time totally played down the counterattack by Israel. The hope now is of course that that was the end of it. The real fear has now receded for the scenario where Israeli and Iranian exchanges of rockets and drones would escalate to a point where also the US is dragged into it with Mid East oil supply being hurt in the end. Not everyone are as optimistic. Professor Meir Javedanfar who teaches Iranian-Israeli studies in Israel instead judges that ”this is just the beginning” and that they sooner or later will confront each other again according to NYT. While the the tension between Iran and Israel has faded significantly, the pain and anger spiraling out of destruction of Gaza will however close to guarantee that bombs and military strifes will take place left, right and center in the Middle East going forward.
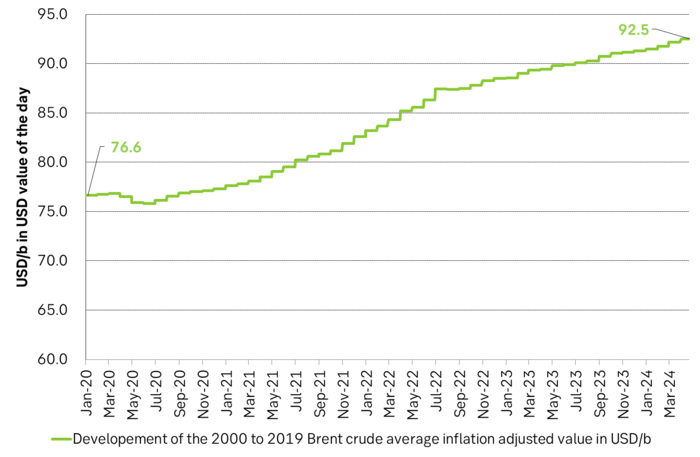
Also OPEC+ wants to get paid. At the start of 2020 the 20 year inflation adjusted average Brent crude price stood at USD 76.6/b. If we keep the averaging period fixed and move forward till today that inflation adjusted average has risen to USD 92.5/b. So when OPEC looks in its purse and income stream it today needs a 21% higher oil price than in January 2020 in order to make ends meet and OPEC(+) is working hard to get it.
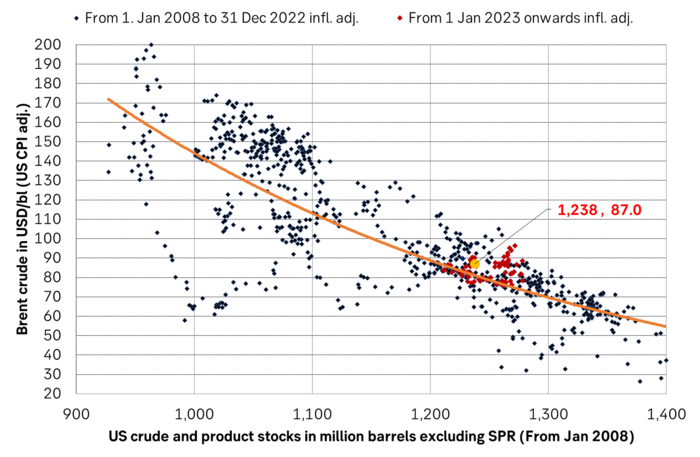
Much talk about Mid-East risk premium of USD 5-10-25/b. But OPEC+ is in control so why does it matter. There is much talk these days that there is a significant risk premium in Brent crude these days and that it could evaporate if the erratic state of the Middle East as well as Ukraine/Russia settles down. With the latest gains in US oil inventories one could maybe argue that there is a USD 5/b risk premium versus total US commercial crude and product inventories in the Brent crude oil price today. But what really matters for the oil price is what OPEC+ decides to do in June with respect to Q3-24 production. We are in no doubt that the group will steer this market to where they want it also in Q3-24. If there is a little bit too much oil in the market versus demand then they will trim supply accordingly.
Also OPEC+ wants to make ends meet. The 20-year real average Brent price from 2000 to 2019 stood at USD 76.6/b in Jan 2020. That same averaging period is today at USD 92.5/b in today’s money value. OPEC+ needs a higher nominal price to make ends meet and they will work hard to get it.
Inflation adjusted Brent crude price versus total US commercial crude and product stocks. A bit above the regression line. Maybe USD 5/b risk premium. But type of inventories matter. Latest big gains were in Propane and Other oils and not so much in crude and products
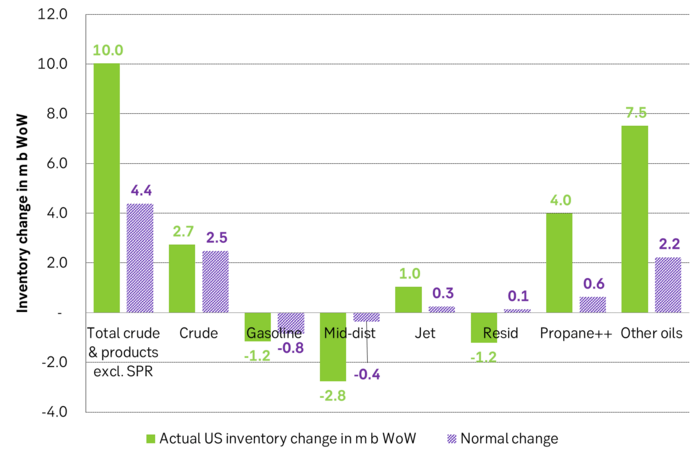
Total US commercial crude and product stocks usually rise by 4-5 m b per week this time of year. Gains have been very strong lately, but mostly in Propane and Other oils

Last week’s US inventory data. Big rise of 10 m b in commercial inventories. What really stands out is the big gains in Propane and Other oils
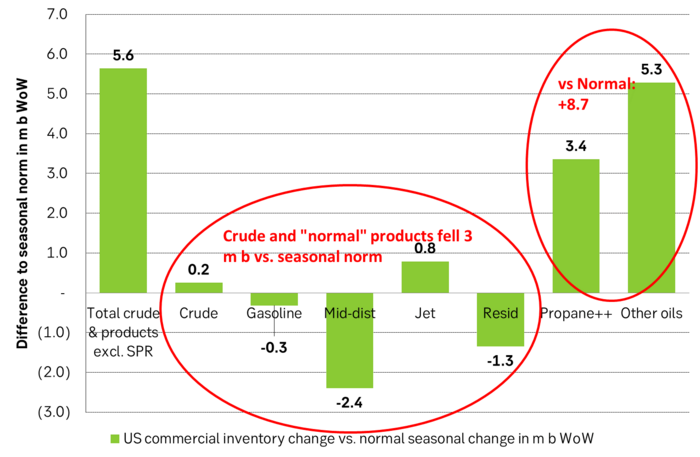
Take actual changes minus normal seasonal changes we find that US commercial crude and regular products like diesel, gasoline, jet and bunker oil actually fell 3 m b versus normal change.
Analys
Nat gas to EUA correlation will likely switch to negative in 2026/27 onward

Historically positive Nat gas to EUA correlation will likely switch to negative in 2026/27 onward

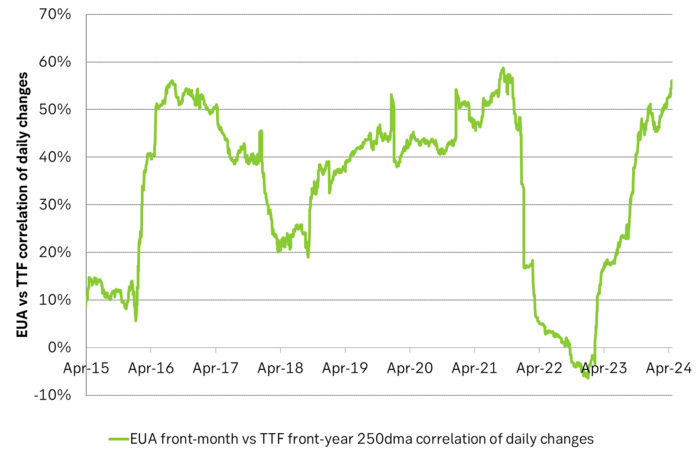
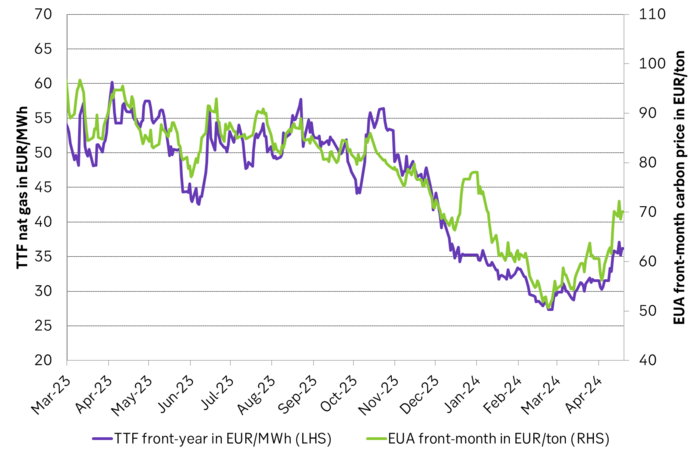
Historically there has been a strong, positive correlation between EUAs and nat gas prices. That correlation is still fully intact and possibly even stronger than ever as traders increasingly takes this correlation as a given with possible amplification through trading action.
The correlation broke down in 2022 as nat gas prices went ballistic but overall the relationship has been very strong for quite a few years.
The correlation between nat gas and EUAs should be positive as long as there is a dynamical mix of coal and gas in EU power sector and the EUA market is neither too tight nor too weak:
Nat gas price UP => ”you go black” by using more coal => higher emissions => EUA price UP
But in the future we’ll go beyond the dynamically capacity to flex between nat gas and coal. As the EUA price moves yet higher along with a tightening carbon market the dynamical coal to gas flex will max out. The EUA price will then trade significantly above where this flex technically will occur. There will still be quite a few coal fired power plants running since they are needed for grid stability and supply amid constrained local grids.
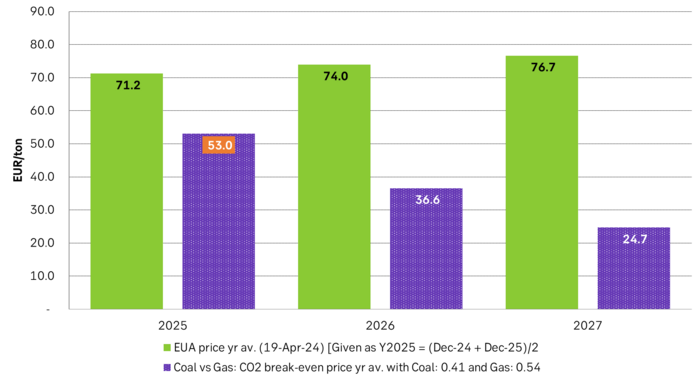
As it looks now we still have such overall coal to gas flex in 2024 and partially in 2025, but come 2026 it could be all maxed out. At least if we look at implied pricing on the forward curves where the forward EUA price for 2026 and 2027 are trading way above technical coal to gas differentials. The current forward pricing implications matches well with what we theoretically expect to see as the EUA market gets tighter and marginal abatement moves from the power sector to the industrial sector. The EUA price should then trade up and way above the technical coal to gas differentials. That is also what we see in current forward prices for 2026 and 2027.
The correlation between nat gas and EUAs should then (2026/27 onward) switch from positive to negative. What is left of coal in the power mix will then no longer be dynamically involved versus nat gas and EUAs. The overall power price will then be ruled by EUA prices, nat gas prices and renewable penetration. There will be pockets with high cost power in the geographical points where there are no other alternatives than coal.
The EUA price is an added cost of energy as long as we consume fossil energy. Thus both today and in future years we’ll have the following as long as we consume fossil energy:
EUA price UP => Pain for consumers of energy => lower energy consumption, faster implementation of energy efficiency and renewable energy => lower emissions
The whole idea with the EUA price is after all that emissions goes down when the EUA price goes up. Either due to reduced energy consumption directly, accelerated energy efficiency measures or faster switch to renewable energy etc.
Let’s say that the coal to gas flex is maxed out with an EUA price way above the technical coal to gas differentials in 2026/27 and later. If the nat gas price then goes up it will no longer be an option to ”go black” and use more coal as the distance to that is too far away price vise due to a tight carbon market and a high EUA price. We’ll then instead have that:
Nat gas higher => higher energy costs with pain for consumers => weaker nat gas / energy demand & stronger drive for energy efficiency implementation & stronger drive for more non-fossil energy => lower emissions => EUA price lower
And if nat gas prices goes down it will give an incentive to consume more nat gas and thus emit more CO2:
Cheaper nat gas => Cheaper energy costs altogether, higher energy and nat gas consumption, less energy efficiency implementations in the broader economy => emissions either goes up or falls slower than before => EUA price UP
Historical and current positive correlation between nat gas and EUA prices should thus not at all be taken for granted for ever and we do expect this correlation to switch to negative some time in 2026/27.
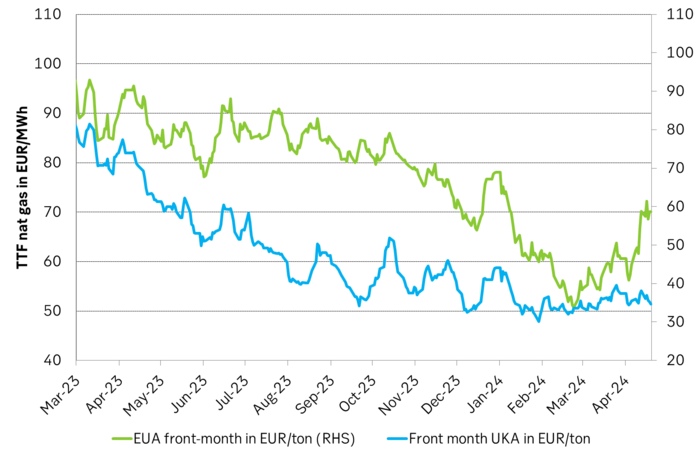
In the UK there is hardly any coal left at all in the power mix. There is thus no option to ”go black” and burn more coal if the nat gas price goes up. A higher nat gas price will instead inflict pain on consumers of energy and lead to lower energy consumption, lower nat gas consumption and lower emissions on the margin. There is still some positive correlation left between nat gas and UKAs but it is very weak and it could relate to correlations between power prices in the UK and the continent as well as some correlations between UKAs and EUAs.
Correlation of daily changes in front month EUA prices and front-year TTF nat gas prices, 250dma correlation.
EUA price vs front-year TTF nat gas price since March 2023
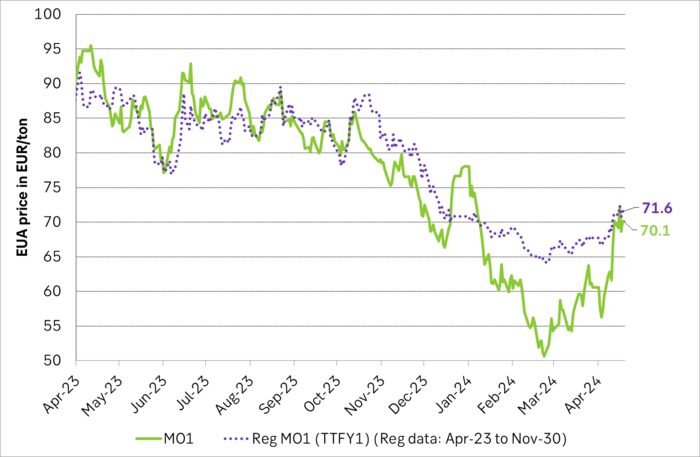
Front-month EUA price vs regression function of EUA price vs. nat gas derived from data from Apr to Nov last year.
The EUA price vs the UKA price. Correlations previously, but not much any more.
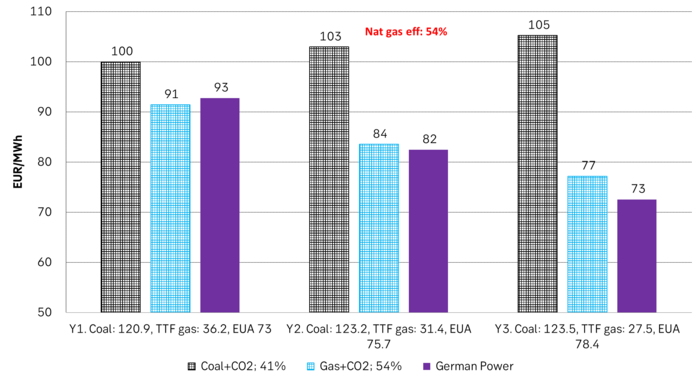
Forward German power prices versus clean cost of coal and clean cost of gas power. Coal is totally priced out vs power and nat gas on a forward 2026/27 basis.
Forward price of EUAs versus technical level where dynamical coal to gas flex typically takes place. EUA price for 2026/27 is at a level where there is no longer any price dynamical interaction or flex between coal and nat gas. The EUA price should/could then start to be negatively correlated to nat gas.
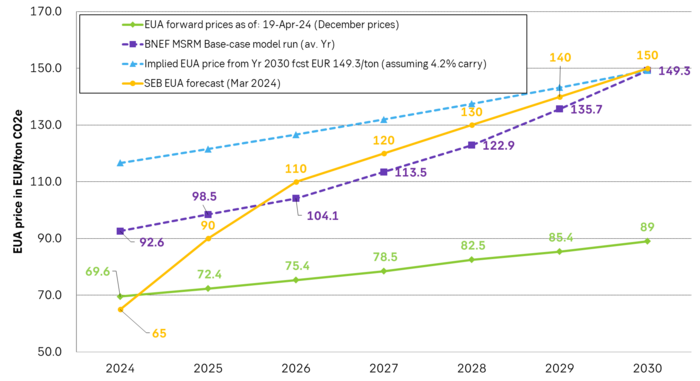
Forward EAU price vs. BNEF base model run (look for new update will come in late April), SEB’s EUA price forecast.
Analys
Fear that retaliations will escalate but hopes that they are fading in magnitude

Brent crude spikes to USD 90.75/b before falling back as Iran plays it down. Brent crude fell sharply on Wednesday following fairly bearish US oil inventory data and yesterday it fell all the way to USD 86.09/b before a close of USD 87.11/b. Quite close to where Brent traded before the 1 April attack. This morning Brent spiked back up to USD 90.75/b (+4%) on news of Israeli retaliatory attack on Iran. Since then it has quickly fallen back to USD 88.2/b, up only 1.3% vs. ydy close.

The fear is that we are on an escalating tit-for-tat retaliatory path. Following explosions in Iran this morning the immediate fear was that we now are on a tit-for-tat escalating retaliatory path which in the could end up in an uncontrollable war where the US unwillingly is pulled into an armed conflict with Iran. Iran has however largely diffused this fear as it has played down the whole thing thus signalling that the risk for yet another leg higher in retaliatory strikes from Iran towards Israel appears low.
The hope is that the retaliatory strikes will be fading in magnitude and then fizzle out. What we can hope for is that the current tit-for-tat retaliatory strikes are fading in magnitude rather than rising in magnitude. Yes, Iran may retaliate to what Israel did this morning, but the hope if it does is that it is of fading magnitude rather than escalating magnitude.
Israel is playing with ”US house money”. What is very clear is that neither the US nor Iran want to end up in an armed conflict with each other. The US concern is that it involuntary is dragged backwards into such a conflict if Israel cannot control itself. As one US official put it: ”Israel is playing with (US) house money”. One can only imagine how US diplomatic phone lines currently are running red-hot with frenetic diplomatic efforts to try to defuse the situation.
It will likely go well as neither the US nor Iran wants to end up in a military conflict with each other. The underlying position is that both the US and Iran seems to detest the though of getting involved in a direct military conflict with each other and that the US is doing its utmost to hold back Israel. This is probably going a long way to convince the market that this situation is not going to fully blow up.
The oil market is nonetheless concerned as there is too much oil supply at stake. The oil market is however still naturally concerned and uncomfortable about the whole situation as there is so much oil supply at stake if the situation actually did blow up. Reports of traders buying far out of the money call options is a witness of that.
-

 Nyheter3 veckor sedan
Guldpriset når nytt all time high och bryter igenom 2300 USD
-
 Nyheter4 veckor sedan
Lundin Mining får köprekommendation av BMO
-

 Nyheter3 veckor sedan
USAs stigande konsumtion av naturgas
-

 Nyheter3 veckor sedan
Centralbanker fortsatte att köpa guld under februari
-

 Nyheter3 veckor sedan
Kakaomarknaden är extrem för tillfället
-

 Nyheter3 veckor sedan
Hur mår den svenska skogsbraschen? Två favoritaktier
-

 Nyheter4 veckor sedan
Boliden på 20 minuter
-

 Nyheter3 veckor sedan
Betydande underskott i utbudet av olja kan få priset att blossa upp


