

Analys
SEB Jordbruksprodukter, 7 oktober 2013

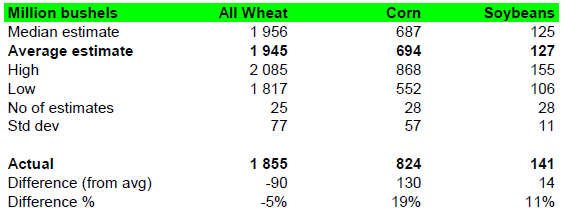
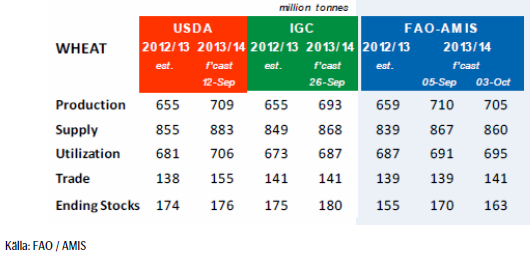
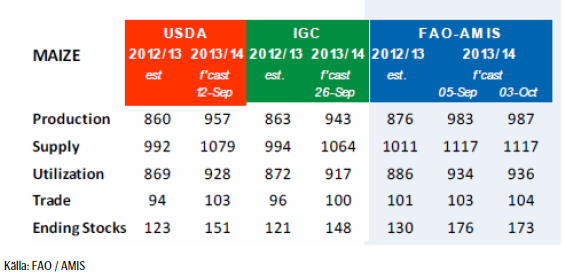
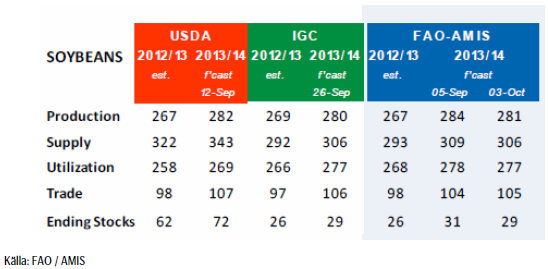
 Förra veckans viktigaste rapporter från USA hann bli publicerade. Det var framförallt lagerstatistiken, som var bullish vete, men bearish majs och sojabönor / oljeväxter. Vi ser utfallet jämfört med förväntningarna i tabellen nedan:
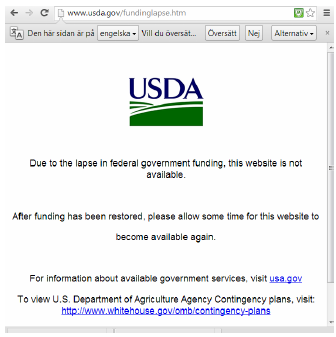
Efter att USA:s federala budget överskridits av Obama-administrationen, är nu ”non-essential”, dvs oviktiga, myndigheter stängda. Dit hör USDA och går man in på deras hemsida för att söka såväl ny som gammal information, möts man av nedanstående webbsida:
På grund av att US:s statsförvaltning har stängts, är det olika rapporter som inte publiceras. Här är en kort uppdatering av de som inte kommer ut.
- CFTC commit of traders report –
http://www.cftc.gov/PressRoom/PressReleases/reportsannouncement100113 - USDA daily slaughter — no release http://www.usda.gov/fundinglapse.htm
- USDA weekly export sales – no release
- USDA broiler eggs – no release
 Crop condition publicerades i måndags kväll, men kommer inte att publiceras i kväll. Det är oklart om det kommer att kunna publiceras en WASDE-rapport den 11 oktober. Enligt lagstiftningen ska rapporten publiceras mellan den 9 och 12 dagen i månaden, men det finns inga analytiker på plats på USDA. Normalt sett börjar de arbeta med datat den första oktober för att färdigställa rapporten en vecka senare.
Förra veckans konstigheter slutar inte med stängningen av USA federala regering. Det skedde även märkliga saker i samband med EU Kommissionens publicering av ett anti-dumping-fall på biodiesel. Marknaden i rapsfrö reagerade nämligen dagen innan publiceringen. Mycket tyder på att vissa aktörer kände till utfallet långt innan, medan andra, som borde känt till den, var totalt överraskade.
Vete
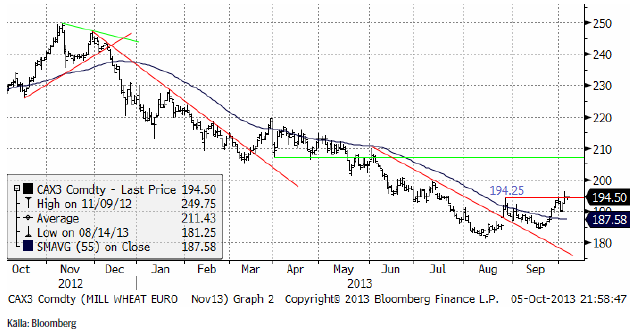
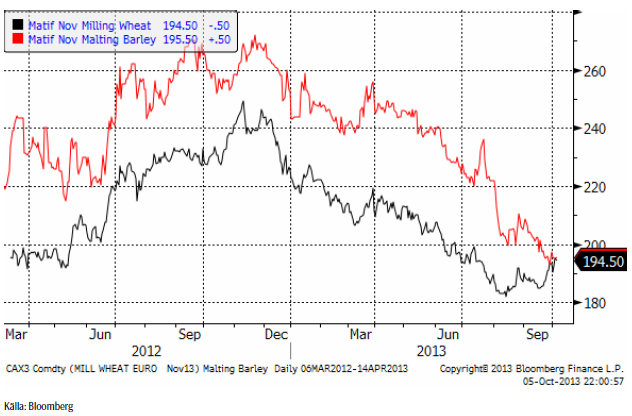
November månads terminskontrakt på Matif studsade först mot motståndet på 194.25, men tog sedan ny fart och bröt igenom. Vi har nu en teknisk köpsignal och trendvändning uppåt även i Matif-vetet. Förra veckan gick vi som bekant över till köprekommendation på spannmål.
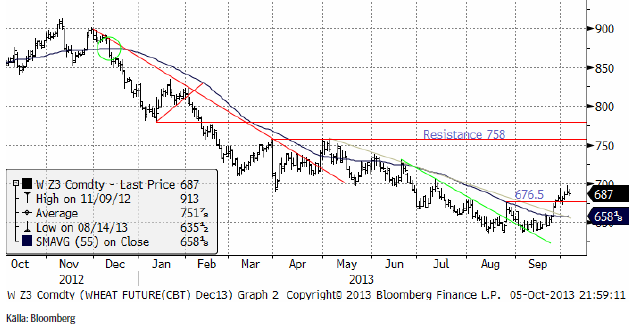
Decemberkontraktet på CBOT har brutit motståndet på 676.5 cent och därmed befinner sig marknaden enligt den tekniska analysen, i stigande trend.
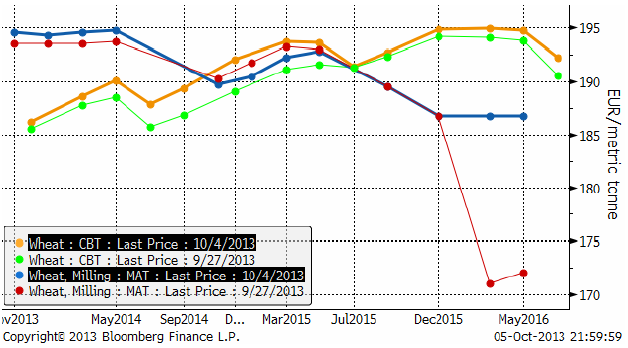
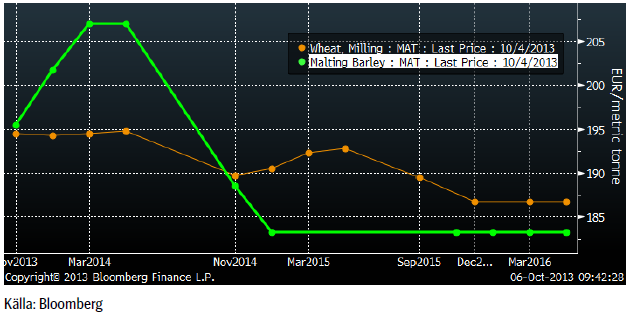
Nedan ser vi terminskurvorna för Chicagovete och Matif. Matif är nu nästan helt i backwardation.
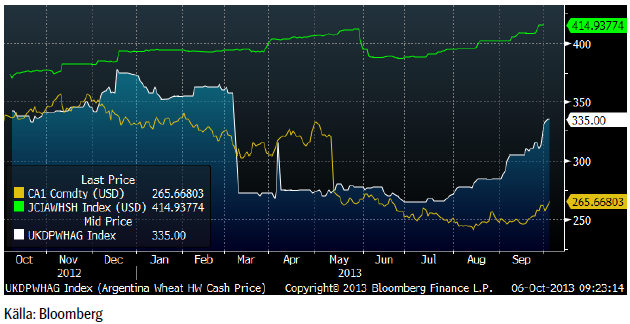
Det är lätt att tro att vetemarknaderna är desamma som Matif och CBOT över hela världen. Det är de inte. I Argentina handlas hard wheat på 335 dollar per ton för gammal skörd, eftersom det är skriande brist på vete i regionen (Argentina – Brasilien). I Kina handlas vete på 414 dollar per ton, vilket är högre än det gamla rekordet på 411 dollar per ton från maj. Räknar man om priserna till euro var priset högre i maj, men i vart fall får man en klar bild av att det inte är några bottennivåer prismässigt. Vi ser detta i prisdiagrammet nedan. Den översta kurvan är priset i Kina per ton. Den Blåa kurvan är priset i Argentina och den röda kurvan är spotkontraktet på Matif. Alla priser är omräknade till dollar per ton. I det här perspektivet ser Matif riktigt billigt ut!
Måndagens Crop Progress från USDA visar att skörden av amerikanskt vårvete går mot sitt slut. För de 6 stater som rapporterar så är nu 95% av skörden avklarad, en ökning från förra veckans 93%. Vid den här tiden förra året var dock skörden avklarad.
Sådden av amerikanskt höstvete går också framåt och 39% av den förväntade arealen var avklarad per den 29 september, upp från förra veckans 23% och marginellt högre än förra året men en hårsmån lägre än det 5-åriga genomsnittet på 40%.
Från och med denna rapport så börjar USDA också att rapportera uppkomsten av höstvete, där siffran nu uppgår till 12% – vilket är i linje med förra året men strax under det 5-åriga genomsnittet på 15%.
FAO / AMIS kom med sin rapport nu i veckan och de justerar ner sin prognos för den globala veteproduktionen 2013/14 med 5 mt till 705 mt, som en följd av något försämrade utsikter för producentländerna på det södra halvklotet och de ihållande regnen i Svarta Havs-regionen.
Utgående lager förväntas återhämta sig, om än något mindre än vad som angetts i tidigare prognoser vilket återspeglar ett lägre produktions estimat i kombination med ökad konsumtion där användningen av vete som foder har ökat snabbt i flera länder.
Veckan avslutades med Statistics Canadas rapport. Det var förväntat att veteskörden (alla sorter) skulle uppgå till 32.7 mt enligt en sammanställning av 11 analytikers estimat gjord av Bloomberg, mot 30.6 mt estimerat i juli månads rapport och 27.21 mt förra året. Rapporten i fredags visade att skörden kan bli 33 mt, alltså en hårsmån högre än estimerat. Detta blir då den största skörden av vete någonsin i Kanada och går förbi rekordet från 1990 på 32.1 mt. Stats Canada intervjuade 10,500 lantbrukare mellan 3 och 10 september för att komma fram till rapporten.
Den genomsnittliga hektarskörden ligger på 48 bu/acre, upp från 42.6 förra året, enligt rapporten. Riklig nederbörd har kompenserat den sena sådden. Den 27 september rapporterade FarmLink Marketing Solutions att avkastningen på vårvete kan bli så hög som 80 bushels per acre.
En viktig faktor, som kan driva pristrenden, är det våta och snöiga vädret i Ryssland och Ukraina. Rysslandn ligger 35% efter i höstsådden och det är oklart om de kommer att hinna ikapp. En vårsådd kommer inte att kompenseras med vårvete, utan med oljeväxter, majs och korn. Situationen ser något värre ut i Ukraina, där jordbruksministeriet estimerar nästa års skörd av vete till 15 mt (22 mt i år).
Problem i Ryssland och Ukraina och priser som rusar i Sydamerika och i Kina, tyder på att en ny uppgångsfas kan bli starkare än vad vi tidigare trott. Vi håller därför fast vid och upprepar köprekommendationen på vete.
Samtidigt vill vi påminna lantbrukare om att situationen med nära backwardation i terminspriserna på Matif inte är en uppmaning att behålla fysiskt vete i lager, utan att sälja detta och köpa terminer istället, om man vill ta del av en prisuppgång och utsätta sig för risken att ha fel.
Maltkorn
För en vecka sedan kunde vi rapportera att terminspriset på maltkorn för leverans i november låg under Matifs vetetermin. Den här veckan är ordningen återställd och vetet är 1 euro dyrare än maltkornet. Förmodligen kommer många lantbrukare att försöka undvika att så maltkorn i vår, vilket bäddar för högre pris nästa år. Om man funderar på att köpa terminer på vete, kan terminer på maltkorn vara ett bättre val. Likviditeten är ett litet hinder, men det finns oftast betydligt fler säljare än köpare.
Terminsstrukturen visar ett litet lagerpåslag för maltkorn för den här skörden, upp till 10 tolv euro fram till mars och maj. Novemberkontraktet för nästa år ligger en euro under Matifs vetekontrakt. Det kontraktet kan vara köpvärt. Det är svårt att tänka sig att maltkorn i november nästa år ska vara billigare än vetet.
Majs
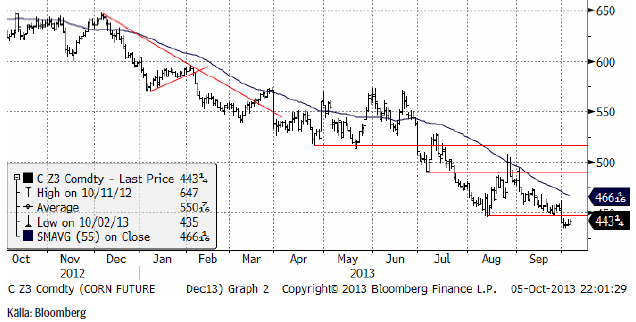
Majspriset (december 2013) gick under det tekniska stödet, men vi tror att detta är en falsk teknisk säljsignal och att priset kommer att vända uppåt. Takten i nedgången har avtagit. Kraften är upphällningen.
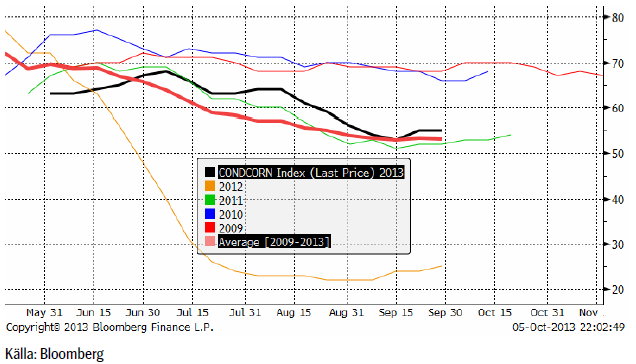
Tillståndet för den amerikanska majsen lämnades oförändrat enligt måndagens Crop Progress från USDA. För de 18 stater som rapporterar så klassas fortfarande 55% som ”good/excellent”, vilket är marginellt högre än det 5-åriga genomsnittet på 54%. Tillståndet för grödorna i Illinois förbättrades nämnvärt under förra veckan och andelen ”good/excellent” steg med 4% till 62%. Även tillståndet för grödorna i Indiana förbättrades med 1% till 65%. Iowa ligger fortfarande kvar på en låg nivå, endast 36%, vilket dessutom är en nedjustering med 1% från veckan innan.
Skörden av majs går framåt om än långsamt. Enligt USDA var endast 12% av skörden avklarad per den 29 september, upp från förra veckans 7% och att jämföra med det 5-åriga genomsnittet på 23%. Förra året var mer än hälften av skörden avklarad. Tar man en närmare titt på ”I-staterna” så är bara 5% av Iowas skörd klar jämfört med snittet på 16%, medan endast 13% av skörden i Illinois är klar jämfört med det 5-åriga genomsnittet på 34% vid den här tiden.
FAO / AMIS justerar upp sin prognos för den globala produktionen av majs till 987 mt från den tidigare prognosen på 983 mt, främst på grund av högre estimat för Kina, Indien och USA. Utgående lager beräknas öka med 33% från ingående lager, där en återhämtning av majs lagren i USA står för en stor del av denna förväntan.
Överlag är utsikterna för grödorna goda. I USA klassas strax över hälften av grödorna som ”good/excellent, och trots torrt och varmt väder under sensommaren. En rekordproduktion förväntas, till stor del på grund av utökad areal vilken kompenserar för en något lägre avkastning. Även i Kanada och EU är prognoserna gynnsamma, med undantag av bl.a norra Italien och delar av Balkan där sen sådd och varma temperaturer påverkat grödorna negativt. Även i övriga delar världen, såsom Ryssland, Kina, Ukraina och Brasilien är utsikterna goda.
Jag har lyft fram det låga priset på majs och det höga priset på soja i tidigare veckobrev. Efter den senaste nedgången i majspriset är detta än mer aktuellt. Hur mycket mindre majs kommer amerikanska lantbrukare att så i vår?
Vi håller fast vid vår köprekommendation.
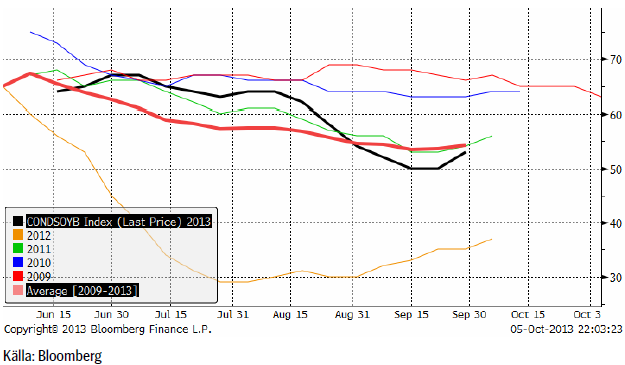
Sojabönor
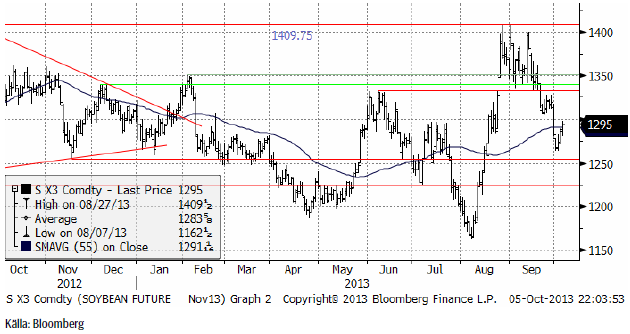
Novemberkontraktet på sojabönor gjorde precis som vi förutspått. Priset föll ner från ”flaggan” som låg strax över 1300 cent. Priset föll ner mot 1250 och har sedan rekylerat uppåt. Även den aktuella rekylen som tog fredagens stängning upp till 1295 är ett uppenbart säljtillfälle. Priset kommer antagligen att falla tillbaka i veckan som kommer – för att testa 1250 igen.
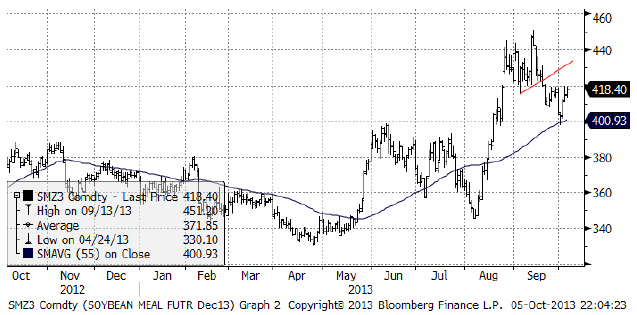
Sojamarknaden är naturligt uppdelad på sojamjöl och sojaolja och det är två helt olika världar. Sojamjölet är återigen uppe och ”tar farväl” av 420-nivån. Nota bene: skulle priset gå över 420 dollar per short ton, har vi istället en köpsignal.
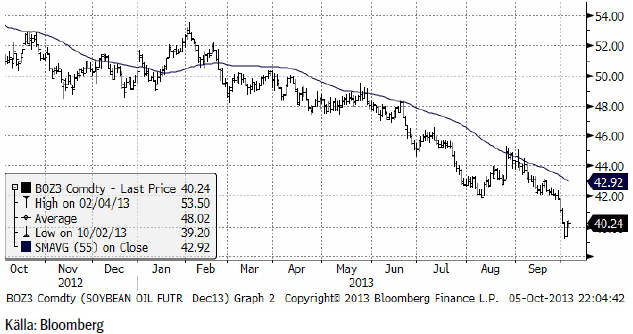
Och nedan ser vi den mycket baissigare utvecklingen på sojaoljan. Efter ett så kraftigt prisfall som vi hade förra veckan, är det inte ovanligt med en rekyl uppåt – en sådan är dock i regel ett säljtillfälle.
Till skillnad från veckan innan så visade nu måndagens Crop Progress på en förbättring gällande tillståndet för sojabönorna. 53% tillhör nu kategorin ”good/excellent”, en ökning från 50% veckan innan. 56% av grödorna i Illinois klassas som ”good/excellent” – upp 6% från veckan innan – och i Indiana ligger siffran på 60%. För Iowa ligger siffran på blygsamma 35%, en modest ökning med 1%.
Skörden av sojabönor i USA är nu officiellt igång och avklarad till 11%, en ökning från 3% veckan innan. Förra året vid den här tiden var 39% av skörden avklarad men det 5-åriga genomsnittet ligger på 20%.
Mest anmärkningsvärt är Iowa och Minnesota där skörden endast är avklarad till 5% respektive 9%, jämfört med det 5-åriga genomsnittet på 21% respektive 26%. I Indiana och Illinois ligger skördetakten strax under genomsnittet.
FAO / AMIS gör en nedjustering av den globala produktionen av sojabönor 2013/14 med 3 mt till 281 mt på grund av lägre produktionsestimat för Argentina, Indien och USA. I och med detta justeras även utgående ner – framförallt i USA och Argentina.
Strax över hälften av sojabönorna i USA klassas som ”good/excellent” trots att den långvariga torkan har påverkat avkastningen negativt. I Kina är förhållandena överlag positiva med varmare väder som gynnar grödornas utveckling.
Vi behåller säljrekommendation.
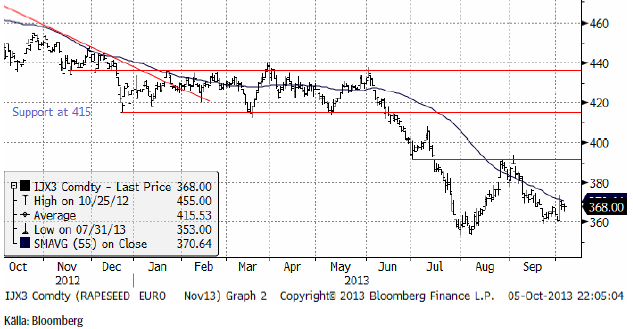
Raps
Rapspriset (november 2013) fann återigen stöd på 360 euro per ton. Hur detta skedde är intressant och vi återkommer till det nedan. Tekniskt kanske bilden håller på att ändra sig, men vi rekommenderar fortfarande att man är såld rapsfrö.
Efter lagerstatistiken i måndags, föll priset på rapsfrö abrupt från 366 euro per ton ner till 362, där en stor köpare tog allt som marknaden kastade in i gapet. Sedan, i onsdags, lyfte marknaden. Vi kan se prisrörelserna och omsättningen i antal kontrakt nedan:
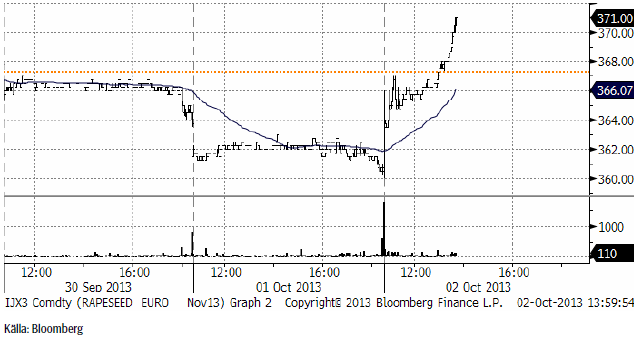
Det ser ut som om någon aktör under den 1 oktober förberedde sig inför haussen den 2 oktober.
Den 2 oktober berättade European Biodiesel Board att EU planerar att införa en tull på biodiesel från Argentina och Indonesien, därför att dessa länder har ägnat sig åt olaglig prisdumpning. Strafftullen ska vara på plats i fem år. Beslut i frågan ska tas av EU:s medlemsländer före den 28 november, berättar EBB i ett email den 2 oktober. Indonesien och Argentina står för över 90% av importen av biodisel till Europa. Den 2 oktober stod det klart att strafftullen kan bli dubbelt så hög som den intialt föreslogs bli i maj.
Ett beslut kan fattas på ett sammanträde i EU Anti-dumping Committee den 22 – 24 oktober, när alla EU:s 28 medlemsländer är representerade. Det vanliga är att Kommissionens förslag klubbas igenom. Vi tyckte handeln var märklig den 1 oktober och undrar om någon aktör hade exklusiv kännedom om ärendet innan det offentliggjordes den 2 oktober.
Ärendet går tillbaka till den 28 maj i år, när EU införde strafftullar på biodiesel från Argentina och Indonesien, efter att det hävdats att exportörer i dessa länder sålde biodiesel till EU till ett pris under produktionskostnad. EU-Kommissionen publicerade ett beslut i Official Journal den 28 maj där de skrev att Verbio AG i Tyskland, Diester Industrie SAS i Frankrike och Novaol Srl i Italien drabbats av ”väsentlig skada” (material injury) på grund av prisdumpning från Argentina och Indonesien. Strafftullen som då infördes skulle vara i kraft i sex månader, alltså till den 28 november. Det sades redan då att strafftullen kunde förlängas till fem år.
Det är klart att man undrar om någon aktör den 1 oktober hade kännedom om officiell information som publicerades den 2 oktober? Och vem läckte i så fall? Enligt den fristående analytikern Noel Fryer sade crushers till honom att de visste om detta i två veckor. Indonesiens svar var att de var i chock. De hade trott att dumping-fallet hade avskrivits.
Det verkar med andra ord som det här inte har gått rätt till. Det är strängt förbjudet att läcka insiderinformation och det är förbjudet att handla om man har inser eller borde inse att man har insiderinformation.
Oil World justerar upp sitt estimat för den globala produktionen av raps och canola med 1.5 mt till 65 mt till följd av förbättrade utsikter i Kanada. Prognosen för produktionen i EU-28 justeras också upp till 20.9 mt för 2013/14 då en ökad produktion i Östeuropa uppväger en lägre skörd i Frankrike.
Veckan avslutades med Statistics Canadas rapport. Det var förväntat att rapsskörden skulle uppgå till 16.4 mt mot 14.73 mt i den senaste rapporten från juli och 13.87 mt förra året. Rapsskörden estimerades till 16 mt nu, vilket alltså är lite lägre än förväntat.
Vi behåller säljrekommendationen på raps tills vidare.
Potatis
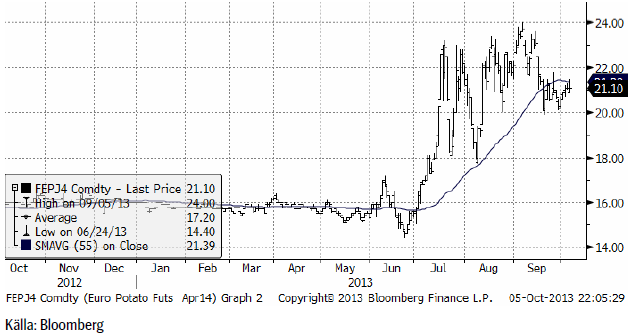
Potatispriset av årets skörd, som handlas i april-kontraktet på Eurex, har stigit lite till 21.10 euro per son, men det ser ut som om uppgången som började i juni och tog priset från 15 euro till 24 euro som högst har tappat fart.
Gris
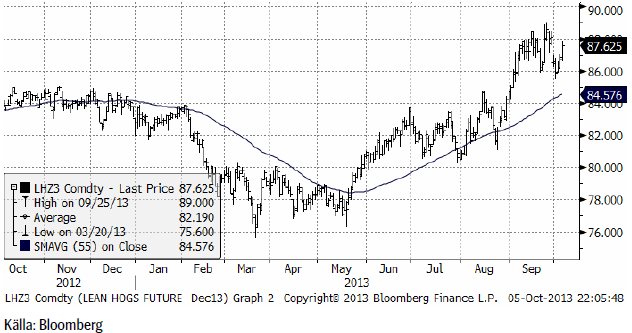
Lean hogs tog ett kliv uppåt i förra veckan, men ligger väl inom det prisintervall som varit rådande sedan början på september. Prismönstret av högre toppar och lägre bottnar som vi sett sedan början av september, ser man ofta efter en stor prisrörelse uppåt i samband med att uppgången är över. Det är alltså ett mönster som brukar följas av prisnedgång.
Mjölk
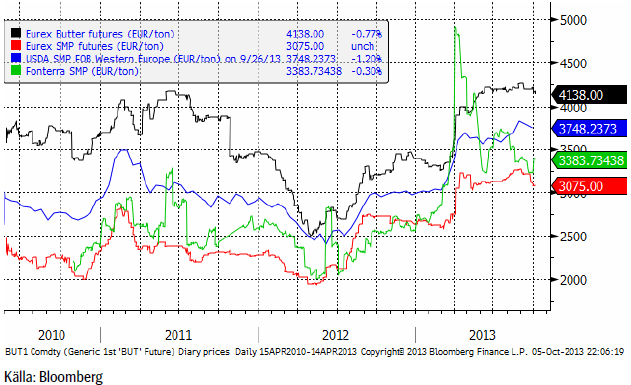
De olika terminsmarknaderna och prisindexen börjar nu falla, men har inte fått upp farten än. Vi gissar att takten i prisfallet kommer att öka. Den som vill prissäkra in dessa höga priser på terminsmarknaden bör skynda sig på.
Socker
Marskontraktet på råsocker har stigit med 10% i veckan som gick. Vi ser nu att den fallande trenden, som pågått sedan februari år 2013 nu är slut.
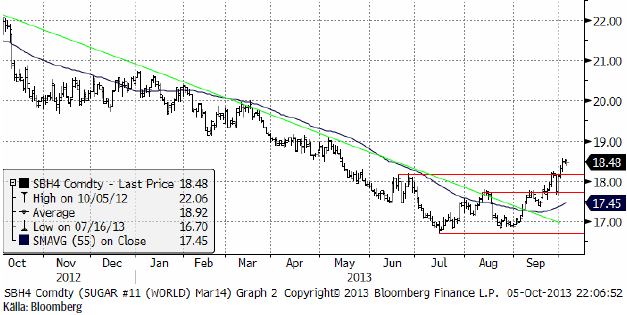
Den rekordstora leveransen av råsocker på 1.5 mt, som de stora handelshusen tog när oktoberkontraktet förföll, har påverkat marknaden. Först föll priset kraftigt, men sedan började marknaden tolka köpet via terminsmarknaden som en positiv signal.
Rapporter från Brasilien indikerar att skörden av sockerrör varit mindre än vad man hittills trott. Det låga priset har alltså verkligen haft effekt på produktionen och priset nu är väsentligt lägre än det var i våras.
Vi rekommenderar köp av socker.
[box]SEB Veckobrev Jordbruksprodukter är producerat av SEB Commodities Sales desk och publiceras i samarbete och med tillstånd på Råvarumarknaden.se[/box]
Detta marknadsföringsmaterial, framtaget av SEB’s Commodities Sales desk, har upprättats enbart i informationssyfte.
Även om innehållet är baserat på källor som SEB bedömt som tillförlitliga ansvarar SEB inte för fel eller brister i informationen. Den utgör inte oberoende, objektiv investeringsanalys och skyddas därför inte av de bestämmelser som SEB har infört för att förebygga potentiella intressekonflikter. Yttranden från SEB’s Commodities Sales desk kan vara oförenliga med tidigare publicerat material från SEB, då den senare hänvisas uppmanas du att läsa den fullständiga rapporten innan någon åtgärd vidtas.
Dokumentationen utgör inte någon investeringsrådgivning och tillhandahålls till dig utan hänsyn till dina investeringsmål. Du uppmanas att självständigt bedöma och komplettera uppgifterna i denna dokumentation och att basera dina investeringsbeslut på material som bedöms erforderligt. Alla framåtblickande uttalanden, åsikter och förväntningar är föremål för risker, osäkerheter och andra faktorer och kan orsaka att det faktiska resultatet avviker väsentligt från det förväntade. Historisk avkastning är ingen garanti för framtida resultat. Detta dokument utgör inte ett erbjudande att teckna några värdepapper eller andra finansiella instrument. SEB svarar inte för förlust eller skada – direkt eller indirekt, eller av vad slag det vara må – som kan uppkomma till följd av användandet av detta material eller dess innehåll.
Observera att det kan förekomma att SEB, dess ledamöter, dess anställda eller dess moder- och/eller dotterbolag vid olika tillfällen innehar, har innehaft eller kommer att inneha aktier, positioner, rådgivningsuppdrag i samband med corporate finance-transaktioner, investment- eller merchantbankinguppdrag och/eller lån i de bolag/finansiella instrument som nämns i materialet.
Materialet är avsett för mottagaren, all spridning, distribuering mångfaldigande eller annan användning av detta meddelande får inte ske utan SEB:s medgivande. Oaktat detta får SEB tillåta omfördelning av materialet till utvald tredje part i enlighet med gällande avtal. Materialet får inte spridas till fysiska eller juridiska personer som är medborgare eller har hemvist i ett land där sådan spridning är otillåten enligt tillämplig lag eller annan bestämmelse.
Skandinaviska Enskilda Banken AB (publ) är ett [publikt] aktiebolag och står under tillsyn av Finansinspektionen samt de lokala finansiella tillsynsmyndigheter i varje jurisdiktionen där SEB har filial eller dotterbolag.

Market is starting to take US/Iran headlines with a pinch of salt. Brent crude rose $2.8/b yesterday to an official close of $112.1/b. But after that it traded as low as $108.05/b before ending late night at around $109.7/b. Through the day it traded in a range of $106.87 – 112.72/b amid a flurry of news or rumors from Iran and the US. ”US temporary sanctions during negotiations” (falls alarm). ”We will bomb Iran” (not anyhow),… etc. While the market is still fluctuating to this kind of news flow, it is starting to take such headlines with a pinch of salt.

We’ll see. Maybe, maybe not. The Brent M1 contract is trading at $110.2/b this morning which very close to the average ticks through yesterday of $110.4/b.
Trump with bearish, verbal intervention whenever Brent trades above $110/b it seems. What seems to be a pattern is that Trump states something like ”very good negotiations going on with Iran”, ”New leaders in Iran are great,..”, ”Great progress in negotiations,…”, ”Deal in sight,..” etc whenever the Brent M1 contract trades above $110/b. An effort to cool the market. These hot air verbal interventions from Trump used to have a heavy bearish impact on prices, but they now seems to have less and less effect unless they are backed by reality.
As far as we can see there has been no real progress in the negotiations between the US and Iran with both sides still standing by their previous demands.
Iran is getting stronger while the cease fire lasts making a return to war for Trump yet harder. Iran is naturally in constant preparation for a return to war given Trump’s steady threats of bombing Iran again. Iran is naturally doing what ever is possible to prepare for a return to war. And every day the cease fire lasts it is better prepared. This naturally makes it more and more difficult and dangerous for the US to return to warring activity versus Iran as the consequences for energy infrastructure in the Persian Gulf will be more and more severe the longer the cease fire lasts. Israel seems to see it this way as well. That the war is not won and that current frozen state of a cease fire gives Iran opportunity to rebuild military and politically.
Global inventories are drawing down day by day. How much? In the meantime the Strait of Hormuz stays closed. There is varying measures and estimates of how much global inventories are drawing down. Our rough estimate, back of the envelope, is that global inventories are drawing down by at least some 10 mb/d or about 300 mb/d in a balance between loss of supply versus demand destruction. Other estimates we see are a monthly draw of 250-270 mb/d. The IEA only ’measured’ a draw in global observable stocks of 117 mb in April with oil on water rising 53 mb while on shore stocks fell 170 mb. But global stocks are hard to measure with large invisible, unmeasured stocks. As such a back of the envelope approach may be better.
Oil products is what the world is consuming. Oil product prices likely to rise while product stocks fall. Strategic Petroleum Reserves (SPR) are predominantly crude oil. Discharging oil from OECD SPR stocks, a sharp reduction in Chinese crude imports and a reduction in global refinery throughput of 6-7 mb/d has helped to keep crude oil markets satisfactorily supplied. But global inventories are drawing down none the less. And oil products is really what the world is consuming. So if global refinery throughput stays subdued, then demand will eventually have to match the supply of oil products. The likely path forward this summer is a steady draw down in jet fuel, diesel and gasoline. Higher prices for these. Then, if possible, higher refinery throughput and higher usage of crude in response to very profitable refinery margins. And lastly sharper draw in crude stocks and higher prices for these. But some 6 mb/d of oil products used to be exported through the Strait of Hormuz. And it may not be so easy to ramp up refinery activity across the world to compensate. Especially as Ukraine continues to damage Russian refineries as well as Russian crude production and export facilities.
Watch oil product stocks and prices as well as Brent calendar 2027. What to watch for this summer is thus oil product inventories falling and oil product premiums to crude rising. Another measure to watch is the Brent crude 2027 contract as it rises steadily day by day as the Strait of Hormuz stays closed and global oil inventories decline. The latter is close to the highest level since the start of the war and keeps rising.
The Brent M1 contract and the Brent 2027 prices and current price of jet fuel in Europe (ARA). All in USD/b

Our back of the envelope calculation of the global shortage created by the closure of the Strait of Hormuz. Note that 3.5 mb/d of discharge from SPR is also a draw. Note also that ’Forced demand loss’ of 2.5 mb/d is probably temporary and will fall back towards zero as logistics are sorted out leaving ’Price demand loss’ to do the job of balancing the market. Thus a shortfall of at least 9 mb/d created by the closure. More if SPR discharge is included and more if Forced demand loss recedes.

Brent is climbing higher. Front-month is at USD 106.3/bl this morning, close to a weekly high and a USD 9/bl jump from Mondays open. This is the move we flagged as a risk earlier in the week: the market shifting from ”a deal is around the corner” to ”this is going to take longer than we thought”.

Analyst Commodities, SEB
During April, rest-of-year Brent remained remarkably stable around USD 90/bl. A stability which rested on one single assumption: the SoH reopens around 1 May. That assumption is now slowly falling apart.
As we highlighted yesterday: every week of delay beyond 1 May adds (theoretically) ish USD 5/bl to the rest-of-year average, as global inventories draw 100 million barrels per week. i.e., a mid-May reopening implies rest-of-year Brent closer to USD 100/bl, and anything pushing into June or July takes us meaningfully higher.
What’s changed in the last 48 hours:
#1: The US military has formally warned that clearing suspected sea mines from SoH could take up to six months. That is a completely different timescale from what the financial market is pricing. Even a political deal tomorrow does not immediately reopen the strait.
#2: Trump has shifted his tone from urgency to ”strategic patience”. In yesterday’s press conference: ”Don’t rush me… I want a great deal.” The market is reading this as a president no longer feeling pressured by timelines, with the naval blockade running in the background.
#3: So far, the military activity is escalating, not de-escalating. Axios reports Iran is laying more mines in SoH. The US 3rd carrier strike group (USS George H.W. Bush) is arriving with two countermine vessels. Trump yesterday ordered the US Navy to destroy any Iranian boats caught laying mines. While CNN reports that the Pentagon is actively drawing up plans to strike Iranian SoH capabilities and individual Iranian military leaders if the ceasefire collapses. i.e., NOT a attitude consistent with an imminent deal!
Spot crude and product prices eased off the early-April highs on a combination of system rerouting and deal optimism. Both now weakening. Goldman estimates April Gulf output is reduced by 14.5 mbl/d, or 57% of pre-war supply, a number that keeps getting worse the longer this drags on.
Demand-side adaptation is ongoing: S. Korea has cut its Middle East crude dependence from 69% to 56% by pulling more from the Americas and Africa, and Japan is kicking off a second round of SPR releases from 1 May. But SPRs are finite.
Ref. to the negotiations, we should not bet on speed. The current Iranian leadership is dominated by genuine hardliners willing to absorb economic pain and run the clock to extract concessions. That is not a setup for a rapid resolution. US/Israeli media briefings keep framing the delay as ”internal Iranian divisions”, the reality is more complicated and points toward weeks and months, not days.
Our point is that the complexity is large, and higher prices have only just started (given a scenario where the negotiations drag out in time). The market spent April leaning on the USD 90/bl rest-of-year assumption; that case is diminishing by the hour. If ”early May reopening” is replaced by ”June, July or later” over the next week or two, both crude and products have meaningful room to reprice higher from here. There is a high risk being short energy and betting on any immediate political resolution(!).
Down on Friday. Up on Monday. The Brent June crude oil contract traded down 5.1% last week to a close of $90.38/b. It reached a high of $103.87/b last Monday and a low of $86.09/b on Friday as Iran announced that the Strait of Hormuz was fully open for transit. That quickly changed over the weekend as the US upheld its blockade of Iranian oil exports while Iran naturally responded by closing the SoH again. The US blew a hole in the engine room of the Iranian ship TOUSKA and took custody of the ship on Sunday. Brent crude is up 5.6% this morning to $95.4/b.
The cease-fire is expiring tomorrow. The US has said it will send a delegation for a second round of negotiations in Islamabad in Pakistan. But Iran has for now rejected a second round of talks as it views US demands as unrealistic and excessive while the US is also blocking the Strait of Hormuz.
While Brent is up 5% this morning, the financial market is still very optimistic that progress will be made. That talks will continue and that the SoH will fully open by the start of May which is consistent with a rest-of-year average Brent crude oil price of around $90/b with the market now trading that balance at around $88/b.
Financial optimism vs. physical deterioration. We have a divergence where the financial market is trading negotiations, improvements and resolution while at the same time the physical market is deteriorating day by day. Physical oil flows remain constrained by disrupted flows, longer voyage times and elevated freight and insurance costs.
Financial markets are betting that a US/Iranian resolution will save us in time from violent shortages down the road. But every day that the SoH remains closed is bringing us closer to a potentially very painful point of shortages and much higher prices.
The US blockade is also a weapon of leverage against its European and Asian allies. When Iran closed the SoH it held the world economy as a hostage against the US. The US blockade of the SoH is of course blocking Iranian oil exports. But it is also an action of disruption directed towards Europe and Asia. The US has called for the rest of the world to engaged in the war with Iran: ”If you want oil from the Persian Gulf, then go and get it”. A risk is that the US plays brinkmanship with the global oil market directed towards its European and Asian allies and maybe even towards China to force them to engage and take part. Maybe unthinkable. But unthinkable has become the norm with Trump in the White House.


Sommarväder skapar prisrally på elbörsen
Oil product price pain is set to rise as the Strait of Hormuz stays closed into summer

Solkraften pressar elpriserna dagtid

Michel Gubel ger sin syn på oljemarknaden