

Analys
SEB Jordbruksprodukter, 28 april 2014


 Rapsfrö av gammal skörd rasade med 7% på Matif i veckan. En annan stor förlorare var potatis med -11%. Matifs veteterminer var oförändrade, medan Chicagos steg med ett par procent, vilket speglar trenden i den väntade skördens storlek.
Arla annonserade den första egenliga sänkningen av avräkningspriset inför maj månad. Det är dock inte alltid som spotpriser är de som rör sig mest. Terminspriserna på mjölk basis SMP och smör på Eurex steg rejält för leveransdatum från hösten och framåt. SEB, som ”bättrar” Eurex köpkurs med 1%, betalar i genomsnitt 3.82 öre per Kilo per månad april 2014 – april 2015.
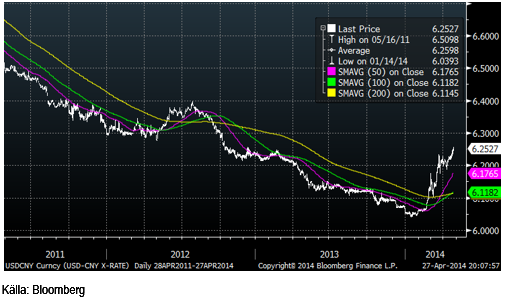
Inköpschefsindex för tillverkningsindustrin i Kina kom in på 48.3 i april, upp insignifikant från 48 i mars. Ett PMI under 50 innebär att tillverkningssektorn krymper, eller kommer att krympa, eftersom PMI är en framåtblickande indikator. Siffran fick renminbin (CNY), Kinas officiella valuta, att falla ytterligare mot andra valutor. Att allt inte står rätt till i Kina ser man av att den stadiga trenden av starkare valuta bröts i slutet av februari. Sedan dess har valutan försvagats hastigt. En svagare valuta gör att importvaror, som t ex sojabönor blir dyrare, vilket sänker efterfrågan. CNY/USD har gått från 6 till 6.25 sedan början av året.
Odlingsväder
Indien har varit ovanligt torrt och förväntas fortsätta vara det. Kina väntas få normalt väder på veteområdena norr om Peking, men söderöver väntas det fortsatt komma mindre nederbörd än normalt.
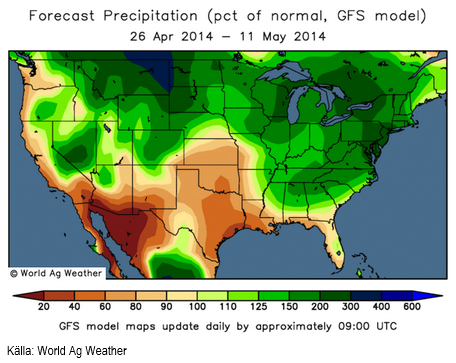
Torkan i USA håller sig kvar, som vi ser av den senaste US Drought Monitor nedan.
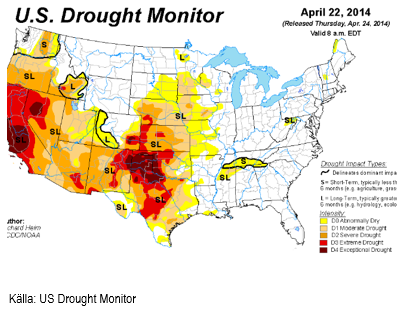
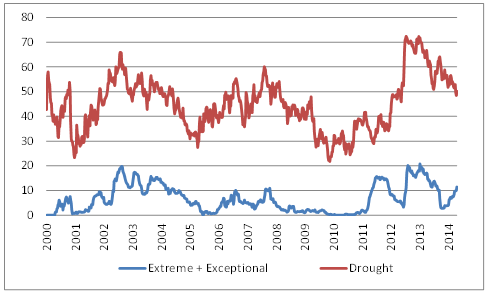
Sedan den 25 mars har andelen av USA:s yta som är torrare än normalt minskat från 52% till 50%. Däremot har andelen som är drabbade av de två värsta klassificeringarna ökat från 9.7% till 11.5%. Torrast är det i det nordvästra hörnet av Texas.
Nederbördsprognosen enligt GFS-modellen visar att Sydvästern fortsätter att få mindre nederbörd än normalt de kommande två veckorna. Vetet är i dåligt skick i dessa områden. Där sojabönor och majs odlas ser vi att det kommer mer nederbörd än normalt, de kommande två veckorna. Kalifornien ser ut att få normal nederbörd, vilket faktiskt är ovanligt.
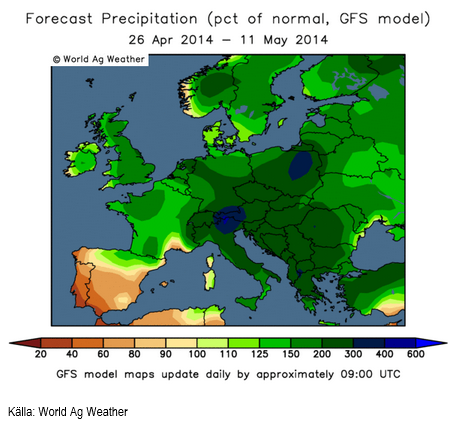
Europa fortsätter att få gott om nederbörd i stort sett överallt. ”Rain makes grain”. Det ser allt mer ut som om EU-28 kommer att få ett mycket bra odlingsår.
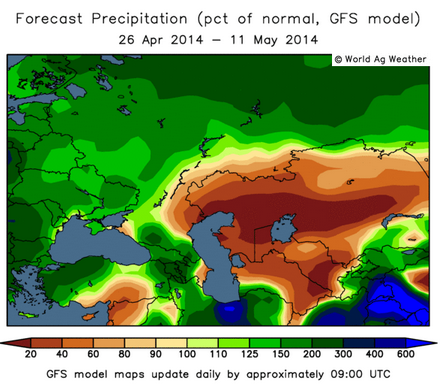
Av den här kartbilden ser vi att Ryssland och Ukraina väntas få rikligt med nederbörd de kommande två veckorna. Kazakstan ser dock betydligt torrare ut.
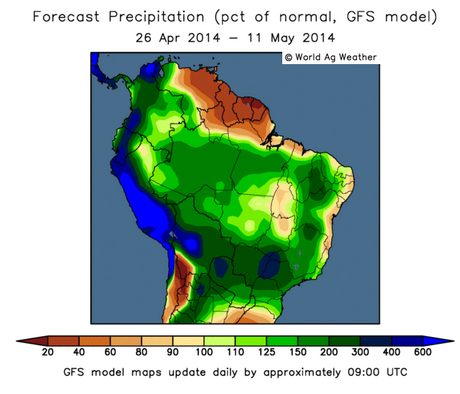
Även Sydamerika har i stort sett gott om nederbörd, i synnerhet där det har varit torrt i Brasilien förut. Norra Argentina väntas vara fortsatt torrt.
Australiens Meteorologiska byrå säger att sex av sju klimatmodeller passerar nivån för El Niño i år, med ganska hög sannolikhet att detta inträffar redan i juli. Detta kan sänka skörden i Australien med 10 mt ton vete om El Niño håller i sig under hösten och vintern. En tidig effekt kan också ge mindre nederbörd över Dakota-staterna i USA, vilket dock inte påverkar skörden av vete där negativt, eftersom den redan är klar. Skörden av majs lite längre österut i de nordliga delstaterna av USA kan dock påverkas, men El Niño påverkar USA endast lokalt mitt i landet i de allra nordligaste delstaterna. I resten av världen kan noteras att även Indonesien brukar bli torrt, där det bland annat odlas robusta-kaffe av betydelse för globala balanser och palmolja, också av betydelse för globala balanser. El Niño kommer alltså med all sannolikhet minska global produktion av vete med ca 10 mt (Australien), palmolja och robusta kaffe.
Vete
Vetepriset har stigit i veckan pga oro för vädret i USA och framförallt för ökad oro för utvecklingen i Ukraina. Överenskommelsen i Geneve bröts nästan genast. Marknadens oro för Ukraina har huvudsakligen kanaliserats till högre pris på vete och endast i mindre del till högre pris på majs. Detta är underligt, eftersom 95% av Ukrainas veteproduktion är höstvete och alltså redan sått sedan länge och knappast i fara vid en förvärrad konflikt. Rapporter från Ukraina säger dessutom att vetet och kornet (en annan stor gröda där) är i utmärkt skick. Ukraina är världens 6 eller 7 största exportör av vete, men tredje störst på majs. Av de frågor vi får från media och placerare, är det uppenbart att kunskapen om vad Ukraina odlar och säljer inte är så väl spridd, då de flesta tycks tro att det är vårvete.
Dessutom handlar diskussionerna om hur EU och västvärlden kan hjälpa Ukraina till stor del om frihandelsavtal som verktyg för hjälpen. I Bryssel kommer förslaget att ta bort tullen på varor importerade från Ukraina och det kommer säkerligen att klubbas igenom, eftersom det sänker matpriserna i EU, samtidigt som priset just nu inte är så lågt att lantbrukarna i EU lider av det. IMF sammanträder den 30 april för att besluta om ett stödpaket till Ukraina. Det borde alltså inte finnas någon grund för oro för mindre utbud av vete från Ukraina. Skörden kommer att bärgas, den kommer att vara mycket stor (av vete) och den kommer att gå på export. Och detta kommer inte att gynna Ukrainas statskassa alls, eftersom lantbruk i Ukraina är skattebefriat.
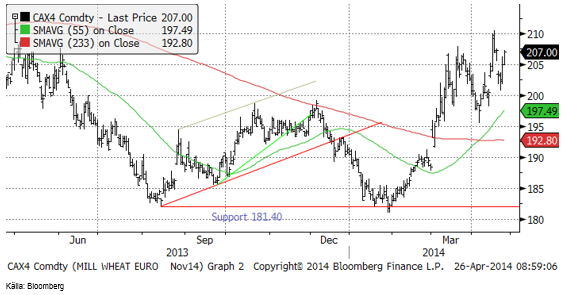
Tekniskt är priset på novemberkontraktet på Matif i positiv trend, men kraften i uppgången har avtagit. Priset på terminerna är tillbaka på samma nivå som för ett år sedan och som vi ser det är priset ”högt”. Det senaste året har skörden handlasts i intervallet 182 – 210 euro. Det borde vara intressant för lantbrukare att successivt prissäkra de här nivåerna mellan 205 och 210 euro.
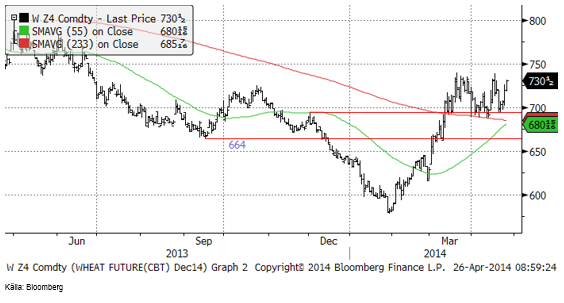
Chicagovetet (december) har fått stöd på 700 cent och ligger mellan 700 och 740 cent just nu. Detta prisintervall kan vara antingen toppen efter uppgången från 550 cent, eller en andhämtningspaus inför ytterligare en prisuppgång mot de gamla topparna upp mot 800 cent. Man ska komma ihåg att vetepriset i USA är lägre i USA än i Europa. Samtidigt som Europa kommer att få en av sina största skördar någonsin, kan USA få en av sina mindre pga den pågående torkan.
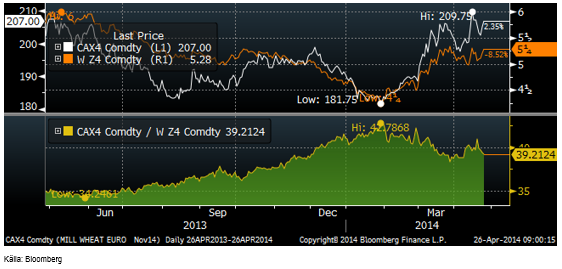
Chicagoterminerna fortsätter att vinna tillbaka mark mot Matif, just på grund av att USA har sämre väder och EU-28 så nära perfekt att man inte bör klaga, samtidigt som Matif är dyrare än Chicago. Vi tror att detta kommer att fortsätta. Kvoten mellan priserna (omräknade till euro) är 39 mot 35 för ett år sedan. Det finns fortfarande goda möjligheter för Chicagovetet att stiga mer än Matifvetet.
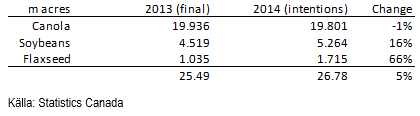
Stats Canada rapporterade areal för vetet i veckan. Det var 24.8 miljoner acres, vilket var mer än marknaden hade väntat sig, dock 5% mindre än förra året. Eftersom Kanada inte lyckats exportera så värst mycket av förra årets rekordskörd, blir det en rekordstor ingående balans på det nya året. En hög ingående balans påverkar utbud och efterfrågan precis lika mycket som ny skörd.
Indiens skörd justerades ner i veckan till 96 mt, vilket ändå är högre än förra året (USDA 93.51 mt).
EU-28 har gett ut exportlicenser för 24.663 miljoner ton ”soft” wheat sedan den 1 juli förra året när marknadsföringsåret 2013/14 började, till och med den 22 april, rapporterade Europakommissionen i torsdags. Exporten är 49% högre än förra året och redan betydligt högre än förra årets slutsumma.
Egypten och Turkiet har nu vete så det räcker till långt efter skörden. Såväl den rumänska som den franska skörden lär bli mycket hög. StrategieGrains upprepade i veckan ett skördeestimat för EU-28 på 137 mt. Förväntningar på en hög skörd och det faktum att importländerna i stort sett har köpt färdigt bör sätta press på de höga priserna på korta terminskontrakt.
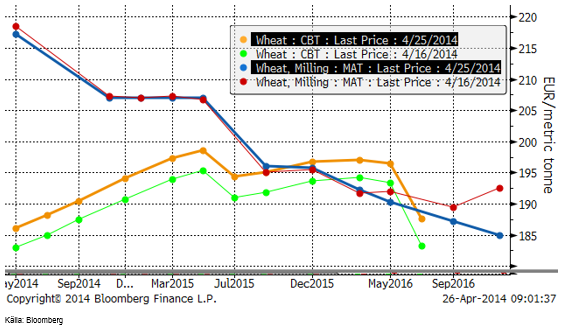
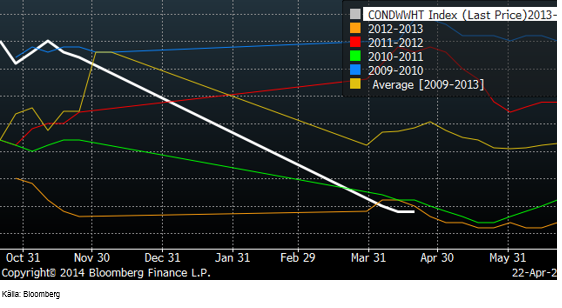
Nedan ser vi terminskurvorna för Chicagovete och Matif i fredags och veckan innan.
Måndagens crop condition rapport för vete visade att vetet i genomsnitt för de 18 delstater som producerar mest vete i USA per den 18 april låg oförändrat på 34% i ”good” och ”excellen condition”. Spridningen är stor, där Oklahoma har 11% i ”good” och inget i ”excellent”. Texas har 11% ”good” och 1% ”excellent”. De som har bäst vete just nu är Idaho (87% good/excellent) och Kalifornien 80%. Flera delstater har över 60% i good/excellent.
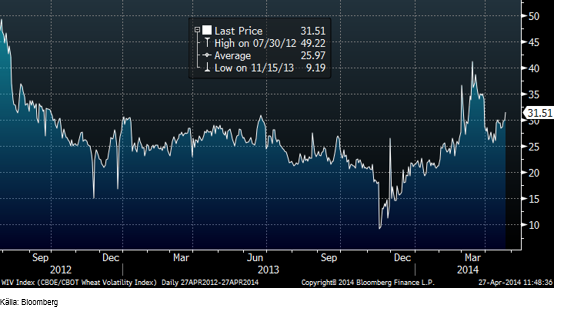
CBOE/CBOT:s Wheat Volatility Index som mäter vilken nivå på volatilitet som marknaden prissätter optioner till, har stigit till en högre nivå än vad som noterades under hela förra året. Den ligger just nu på 31.5% volatilitet och den lägsta nivån förra året var 9.19%. Uppgången i handlad volatilitet återspeglar inte hur mycket marknaden rör sig. Det återspeglar en oro för hur marknadspriset kan komma att röra sig de kommande månaderna. En hel del av den här volatiliteten är nog en riskpremie och det är antagligen bra värde i att sälja volatilitet, genom att utfärda optioner.
Vi behåller neutral vy basis Matif, dock på gränsen till säljrekommendation. För Chicago är vi som framgår något mer positiva (men fortfarande inom ”neutral-spektrumet”).
Däremot är handlad volatilitet för optioner relativt hög. Vi anser att optionsmarknaden tar höjd för en oro som är överskattad. Vi rekommenderar alltså att man försöker sälja uppsida via utfärdande av köpoptioner (vilket kan vara en bra strategi för naturliga säljare av vete) och att naturliga köpare av vete försöker utfärda säljoptioner (ger någon annan rätten att sälja till utfärdaren till ett (lågt) lösenpris) och i gengäld erhålla en betalning för optionen nu.
Maltkorn
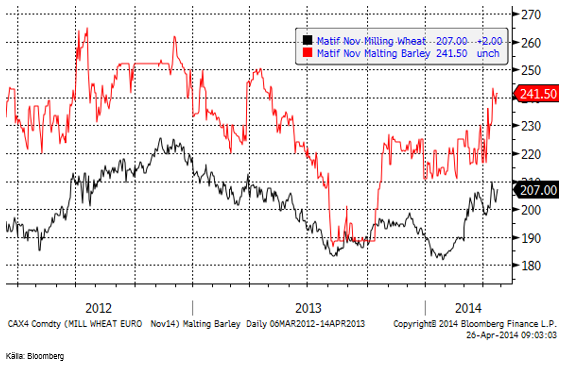
Maltkornsterminerna steg ordentligt i veckan och ligger nu 34 euro över Matifs vetetermin för november. För två veckor sedan var skillnaden 30 euro.
Majs
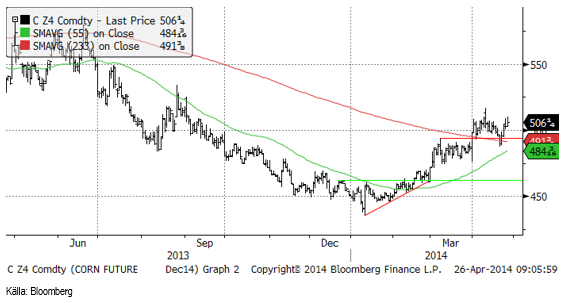
Decemberkontraktet på majs steg i veckan till en ny årshögsta rekylerade ner efter att varit uppe mot 520 cent. Sådden i USA ligger efter pga det kalla och blöta vädret, men vi anser att detta inte är något att oroa sig för än så länge eftersom den positiva effekten av regn kanske till och med väger över till en fördel.
Den andra plantings-rapporten för året, från i måndagen 21 april visade att 6% av majsarealen i USA var sådd per den 18 april. Kommentatorerna var snabba att påpeka att detta är sent, men det är faktiskt inte alarmerande sent. Förra året var 4% sått så här dags och det normala är 13%.
Majs är den enda gröda av de tre stora, som inte återhämtat hela prisfallet under förra året. Såväl vete som sojabönor är tillbaka på samma pris som de hade för ett år sedan.
Vi går över till neutral rekommendation för majs.
Sojabönor
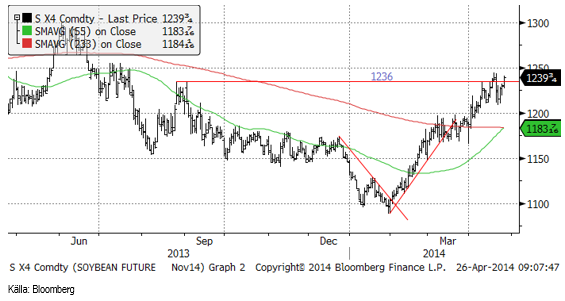
Novemberkontraktet på sojabönor i Chicago bröt motståndet på 1236 cent. Nästa tekniska motståndsnivå är 1250. Tekniskt stöd finns vid 1200 cent.
Kina annullerar kontrakt på köpt soja från USA. Inköpschefsindex för tillverkningsindustrin i april i Kina kom in 0.3 enheter högre än i mars på 48.3. Inköpschefsindex under 50 innebär att tillverkningsindustrin krymper och siffran visar att Kinas problem med tillväxten fortsätter. Marknadsbedömare sade i veckan att Kinas intresse för ny skörd också har minskat.
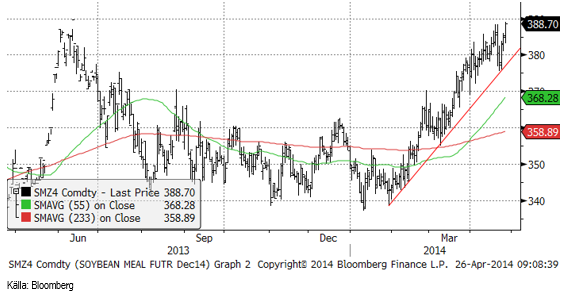
Sojamjölet fortsatte upp ett par dollar i veckan, men ”borde” ur ett tekniskt perspektiv ha stigit färdigt.
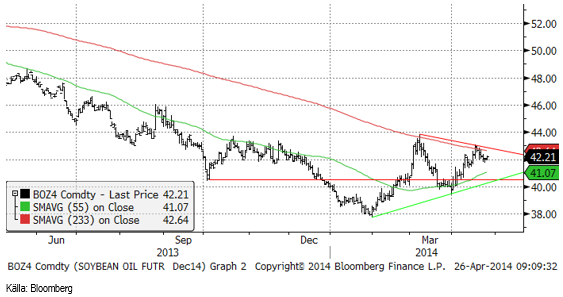
Sojaoljan steg initialt, men backade sedan tillbaka.
Sådden av sojabönor brukar komma igång i slutet av april och början av maj. I år är det stora skillnader mellan de södra och norra delarna av landet, där de södra kan komma igång tidigare och de norra lite senare än normalt.
Tekniskt ser det ut som om styrkan i sojamarknaden kommer att mattas men vi behåller neutral som rekommendation för soja.
Raps
StatsCan rapporterade 0.7% lägre areal canola (19.8 miljoner acres) än förra året. Utifrån USDA:s prospective plantings för USA som visade en mycket större areal canola är detta nog en besvikelse. För de som fokuserat på den sena våren i Kanada är nog inte förvånade. Men det verkar som om arealen istället gått till andra oljeväxter, som sojabönor och lin. Totalt sett ökar arealen av oljeväxter i Kanada. Dessutom verkar det vara mer regel än undantag att ”intentions” underskattar den slutliga arealen av canola varje år.
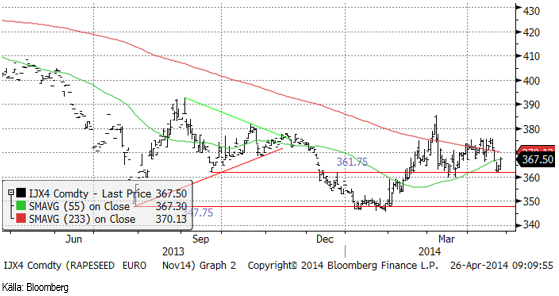
Novemberkontraktet på Matif föll i veckan ner till det tekniska stödet på 361.75 euro och studsade där.
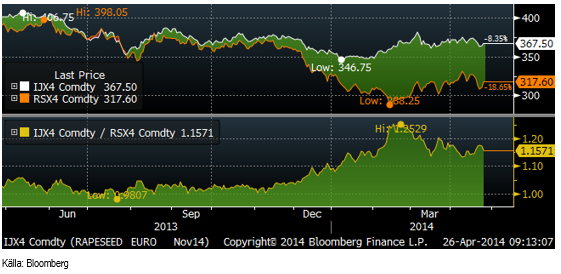
Skillnaden mellan kanadensisk canola i eurotermer och Matifs rapskontrakt (båda för novemberleverans) ligger kvar kring 15%. Det är alltjämt en hög premie för Matifs raps, som vi fortsatt gärna vill vara sålda.
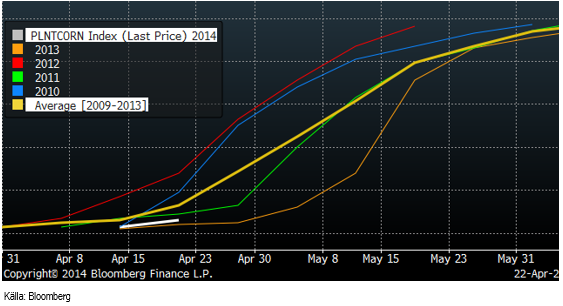
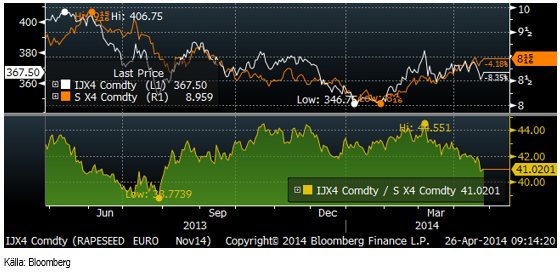
Nedanför ser vi kvoten mellan rapsfrö (november) och sojabönor (november, omräknat till euro. Kvoten har fallit från 42 till 41 på två veckor. Ur detta perspektiv börjar raps bli ”billig” i förhållande till sojabönor.
Vi går nu ur säljrekommendationen för raps och går över till neutral rekommendation.
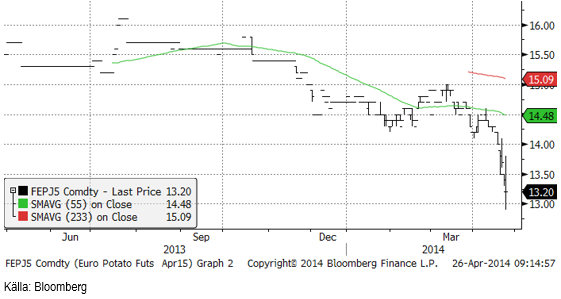
Potatis
Potatis för leverans i april nästa år sjönk har rasat de tre senaste veckorna. I början av april handlades den kommande skörden till 14.50 euro per dt. I fredags var priset nere under 13 euro, men stängde på 13.20 i fredags kväll.
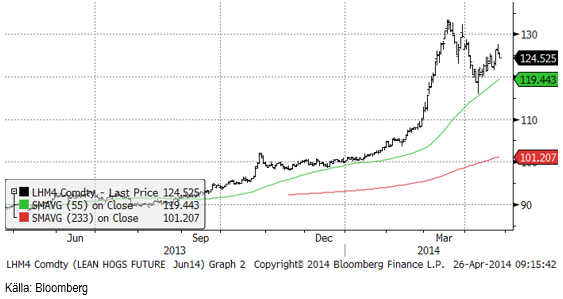
Gris
Juni-kontraktet på amerikanska lean hogs har fortsatt att rekylera uppåt. Vi noterar att uppgången skett med påtagligt mindre momentum än tidigare under året. Det är ett tecken på att marknaden står inför ett nytt, kraftigt och stort prisfall, som förmodligen går ner till 110 cent.
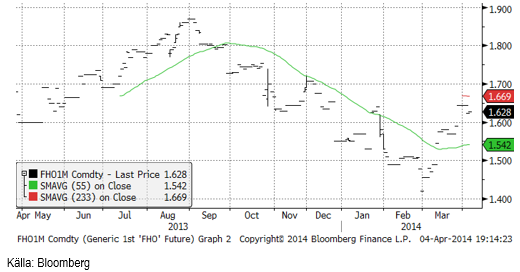
Spotkontraktet på EUREX Hogs som för två veckor sedan stod i 1.63 euro per Kg har nu stigit till 1.685 euro. Prisuppgången i Europa har skett på förhoppningar om att exportstoppet efter ASF ska tas bort och det finns utrymme för en del besvikelser. Priset har gått upp lite för fort och lite för mycket, tycker jag.
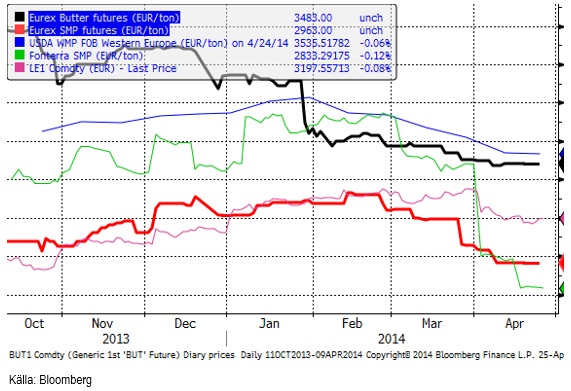
Mjölk
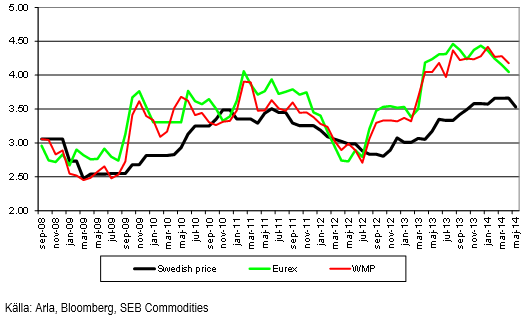
I fredags kom nyheten att Arla sänker avräkningspriset på mjölk i maj med 13 öre per Kg till 353.1 öre per Kg. Arla hänvisar till det kraftiga prisfallet på industrimarknaderna som vi sett den senaste tiden. Dessa tycks nu paradoxalt nog ha hållit sig stabila i april, som vi ser av diagrammet nedan. Men detta är inte allt.
Terminspriserna för leverans efter sommaren har handlats upp extremt kraftigt de senaste två veckorna. Uppgången är drygt 20 öre per Kg mjölkråvara för terminer från oktober till april nästa år.
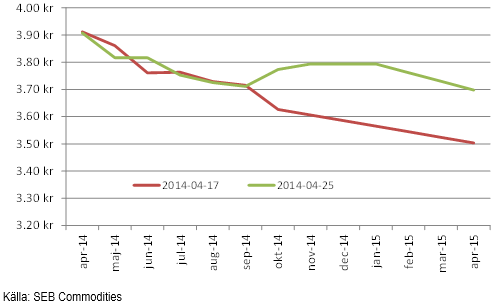
Detta innebär att genomsnittliga priset för ett Kilo mjölkråvara basis Eurex SMP och smörterminer för perioden april 2014 till och med april 2015 är 3.78 kronor. Det är en uppgång från 3.67 (+3%) på två veckor.
SEB förbättrar börsens köpkurs med 1% (så länge marknaden är på introduktionsstadium och i behov av stöd enligt vår uppfattning). Detta innebär att SEB betalar i genomsnitt 3.82 öre per Kilo per månad april 2014 – april 2015.
ARLA:s avräkningspris för maj sänktes som nämnt ovan med 13 öre och den förändringen är inlagd i nedanstående diagram. Vi ser att Eurex har varit snabbast med att reagera på marknadssignalerna och sjunkit med nästan 50 öre från toppen vid årsskiftet. USDA:s notering för helmjölkspulver (WMP) noterades också lägre i april. Arla, som alltid släpar lite efter, har gjort sin första sänkning nu, för kommande månad.
Socker
Priset på socker ligger kvar i konsolidering mellan 17 och 18.50 cent. Det är ett prisintervall som etablerades i början av förra månaden. Brasiliens skörd har kommit igång och nu rapporteras alla större bruk ha startat, samtidigt som det regnar på sina håll.
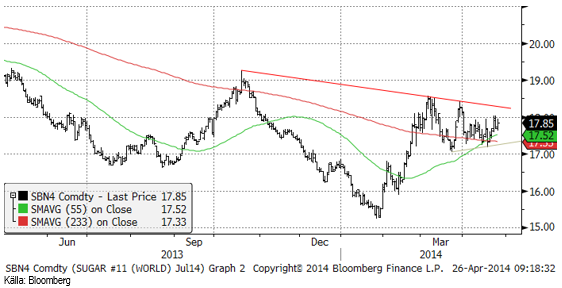
Vi går tillbaka till neutral vy på socker från tidigare sälj.
[box]SEB Veckobrev Jordbruksprodukter är producerat av SEB Commodities Sales desk och publiceras i samarbete och med tillstånd på Råvarumarknaden.se[/box]
Detta marknadsföringsmaterial, framtaget av SEB’s Commodities Sales desk, har upprättats enbart i informationssyfte.
Även om innehållet är baserat på källor som SEB bedömt som tillförlitliga ansvarar SEB inte för fel eller brister i informationen. Den utgör inte oberoende, objektiv investeringsanalys och skyddas därför inte av de bestämmelser som SEB har infört för att förebygga potentiella intressekonflikter. Yttranden från SEB’s Commodities Sales desk kan vara oförenliga med tidigare publicerat material från SEB, då den senare hänvisas uppmanas du att läsa den fullständiga rapporten innan någon åtgärd vidtas.
Dokumentationen utgör inte någon investeringsrådgivning och tillhandahålls till dig utan hänsyn till dina investeringsmål. Du uppmanas att självständigt bedöma och komplettera uppgifterna i denna dokumentation och att basera dina investeringsbeslut på material som bedöms erforderligt. Alla framåtblickande uttalanden, åsikter och förväntningar är föremål för risker, osäkerheter och andra faktorer och kan orsaka att det faktiska resultatet avviker väsentligt från det förväntade. Historisk avkastning är ingen garanti för framtida resultat. Detta dokument utgör inte ett erbjudande att teckna några värdepapper eller andra finansiella instrument. SEB svarar inte för förlust eller skada – direkt eller indirekt, eller av vad slag det vara må – som kan uppkomma till följd av användandet av detta material eller dess innehåll.
Observera att det kan förekomma att SEB, dess ledamöter, dess anställda eller dess moder- och/eller dotterbolag vid olika tillfällen innehar, har innehaft eller kommer att inneha aktier, positioner, rådgivningsuppdrag i samband med corporate finance-transaktioner, investment- eller merchantbankinguppdrag och/eller lån i de bolag/finansiella instrument som nämns i materialet.
Materialet är avsett för mottagaren, all spridning, distribuering mångfaldigande eller annan användning av detta meddelande får inte ske utan SEB:s medgivande. Oaktat detta får SEB tillåta omfördelning av materialet till utvald tredje part i enlighet med gällande avtal. Materialet får inte spridas till fysiska eller juridiska personer som är medborgare eller har hemvist i ett land där sådan spridning är otillåten enligt tillämplig lag eller annan bestämmelse.
Skandinaviska Enskilda Banken AB (publ) är ett [publikt] aktiebolag och står under tillsyn av Finansinspektionen samt de lokala finansiella tillsynsmyndigheter i varje jurisdiktionen där SEB har filial eller dotterbolag.

Market is starting to take US/Iran headlines with a pinch of salt. Brent crude rose $2.8/b yesterday to an official close of $112.1/b. But after that it traded as low as $108.05/b before ending late night at around $109.7/b. Through the day it traded in a range of $106.87 – 112.72/b amid a flurry of news or rumors from Iran and the US. ”US temporary sanctions during negotiations” (falls alarm). ”We will bomb Iran” (not anyhow),… etc. While the market is still fluctuating to this kind of news flow, it is starting to take such headlines with a pinch of salt.

We’ll see. Maybe, maybe not. The Brent M1 contract is trading at $110.2/b this morning which very close to the average ticks through yesterday of $110.4/b.
Trump with bearish, verbal intervention whenever Brent trades above $110/b it seems. What seems to be a pattern is that Trump states something like ”very good negotiations going on with Iran”, ”New leaders in Iran are great,..”, ”Great progress in negotiations,…”, ”Deal in sight,..” etc whenever the Brent M1 contract trades above $110/b. An effort to cool the market. These hot air verbal interventions from Trump used to have a heavy bearish impact on prices, but they now seems to have less and less effect unless they are backed by reality.
As far as we can see there has been no real progress in the negotiations between the US and Iran with both sides still standing by their previous demands.
Iran is getting stronger while the cease fire lasts making a return to war for Trump yet harder. Iran is naturally in constant preparation for a return to war given Trump’s steady threats of bombing Iran again. Iran is naturally doing what ever is possible to prepare for a return to war. And every day the cease fire lasts it is better prepared. This naturally makes it more and more difficult and dangerous for the US to return to warring activity versus Iran as the consequences for energy infrastructure in the Persian Gulf will be more and more severe the longer the cease fire lasts. Israel seems to see it this way as well. That the war is not won and that current frozen state of a cease fire gives Iran opportunity to rebuild military and politically.
Global inventories are drawing down day by day. How much? In the meantime the Strait of Hormuz stays closed. There is varying measures and estimates of how much global inventories are drawing down. Our rough estimate, back of the envelope, is that global inventories are drawing down by at least some 10 mb/d or about 300 mb/d in a balance between loss of supply versus demand destruction. Other estimates we see are a monthly draw of 250-270 mb/d. The IEA only ’measured’ a draw in global observable stocks of 117 mb in April with oil on water rising 53 mb while on shore stocks fell 170 mb. But global stocks are hard to measure with large invisible, unmeasured stocks. As such a back of the envelope approach may be better.
Oil products is what the world is consuming. Oil product prices likely to rise while product stocks fall. Strategic Petroleum Reserves (SPR) are predominantly crude oil. Discharging oil from OECD SPR stocks, a sharp reduction in Chinese crude imports and a reduction in global refinery throughput of 6-7 mb/d has helped to keep crude oil markets satisfactorily supplied. But global inventories are drawing down none the less. And oil products is really what the world is consuming. So if global refinery throughput stays subdued, then demand will eventually have to match the supply of oil products. The likely path forward this summer is a steady draw down in jet fuel, diesel and gasoline. Higher prices for these. Then, if possible, higher refinery throughput and higher usage of crude in response to very profitable refinery margins. And lastly sharper draw in crude stocks and higher prices for these. But some 6 mb/d of oil products used to be exported through the Strait of Hormuz. And it may not be so easy to ramp up refinery activity across the world to compensate. Especially as Ukraine continues to damage Russian refineries as well as Russian crude production and export facilities.
Watch oil product stocks and prices as well as Brent calendar 2027. What to watch for this summer is thus oil product inventories falling and oil product premiums to crude rising. Another measure to watch is the Brent crude 2027 contract as it rises steadily day by day as the Strait of Hormuz stays closed and global oil inventories decline. The latter is close to the highest level since the start of the war and keeps rising.
The Brent M1 contract and the Brent 2027 prices and current price of jet fuel in Europe (ARA). All in USD/b

Our back of the envelope calculation of the global shortage created by the closure of the Strait of Hormuz. Note that 3.5 mb/d of discharge from SPR is also a draw. Note also that ’Forced demand loss’ of 2.5 mb/d is probably temporary and will fall back towards zero as logistics are sorted out leaving ’Price demand loss’ to do the job of balancing the market. Thus a shortfall of at least 9 mb/d created by the closure. More if SPR discharge is included and more if Forced demand loss recedes.

Brent is climbing higher. Front-month is at USD 106.3/bl this morning, close to a weekly high and a USD 9/bl jump from Mondays open. This is the move we flagged as a risk earlier in the week: the market shifting from ”a deal is around the corner” to ”this is going to take longer than we thought”.

Analyst Commodities, SEB
During April, rest-of-year Brent remained remarkably stable around USD 90/bl. A stability which rested on one single assumption: the SoH reopens around 1 May. That assumption is now slowly falling apart.
As we highlighted yesterday: every week of delay beyond 1 May adds (theoretically) ish USD 5/bl to the rest-of-year average, as global inventories draw 100 million barrels per week. i.e., a mid-May reopening implies rest-of-year Brent closer to USD 100/bl, and anything pushing into June or July takes us meaningfully higher.
What’s changed in the last 48 hours:
#1: The US military has formally warned that clearing suspected sea mines from SoH could take up to six months. That is a completely different timescale from what the financial market is pricing. Even a political deal tomorrow does not immediately reopen the strait.
#2: Trump has shifted his tone from urgency to ”strategic patience”. In yesterday’s press conference: ”Don’t rush me… I want a great deal.” The market is reading this as a president no longer feeling pressured by timelines, with the naval blockade running in the background.
#3: So far, the military activity is escalating, not de-escalating. Axios reports Iran is laying more mines in SoH. The US 3rd carrier strike group (USS George H.W. Bush) is arriving with two countermine vessels. Trump yesterday ordered the US Navy to destroy any Iranian boats caught laying mines. While CNN reports that the Pentagon is actively drawing up plans to strike Iranian SoH capabilities and individual Iranian military leaders if the ceasefire collapses. i.e., NOT a attitude consistent with an imminent deal!
Spot crude and product prices eased off the early-April highs on a combination of system rerouting and deal optimism. Both now weakening. Goldman estimates April Gulf output is reduced by 14.5 mbl/d, or 57% of pre-war supply, a number that keeps getting worse the longer this drags on.
Demand-side adaptation is ongoing: S. Korea has cut its Middle East crude dependence from 69% to 56% by pulling more from the Americas and Africa, and Japan is kicking off a second round of SPR releases from 1 May. But SPRs are finite.
Ref. to the negotiations, we should not bet on speed. The current Iranian leadership is dominated by genuine hardliners willing to absorb economic pain and run the clock to extract concessions. That is not a setup for a rapid resolution. US/Israeli media briefings keep framing the delay as ”internal Iranian divisions”, the reality is more complicated and points toward weeks and months, not days.
Our point is that the complexity is large, and higher prices have only just started (given a scenario where the negotiations drag out in time). The market spent April leaning on the USD 90/bl rest-of-year assumption; that case is diminishing by the hour. If ”early May reopening” is replaced by ”June, July or later” over the next week or two, both crude and products have meaningful room to reprice higher from here. There is a high risk being short energy and betting on any immediate political resolution(!).
Down on Friday. Up on Monday. The Brent June crude oil contract traded down 5.1% last week to a close of $90.38/b. It reached a high of $103.87/b last Monday and a low of $86.09/b on Friday as Iran announced that the Strait of Hormuz was fully open for transit. That quickly changed over the weekend as the US upheld its blockade of Iranian oil exports while Iran naturally responded by closing the SoH again. The US blew a hole in the engine room of the Iranian ship TOUSKA and took custody of the ship on Sunday. Brent crude is up 5.6% this morning to $95.4/b.
The cease-fire is expiring tomorrow. The US has said it will send a delegation for a second round of negotiations in Islamabad in Pakistan. But Iran has for now rejected a second round of talks as it views US demands as unrealistic and excessive while the US is also blocking the Strait of Hormuz.
While Brent is up 5% this morning, the financial market is still very optimistic that progress will be made. That talks will continue and that the SoH will fully open by the start of May which is consistent with a rest-of-year average Brent crude oil price of around $90/b with the market now trading that balance at around $88/b.
Financial optimism vs. physical deterioration. We have a divergence where the financial market is trading negotiations, improvements and resolution while at the same time the physical market is deteriorating day by day. Physical oil flows remain constrained by disrupted flows, longer voyage times and elevated freight and insurance costs.
Financial markets are betting that a US/Iranian resolution will save us in time from violent shortages down the road. But every day that the SoH remains closed is bringing us closer to a potentially very painful point of shortages and much higher prices.
The US blockade is also a weapon of leverage against its European and Asian allies. When Iran closed the SoH it held the world economy as a hostage against the US. The US blockade of the SoH is of course blocking Iranian oil exports. But it is also an action of disruption directed towards Europe and Asia. The US has called for the rest of the world to engaged in the war with Iran: ”If you want oil from the Persian Gulf, then go and get it”. A risk is that the US plays brinkmanship with the global oil market directed towards its European and Asian allies and maybe even towards China to force them to engage and take part. Maybe unthinkable. But unthinkable has become the norm with Trump in the White House.


Sommarväder skapar prisrally på elbörsen
Oil product price pain is set to rise as the Strait of Hormuz stays closed into summer

Solkraften pressar elpriserna dagtid

Michel Gubel ger sin syn på oljemarknaden