

Analys
SEB Jordbruksprodukter, 21 oktober 2013


 Det var en positiv vecka för jordbruksprodukter förra veckan. Alla spannmål som vete och majs steg med 2% i pris. Sojabönorna steg även de med 2% och rapsen med 3%. Sojamjölet backade med 3%, medan sojaoljan, som fallit kraftigt i pris efter en lång nedgång återhämtade sig med 4%. Efter en brand i ett lagerhus i Santos, hamnstad till São Paulo, steg sockerpriset från 19 cent upp mot 20 cent, men stängde på 19.50. Mjölkpriserna var oförändrade på såväl Eurex som på CME. Mjölkpriserna i Sverige fortsätter att stiga, genom att med eftersläpning anpassa sig till de högre internationella börspriserna. Skillnaden mellan det internationella priset och det svenska är historiskt högt på 80 öre per kilo. Om inte börspriserna faller, borde priset på mjölkråvara i Sverige kunna nå en ny rekordnivå, i vart fall den högsta på fem år inom någon eller några månader. Samtidigt har pristrenden på Eurex planat ut, även om den volatila Fonterranoteringen stigit något den senaste tiden. Kinas BNP-statistik kom in på +7.8% tillväxt för det tredje kvartalet. Det var precis på förväntningarna, men högre än tidigare under året. Man får tolka det som att Kinas ekonomi håller på att få upp farten igen, vilket har stor betydelse för efterfrågan på råvaror. En temporär budgetöverenskommelse har nåtts i USA. USDA meddelade i torsdags att oktober månads WASDE-rapport inte kommer att publiceras och att nästa som vanligt kommer ut den 8 november. Crop progress för den 7 och 15 oktober kommer inte heller att publiceras, utan nästa kommer den 21 oktober.
Odlingsväder
Väderprognoser för USA indikerar gynnsamt väder för sådden och utvecklingen av det amerikanska höstvetet. Det finns en del analytiker som redan nu säger att höstvetet kommer att vara i det bästa tillståndet sedan 2010 när det går in i vintervila.
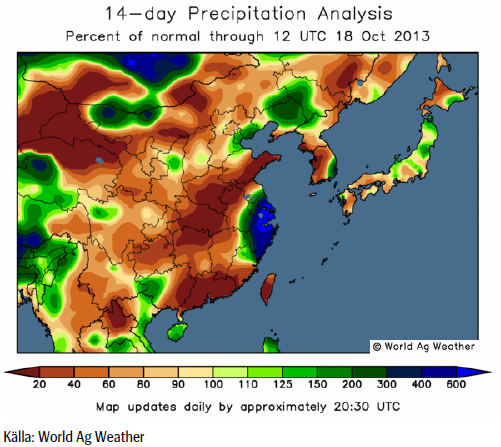
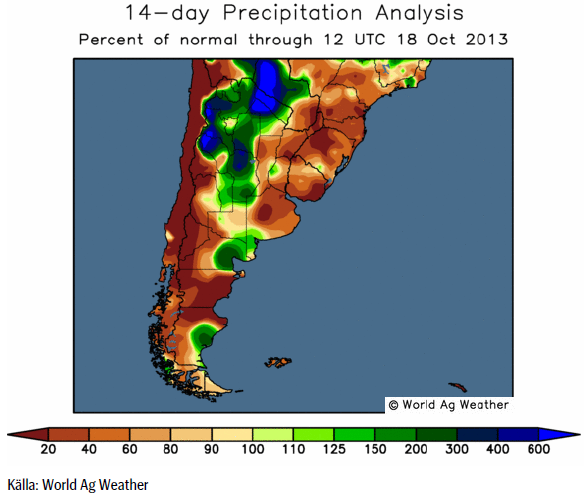
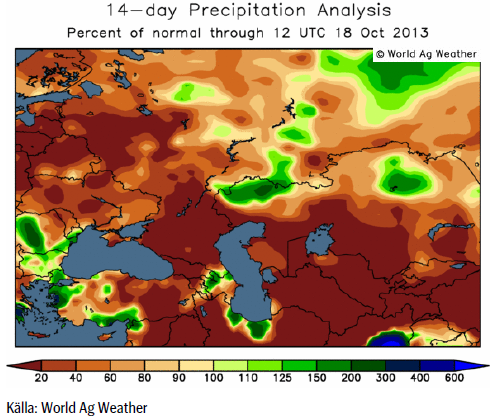
Så till orosmomenten: Torkan i Kina, Argentina och Ryssland. Vi ser på kartbilder som visar avvikelsen från normal nederbörd nedan.
Vete
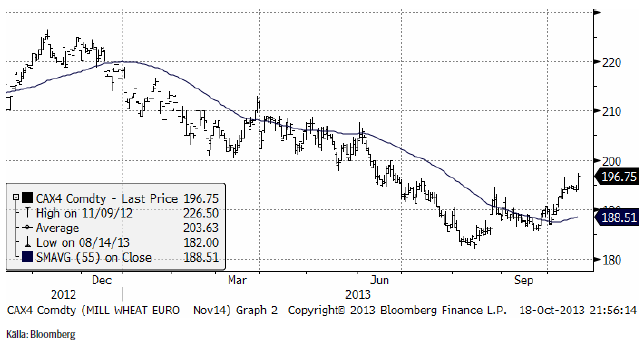
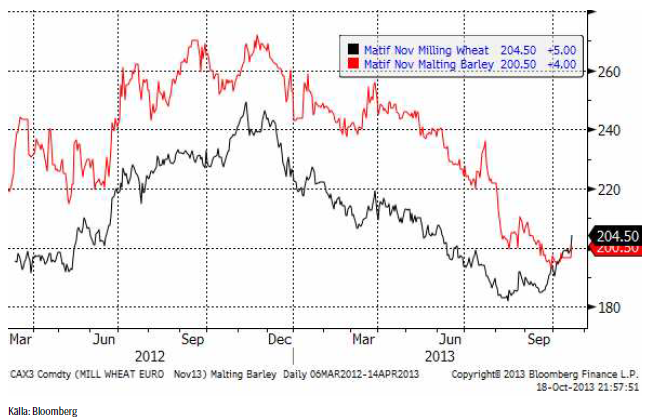
November månads terminskontrakt på Matif bröt igenom motståndet på 200 euro och avslutade veckan med att handlas på 204.75 euro per ton. Eftersom detta kontrakt snart går in i leverans, i början på november, lämnar vi det och hoppar ett år framåt, till november 2014. I kursdiagrammet nedanför ser vi att priserna ligger en bit under årets priser. Det råder alltså ”backwardation” i terminsmarknaden för kvarnvete på Matif. Vi ser också fredagens starka prisuppgång, som ”borde” kunna fortsätta och ta Nov 2014 till 200 euro, även det ett tekniskt motstånd. Om det bryts, ligger nästa motståndsnivå på 210 euro.
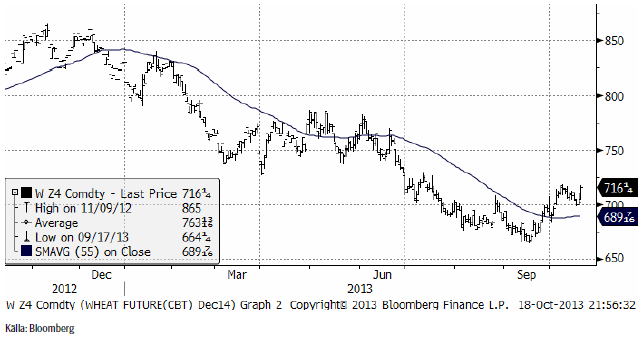
Decemberkontraktet 2014 på CBOT steg krafitgt även det, i fredags, och avslutar därmed en liten rekylfas. Siktet ser ut att bara inställt på 750 cent per bushel.
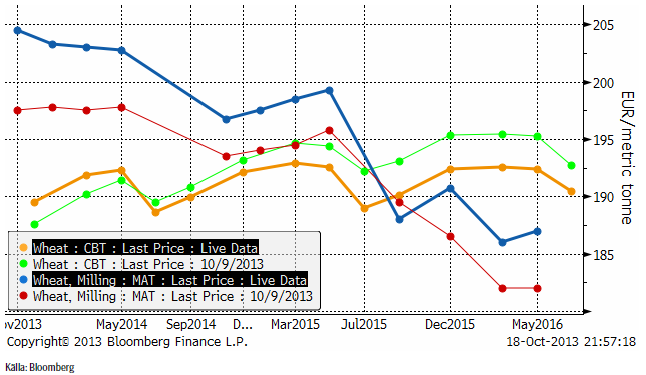
Nedan ser vi terminskurvorna för Chicagovete och Matif. Från att ha varit ”nästan” i backwardation är nu Matif helt och hållet det. Det innebär att ”bristsituationen” har förvärrats ytterligare, vilket i sin tur beror på att Europas spannmålsbönder blivit ännu mer irrationella. De borde sälja sin spannmål och köpa terminer. Spannmålen är dyrare än terminerna.
I torsdags estimerade Argentinas jordbruksdepartement den kommande veteskörden till 8.8 mt. USDA låg senast på 12 mt och International Grains Council hade den på 11 mt.
AgCanada (AAFC) reviderade sin prognos för Kanadas totala veteproduktion genom att justera upp den till 33.2 mt från förra månadens estimat på 30.7 mt.
Torkan i Kina är bra för skörden av majs och sojabönor, men hindrar sådden av höstvetet. Detta väntas leda till att 10% mindre areal blir sådd i år än man tidigare hoppats. CNGOIC estimerar Kinas vete produktion till 122.17 mt 2012/13, jämfört med USDA’s estimat på 121 mt.
Indien kan komma att sänka prisgolvet på vete för att främja exporten.
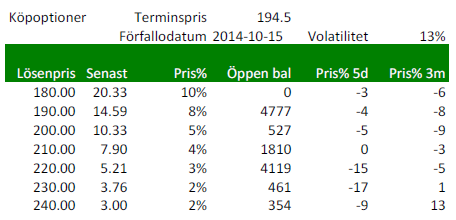
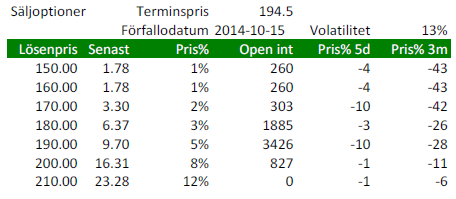
Nedan ser vi priserna på köpoptioner på Matif på November-2014 (Matif vete). Notera att volatiliteten 13% är ganska låg. Volatiliteten brukar vara låg när priserna är låga. Den är faktiskt något lägre än förra veckan, vilket inneburit att priset på såväl köpoptioner som säljoptioner gått ner i pris.
Nedanstående optioner är köpoptioner. Terminen (Nov 2014) handlas i 194.25 euro per ton. En köpoption om ett ton vete, som ger rätt att köpa vete för 200 euro kostar 10.33 euro, eller 5% av 194.25 euro. När man köper optionen får man betala det beloppet (plus lite till för säljkurs, detta är senast betalt). Om priset i oktober (vid förfall) nästa år är 250 euro på terminen betalar banken 50 euro till optionsinnehavaren (omräknat till kronor om man vill och kommer överens om det). Om terminen står i 190 euro (under lösenpriset) förfaller optionen värdelös och inget belopp betalas ut.
Nedanstående är priser på säljoptioner. Om du köpt optionen med lösenpris 200 euro (för 16.31) och terminen i oktober nästa år står i 180 euro, betalar banken ut 20 euro. Om terminspriset är över 200 euro betalar banken inte ut någonting alls och optionen förfaller värdelös.
Förra veckan varnade vi för att en rekyl skulle kunna komma, om priset inte tog sig genom 200 euro på November 2013-kontraktet på Matif. Vi sade också att en sådan rekyl skulle vara ett ytterligare köptillfälle. Tyvärr fick vi inte den chansen, att köpa mer. Priset låg precis under 200 euro hela veckan, för att slutligen gå över. Vi rekommenderar naturligtvis en köpt position i vete. Marknaden har visat att trenden har vänt och kommer förmodligen att stiga ytterligare i veckan som kommer.
Maltkorn
Terminspriset (november) ligger nu 4.5 euro under vetepriset, för november 2013, som snart förfaller.
Majs
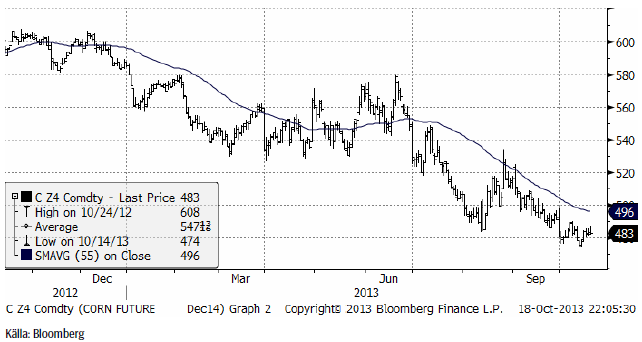
Majspriset – och nu tittar vi på nästa års skörd, december 2014-kontraktet, steg i veckan. Nedgången från slutat av augusti har tappat kraft, vilket brukar föregå en vändning uppåt.
Sådden av sommarmajs är i full gång i Brasilien sedan slutet av september. Längst har lantbrukare i södra delen av landet kommit, där majs förlorar stort mot sojabönor. CONAB rapporterar från Brasilien att arealen av majs kan bli den minsta sedan 1970-talet, när CONAB började föra statistik. I Paraná var 56% av den väntade arealen sådd i mitten av oktober. I Rio Grande do Sul rapporteras 52% vara sått. Conab estimerar att arealen kan bli 6.36 – 6.57 mha, som är 3.7% – 6.8% lägre än förra året. Hektarskörden estimeras bli 5,104 Kg / ha. Om man tar hänsyn till skörd nummer två, säger CONAB att den totala arealen kan bli 15.36 – 15.57 mha, vilket kan leda till en skörd på 78.43 – 79.63 mt. Det ska jämföras med skörden förra året 2012/13 på 81 mt. Utgående lager, som i Brasilien avser innan skörd i januari, väntas bli rekordhöga 14.6 mt.
CNGOIC estimerar Kinas majs produktion till 215 mt, vilket är högre än USDA:s nuvarande estimat på 211 mt.
Vi väljer att hålla fast vid köprekommendationen.
Sojabönor
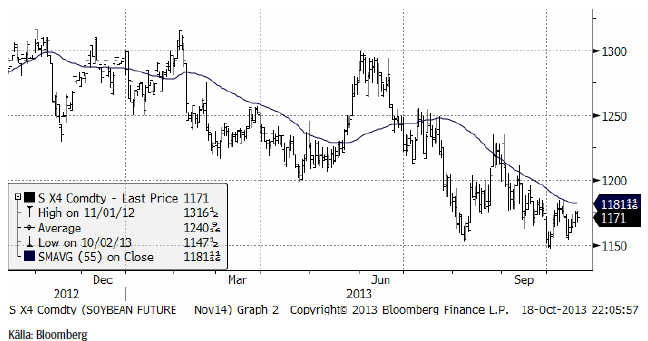
Marskontraktet 2014 har på ett mer tydligt sätt än november 2013 funnit stöd på 1250 cent per bushel. Det återstår att se om stödet på 1250 kommer att hålla, eller om priset går ända ner till 1200 cent. Fundamentalt är talar mycket för att utbudet av sojabönor kommer att öka kraftigt efter Brasiliens skörd.
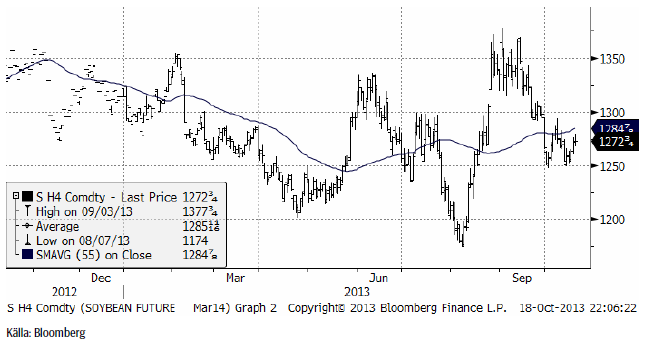
Vi ser också att November 2014 ligger betydligt under marskontraktet, se nedan.
Brasilianska CEPEA rapporterade i fredags att sojaarealen kan bli rekordstor. Med hänsyn till den trendmässiga förbättringen i avkastning, kan skörden bli uppåt 90 mt. CEPEA rapporterade också att inhemska priser fortsatte att falla i oktober. Förra veckan estimerade CONAB landets skörd 2014 till 87.6 – 89.7 mt, baserat på en areal mellan 28.7 och 29.4 mha och en avkastning på mellan 2,938 och 3,058 Kg/ha. Det är något högre än USDA:s 88 mt.
I USA talar en del nu, något oväntat, om en skörd på 43 bushels per acre. Efter torkan i augusti har marknaden tagit emot en serie av estimat från privata firmor och analytiker som visar på bättre skörd än befarat.
Vi behåller säljrekommendation.
Raps
Rapspriset (februari 2014) gick inte under det tekniska stödet på 360 euro i början av oktober och har sedan dess stigit på ett sätt som inte riktigt kan förväntas av en marknad som ska vara i fallande trend. Priset ligger nu strax under 380 euro. Om priset går över 380 euro förändras bilden ytterligare. Det kan vara en trendvändning uppåt på gång. Det återstår att se.
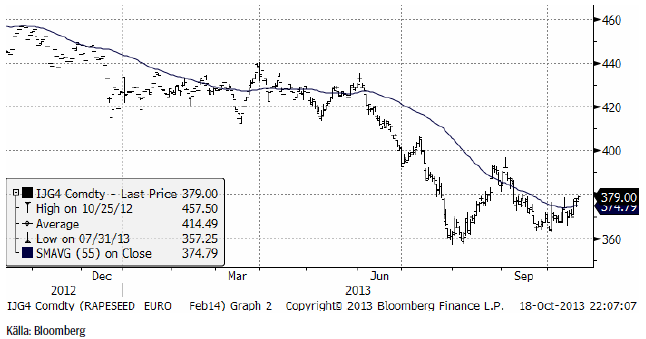
November 2014-kontraktet steg relativt kraftigt i fredags och stängde på 378 euro per ton. Även där är 380 euro ett tekniskt motstånd. 55-dagars glidande medelvärde, som är en trendindikator är nu faktiskt stigande, vilket är ett tecken på att trenden kan ha vänt uppåt.
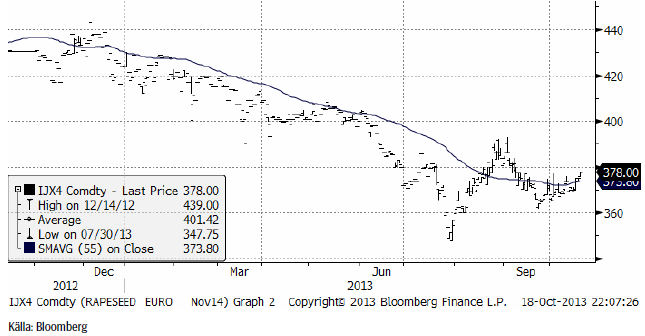
Jag tycker den tekniska bilden av rapsmarknaden ser lite ut som en trendvändning (uppåt). Därför väljer vi att lämna säljrekommendationen och gå över till en tidig köprekommendation.
Potatis
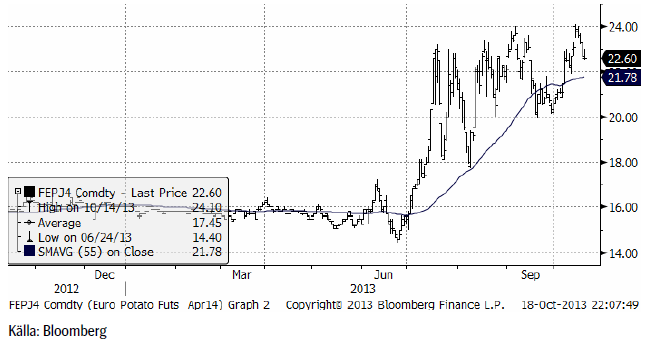
Potatispriset av årets skörd, som handlas i april-kontraktet på Eurex, nådde upp till 24 euro, samma nivå som marknaden vände ner från förra månaden. Därefter föll priset kraftigt i veckan och stängde på 22.60. Det verkar som om 24 euro är den övre gränsen för potatispriset den här säsongen.
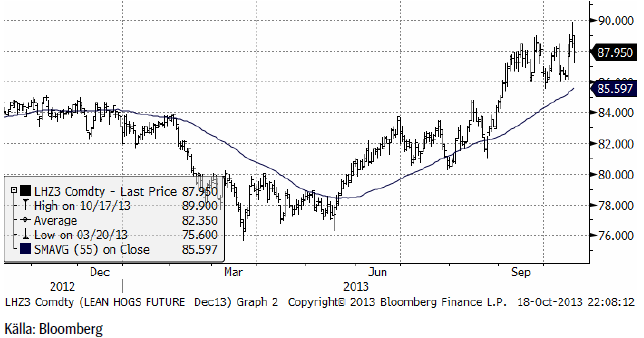
Gris
Prist på Lean Hogs inledde veckan med att stiga kraftigt och vände sedan ner lika kraftigt. Frågan är om detta innebär att man ska vänta sig ytterligare prisuppgångar, eller om det innebär det motsatta…
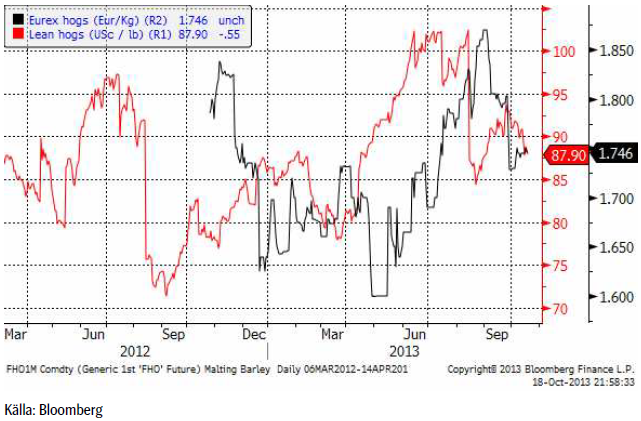
Nedan ser vi spotkontraktens historik för Eurex-grisar och Lean Hogs.
Mjölk
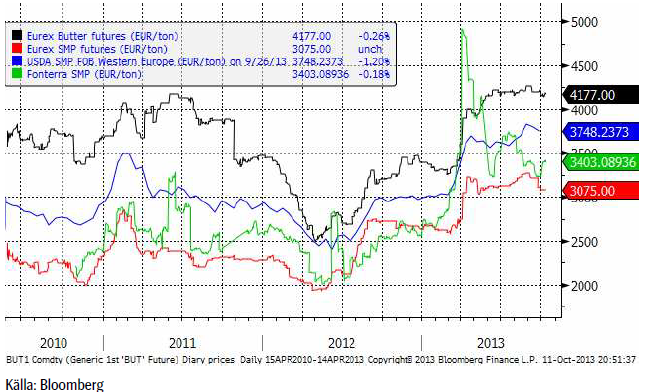
Terminerna på smör och skummjölkspulver vid Eurex-börsen var stabila och rörde sig inte mycket under veckan som gick. Fonterras pris steg något, efter det kraftiga prisfall från toppen som varit.
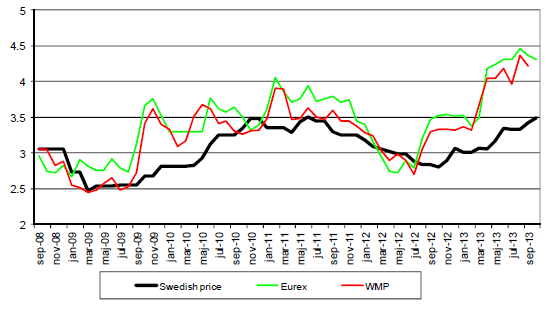
Det svenska avräkningspriset som betalas till mjölkbönder fortsätter att stiga, enligt Arlas prisnotering. Nedan ser vi ett diagram över prisutvecklingen på mjölk och på ett pris härlett från priset på terminerna på Eurex-börsen för SMP och smör, omräknat till kronor per Kg. USDA publicerar även ett index för WMP FOB Western Europe, som omräknat till kilo mjölk ligger mycket nära Eurexbörsens priser.
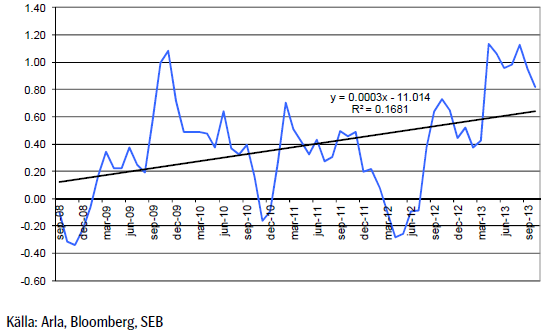
Det kan vara intressant att studera skillnaden mellan Eurex-börsens priser och avräkningspriserna på mjölkråvaran och den ser vi nedan i kronor per Kg. Vi ser att skillnaden nu ligger på en historiskt hög nivå om 80 öre per Kilo, men att den ändå har backat i takt med att det priset på mjölkråvaran successivt anpassar sig till de högre börspriserna. Det är tydligt att det finns en inbyggd eftersläpning i anpassningen och då börspriserna rört sig ”sidledes” har priset på mjölkråvara hämtat in lite av skillnaden, vilket förklarar varför skillnaden har minskat.
En till skillnaden mellan Eurex-priserna och Arla-priserna anpassad linjär kurva, tycks visa en med tiden ökande skillnad, som vi ser i diagrammet nedan. I datamaterialet är faktiskt den här tendensen till ökande skillnad statistiskt signifikant.
Socker
Marskontraktet på råsocker steg kraftigt i fredags efter att 180,000 ton råsocker förstörts i en brand i Brasilien. I fredags klockan 6 på morgonen väcktes boende i hamnstaden Santos, öster om São Paulo, av en kraftig smäll då en eldsvåda startat i ett lagerhus för socker. Snart var 3 stora lagerhus övertända. Bilder kan ses på Globos sajt.
Marknaden präglades redan innan detta av brist på socker för omedelbar leverans, eftersom regn i början på oktober fått ”crushers” av sockerrör att stå still i en vecka. Mot den bakgrunden var förlusten av exportlagret extra känsligt för marknaden.
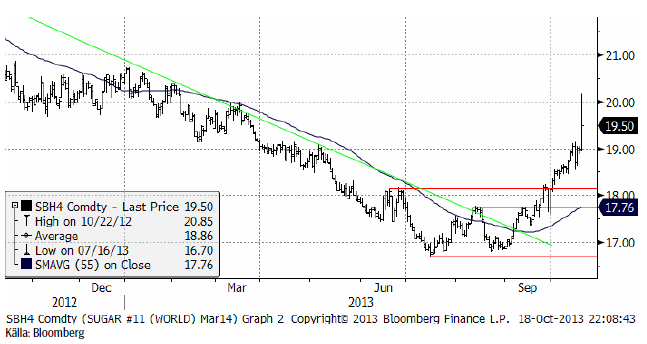
Det råder inget tvivel om att trenden för sockerpriset har vänts från att vara fallande de senaste åren, till att bli stigande. Vi rekommenderar en köpt position i socker.
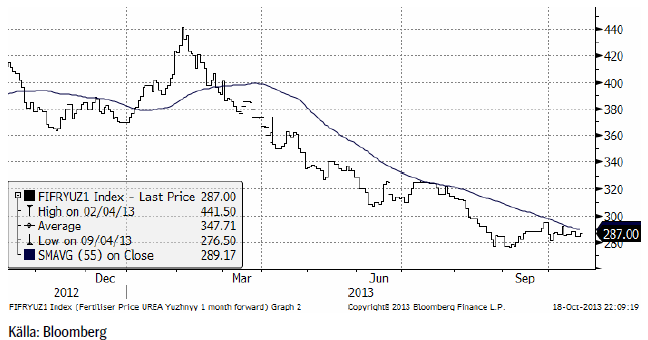
Gödsel
Priset på kväve / urea var stabilt i veckan som gick med endast små kursförändringar.
[box]SEB Veckobrev Jordbruksprodukter är producerat av SEB Commodities Sales desk och publiceras i samarbete och med tillstånd på Råvarumarknaden.se[/box]
Detta marknadsföringsmaterial, framtaget av SEB’s Commodities Sales desk, har upprättats enbart i informationssyfte.
Även om innehållet är baserat på källor som SEB bedömt som tillförlitliga ansvarar SEB inte för fel eller brister i informationen. Den utgör inte oberoende, objektiv investeringsanalys och skyddas därför inte av de bestämmelser som SEB har infört för att förebygga potentiella intressekonflikter. Yttranden från SEB’s Commodities Sales desk kan vara oförenliga med tidigare publicerat material från SEB, då den senare hänvisas uppmanas du att läsa den fullständiga rapporten innan någon åtgärd vidtas.
Dokumentationen utgör inte någon investeringsrådgivning och tillhandahålls till dig utan hänsyn till dina investeringsmål. Du uppmanas att självständigt bedöma och komplettera uppgifterna i denna dokumentation och att basera dina investeringsbeslut på material som bedöms erforderligt. Alla framåtblickande uttalanden, åsikter och förväntningar är föremål för risker, osäkerheter och andra faktorer och kan orsaka att det faktiska resultatet avviker väsentligt från det förväntade. Historisk avkastning är ingen garanti för framtida resultat. Detta dokument utgör inte ett erbjudande att teckna några värdepapper eller andra finansiella instrument. SEB svarar inte för förlust eller skada – direkt eller indirekt, eller av vad slag det vara må – som kan uppkomma till följd av användandet av detta material eller dess innehåll.
Observera att det kan förekomma att SEB, dess ledamöter, dess anställda eller dess moder- och/eller dotterbolag vid olika tillfällen innehar, har innehaft eller kommer att inneha aktier, positioner, rådgivningsuppdrag i samband med corporate finance-transaktioner, investment- eller merchantbankinguppdrag och/eller lån i de bolag/finansiella instrument som nämns i materialet.
Materialet är avsett för mottagaren, all spridning, distribuering mångfaldigande eller annan användning av detta meddelande får inte ske utan SEB:s medgivande. Oaktat detta får SEB tillåta omfördelning av materialet till utvald tredje part i enlighet med gällande avtal. Materialet får inte spridas till fysiska eller juridiska personer som är medborgare eller har hemvist i ett land där sådan spridning är otillåten enligt tillämplig lag eller annan bestämmelse.
Skandinaviska Enskilda Banken AB (publ) är ett [publikt] aktiebolag och står under tillsyn av Finansinspektionen samt de lokala finansiella tillsynsmyndigheter i varje jurisdiktionen där SEB har filial eller dotterbolag.

Market is starting to take US/Iran headlines with a pinch of salt. Brent crude rose $2.8/b yesterday to an official close of $112.1/b. But after that it traded as low as $108.05/b before ending late night at around $109.7/b. Through the day it traded in a range of $106.87 – 112.72/b amid a flurry of news or rumors from Iran and the US. ”US temporary sanctions during negotiations” (falls alarm). ”We will bomb Iran” (not anyhow),… etc. While the market is still fluctuating to this kind of news flow, it is starting to take such headlines with a pinch of salt.

We’ll see. Maybe, maybe not. The Brent M1 contract is trading at $110.2/b this morning which very close to the average ticks through yesterday of $110.4/b.
Trump with bearish, verbal intervention whenever Brent trades above $110/b it seems. What seems to be a pattern is that Trump states something like ”very good negotiations going on with Iran”, ”New leaders in Iran are great,..”, ”Great progress in negotiations,…”, ”Deal in sight,..” etc whenever the Brent M1 contract trades above $110/b. An effort to cool the market. These hot air verbal interventions from Trump used to have a heavy bearish impact on prices, but they now seems to have less and less effect unless they are backed by reality.
As far as we can see there has been no real progress in the negotiations between the US and Iran with both sides still standing by their previous demands.
Iran is getting stronger while the cease fire lasts making a return to war for Trump yet harder. Iran is naturally in constant preparation for a return to war given Trump’s steady threats of bombing Iran again. Iran is naturally doing what ever is possible to prepare for a return to war. And every day the cease fire lasts it is better prepared. This naturally makes it more and more difficult and dangerous for the US to return to warring activity versus Iran as the consequences for energy infrastructure in the Persian Gulf will be more and more severe the longer the cease fire lasts. Israel seems to see it this way as well. That the war is not won and that current frozen state of a cease fire gives Iran opportunity to rebuild military and politically.
Global inventories are drawing down day by day. How much? In the meantime the Strait of Hormuz stays closed. There is varying measures and estimates of how much global inventories are drawing down. Our rough estimate, back of the envelope, is that global inventories are drawing down by at least some 10 mb/d or about 300 mb/d in a balance between loss of supply versus demand destruction. Other estimates we see are a monthly draw of 250-270 mb/d. The IEA only ’measured’ a draw in global observable stocks of 117 mb in April with oil on water rising 53 mb while on shore stocks fell 170 mb. But global stocks are hard to measure with large invisible, unmeasured stocks. As such a back of the envelope approach may be better.
Oil products is what the world is consuming. Oil product prices likely to rise while product stocks fall. Strategic Petroleum Reserves (SPR) are predominantly crude oil. Discharging oil from OECD SPR stocks, a sharp reduction in Chinese crude imports and a reduction in global refinery throughput of 6-7 mb/d has helped to keep crude oil markets satisfactorily supplied. But global inventories are drawing down none the less. And oil products is really what the world is consuming. So if global refinery throughput stays subdued, then demand will eventually have to match the supply of oil products. The likely path forward this summer is a steady draw down in jet fuel, diesel and gasoline. Higher prices for these. Then, if possible, higher refinery throughput and higher usage of crude in response to very profitable refinery margins. And lastly sharper draw in crude stocks and higher prices for these. But some 6 mb/d of oil products used to be exported through the Strait of Hormuz. And it may not be so easy to ramp up refinery activity across the world to compensate. Especially as Ukraine continues to damage Russian refineries as well as Russian crude production and export facilities.
Watch oil product stocks and prices as well as Brent calendar 2027. What to watch for this summer is thus oil product inventories falling and oil product premiums to crude rising. Another measure to watch is the Brent crude 2027 contract as it rises steadily day by day as the Strait of Hormuz stays closed and global oil inventories decline. The latter is close to the highest level since the start of the war and keeps rising.
The Brent M1 contract and the Brent 2027 prices and current price of jet fuel in Europe (ARA). All in USD/b

Our back of the envelope calculation of the global shortage created by the closure of the Strait of Hormuz. Note that 3.5 mb/d of discharge from SPR is also a draw. Note also that ’Forced demand loss’ of 2.5 mb/d is probably temporary and will fall back towards zero as logistics are sorted out leaving ’Price demand loss’ to do the job of balancing the market. Thus a shortfall of at least 9 mb/d created by the closure. More if SPR discharge is included and more if Forced demand loss recedes.

Brent is climbing higher. Front-month is at USD 106.3/bl this morning, close to a weekly high and a USD 9/bl jump from Mondays open. This is the move we flagged as a risk earlier in the week: the market shifting from ”a deal is around the corner” to ”this is going to take longer than we thought”.

Analyst Commodities, SEB
During April, rest-of-year Brent remained remarkably stable around USD 90/bl. A stability which rested on one single assumption: the SoH reopens around 1 May. That assumption is now slowly falling apart.
As we highlighted yesterday: every week of delay beyond 1 May adds (theoretically) ish USD 5/bl to the rest-of-year average, as global inventories draw 100 million barrels per week. i.e., a mid-May reopening implies rest-of-year Brent closer to USD 100/bl, and anything pushing into June or July takes us meaningfully higher.
What’s changed in the last 48 hours:
#1: The US military has formally warned that clearing suspected sea mines from SoH could take up to six months. That is a completely different timescale from what the financial market is pricing. Even a political deal tomorrow does not immediately reopen the strait.
#2: Trump has shifted his tone from urgency to ”strategic patience”. In yesterday’s press conference: ”Don’t rush me… I want a great deal.” The market is reading this as a president no longer feeling pressured by timelines, with the naval blockade running in the background.
#3: So far, the military activity is escalating, not de-escalating. Axios reports Iran is laying more mines in SoH. The US 3rd carrier strike group (USS George H.W. Bush) is arriving with two countermine vessels. Trump yesterday ordered the US Navy to destroy any Iranian boats caught laying mines. While CNN reports that the Pentagon is actively drawing up plans to strike Iranian SoH capabilities and individual Iranian military leaders if the ceasefire collapses. i.e., NOT a attitude consistent with an imminent deal!
Spot crude and product prices eased off the early-April highs on a combination of system rerouting and deal optimism. Both now weakening. Goldman estimates April Gulf output is reduced by 14.5 mbl/d, or 57% of pre-war supply, a number that keeps getting worse the longer this drags on.
Demand-side adaptation is ongoing: S. Korea has cut its Middle East crude dependence from 69% to 56% by pulling more from the Americas and Africa, and Japan is kicking off a second round of SPR releases from 1 May. But SPRs are finite.
Ref. to the negotiations, we should not bet on speed. The current Iranian leadership is dominated by genuine hardliners willing to absorb economic pain and run the clock to extract concessions. That is not a setup for a rapid resolution. US/Israeli media briefings keep framing the delay as ”internal Iranian divisions”, the reality is more complicated and points toward weeks and months, not days.
Our point is that the complexity is large, and higher prices have only just started (given a scenario where the negotiations drag out in time). The market spent April leaning on the USD 90/bl rest-of-year assumption; that case is diminishing by the hour. If ”early May reopening” is replaced by ”June, July or later” over the next week or two, both crude and products have meaningful room to reprice higher from here. There is a high risk being short energy and betting on any immediate political resolution(!).
Down on Friday. Up on Monday. The Brent June crude oil contract traded down 5.1% last week to a close of $90.38/b. It reached a high of $103.87/b last Monday and a low of $86.09/b on Friday as Iran announced that the Strait of Hormuz was fully open for transit. That quickly changed over the weekend as the US upheld its blockade of Iranian oil exports while Iran naturally responded by closing the SoH again. The US blew a hole in the engine room of the Iranian ship TOUSKA and took custody of the ship on Sunday. Brent crude is up 5.6% this morning to $95.4/b.
The cease-fire is expiring tomorrow. The US has said it will send a delegation for a second round of negotiations in Islamabad in Pakistan. But Iran has for now rejected a second round of talks as it views US demands as unrealistic and excessive while the US is also blocking the Strait of Hormuz.
While Brent is up 5% this morning, the financial market is still very optimistic that progress will be made. That talks will continue and that the SoH will fully open by the start of May which is consistent with a rest-of-year average Brent crude oil price of around $90/b with the market now trading that balance at around $88/b.
Financial optimism vs. physical deterioration. We have a divergence where the financial market is trading negotiations, improvements and resolution while at the same time the physical market is deteriorating day by day. Physical oil flows remain constrained by disrupted flows, longer voyage times and elevated freight and insurance costs.
Financial markets are betting that a US/Iranian resolution will save us in time from violent shortages down the road. But every day that the SoH remains closed is bringing us closer to a potentially very painful point of shortages and much higher prices.
The US blockade is also a weapon of leverage against its European and Asian allies. When Iran closed the SoH it held the world economy as a hostage against the US. The US blockade of the SoH is of course blocking Iranian oil exports. But it is also an action of disruption directed towards Europe and Asia. The US has called for the rest of the world to engaged in the war with Iran: ”If you want oil from the Persian Gulf, then go and get it”. A risk is that the US plays brinkmanship with the global oil market directed towards its European and Asian allies and maybe even towards China to force them to engage and take part. Maybe unthinkable. But unthinkable has become the norm with Trump in the White House.


Sommarväder skapar prisrally på elbörsen
Oil product price pain is set to rise as the Strait of Hormuz stays closed into summer

Solkraften pressar elpriserna dagtid

Michel Gubel ger sin syn på oljemarknaden