

Analys
SEB Jordbruksprodukter, 18 november 2013


 Det hände ganska lite på marknaden i veckan som gick med endast mindre prisrörelser. Informa, Strategie Grains, NOPA och France AgriMer med flera, publicerade rapporter, som marknaden mer eller mindre ignorerade.
Tendensen på marknaden var generellt sett negativ, med prisfall på det mesta – utom Mjölk. I svenska kronor steg priset basis Eurex terminer på såväl smör som skummjölkspulver på ett sätt som motsvarar +20 öre per kilo mjölkråvara i Sverige. Den svaga kronan / starka euron bidrog även till att förstärka den allmänna prisuppgången på Eurex.
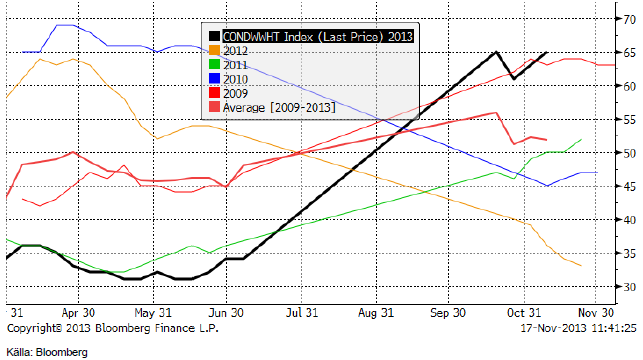
Vete
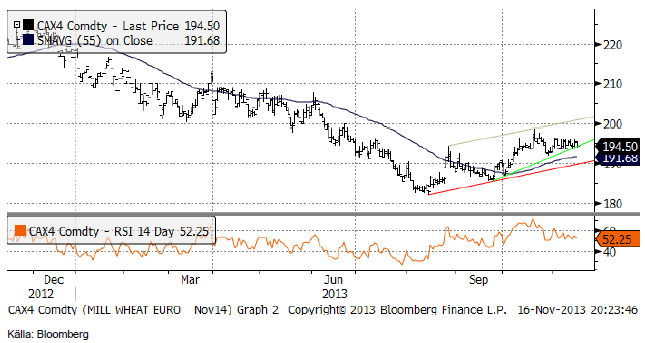
November 2014 – kontraktet på Matif har inte lyckats ta sig över 195 euro. Det ser ut som om det finns en ansamling av säljordrar på den nivån. Marknaden stängde på 194.50 euro per ton i fredags, vilket nu är precis på ett tekniskt stöd. Skulle nivån brytas, vilket sker på måndag om marknaden inte stiger, blir det ”fritt” ner till 190 euro per ton. Vi tror att det fallet kommer.
Decemberkontraktet 2014 på CBOT fortsatte falla i pris i veckan som gick, vilket får skillnaden mellan Matif och Chicago att som ett gummiband dras ut ännu mer.
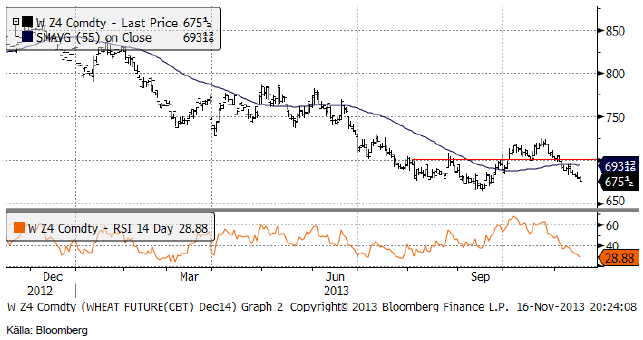
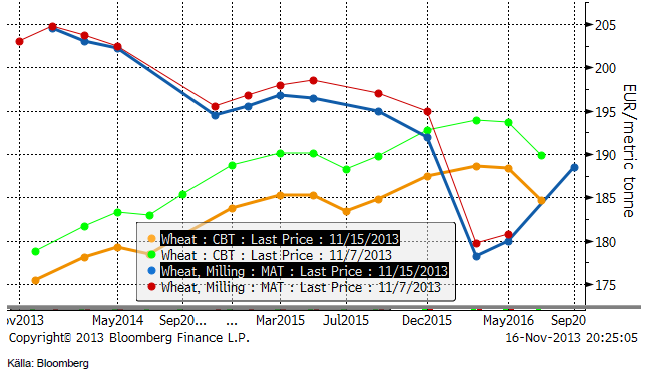
Nedan ser vi terminskurvorna för Chicagovete och Matif. Förändringarna i terminskurvan för Matifvete utgörs av oförändrat pris för de kortare kontrakten, men ett par euro lägre pris för skörd 2014. Terminskurvan i Chicago flyttades i veckan ner med motsvarande 5 euro per ton oavsett löptid; lika mycket för december 2013 som för Juli 2016. Till viss del beror detta på att euron steg med 1% mot dollarn.
Måndagens Crop Progress från visar att sådden av amerikanskt höstvete nu börjar närma sig sitt slut då 95% var avklarad per den 10 november, vilket är strax över förra årets 94% och även högre än det femåriga genomsnittet på 93%.
Uppkomsten av höstvete ligger nu på 84% – vilket är högre än förra årets 78% och det femåriga genomsnittet på 80%.
Andelen grödor klassade som ”good/excellent” fortsätter också att öka och justeras upp från 63% till 65%, vilket är betydligt högre än förra årets 36% vid den här tiden.
Sådden av höstvete i Frankrike är nu avklarad till 85& (per den 11 november), upp från 81% veckan innan. Andelen grödor klassade som ”good/excellent” uppgår till 87%, en nedjustering med 2%.
Egypten har återigen varit i marknaden för köp av vete med leverans i början av december. GASC köpte 180 000 ton franskt vete och 60 000 ton rumänskt vete. Frågan är hur mycket mer vete Rumänien kan exportera med tanke på att de också sålde 20 000 ton till Libanon. Det amerikanska vete som offererades var 10 usd / ton billigare (FOB) än det franska vetet men har ändå svårt att mäta sig pga högre transportkostnaderna över Atlanten.
Kinesiska CNGOIC justerar upp sin prognos för landets import av vete med 500 000 ton till 8 mt, vilket dock är lägre än USDA:s estimat på 8.5 mt. Importen från USA förväntas uppgå till 4.3 mt.
Ryssland håller fast vid sin prognos med en veteproduktion på 50 mt 2014/15, trots lägre sådd areal, då lantbrukare i landet förväntas fortsätta sådden av höstgrödor under november månad till följd av högre temperaturer än normalt. Så här långt uppgår sådd areal till ca 14.4 miljoner hektar (ungefär 88% av den förväntade arealen men fortfarande 8% lägre än förra året). Det varma vädret förväntas fortsätta framöver och i bl.a Moskva uppmättes den varmaste november-temperaturen på 130 år.
Enligt BAGE är nu veteskörden i Argentina påbörjad och avklarad till 6.9%, upp från 3.6% veckan innan och att jämföra med 14.5% vid samma tid förra året. Produktionen beräknas uppgå till 10.25 mt vilket är oförändrat från tidigare estimat.
Basis Matifs behåller vi vår säljrekommendation.
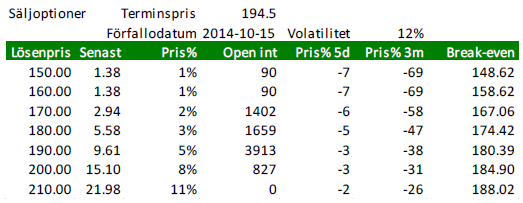
Optioner på vete
Nedan ser vi priserna på köpoptioner på Matif på November-2014 (Matif vete). Notera att volatiliteten har sjunkit ytterligare från 13 till 12% på årsbasis. Det är innebär att optioner på vete är billigare än på länge.
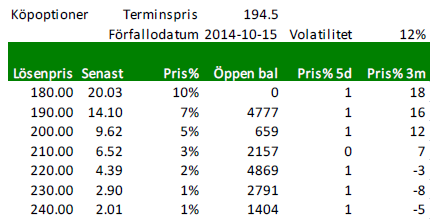
Nedanstående är priser på säljoptioner.
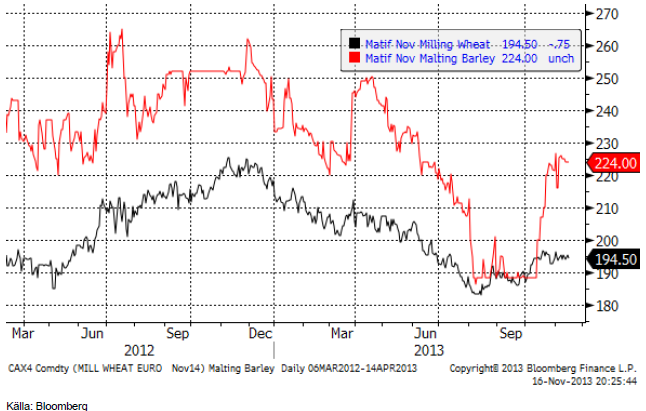
Maltkorn
November 2014 – kontraktet på Matif behöll sin återvunna premie på 30 euro per ton till Matifvetet i veckan som gick.
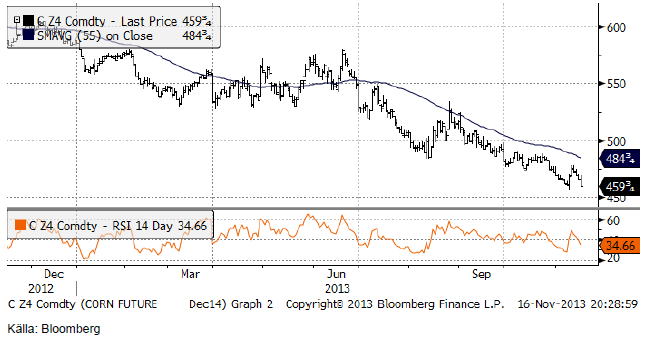
Majs
Majspriset föll tillbaka i veckan efter den omedelbara uppgången direkt efter WASDE-rapporten, helt i linje med vad jag skrev förra veckan.
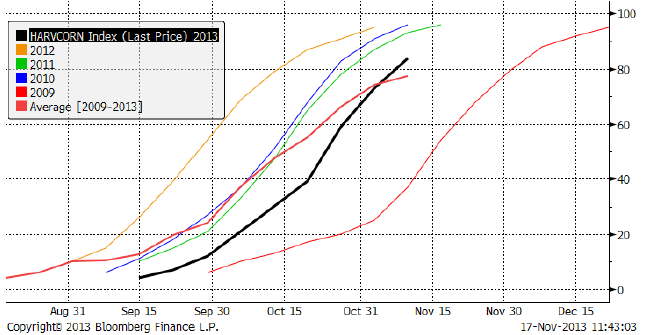
Crop Progress rapporten från USDA fortsätter att visa på en snabb framfart för skörden av majs i USA, med en ökning från 73% per den 3 november till 84% en vecka senare, vilket gör att skördetakten ligger strax över det femåriga genomsnittet på 79%. Tar man en närmare titt på ”I-staterna” så är skörden avklarad till 93% respektive 85% i Illinois och Indiana. Ytterligare en aktiv vecka för lantbrukare i Iowa som nu har skördat 88%, en siffra som nu ligger över genomsnittet på 80%.
Amerikanska EPA bekräftade att man kommer att sänka inblandningskravet avseende biobränslen. Däremot låg den aktuella produktionen av etanol på den högsta nivån sedan 17 månader.
Marknaden valde att strunta i att Informa sänkte estimat för majsarealen 2014 till 91.5 mA från det tidigare estimatet 91.7 mA. Enligt USDA var majsarealen i USA 95.3 mA.
Sådden i Argentina var till 42% klar och ligger därmed efter den normala takten. Vi har tidigare haft köprekommendation och går över till neutral.
Sojabönor
Terminskontrakten på sojabönor föll med ett par procent i veckan. Det var framförallt årets vinnare i sojasegmentet, sojamjölet, som föll i pris. Sojaoljan, som pressats hårt (ursäkta ordvitsen) lyckades hålla sig på oförändrad nivå genom veckan. Nedan ser vi mars-kontraktet, som föll kraftigt i fredags, efter att inte ha orkat igenom motståndsnivån 1300 cent, där det antagligen ansamlats mycket säljordrar från lantbrukare.
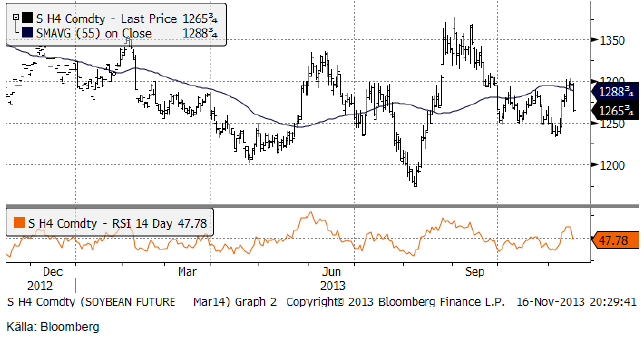
November 2014 höll sig i positivt territorium större delen av veckan, men fick lämna tillbaka allt på fredagen. Veckan slutade med en nedgång på ett par procent.
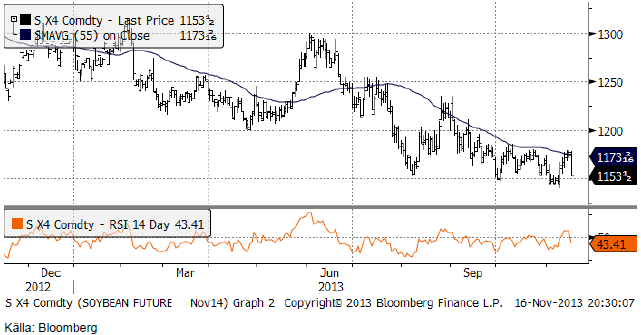
Måndagens Crop Progress från USDA visar att skörden av sojabönor i USA går framåt och nu ligger på 91%, vilket är marginellt lägre än det femåriga genomsnittet på 92%, men en ökning från 86% veckan innan. I Iowa och Illinois är skörden nu i stort sett klar med 98% respektive 97% och i flera stater är nu över 90% av skörden avklarad. Efter den här helgen borde det vara i stort sett över.
Exporten av sojabönor från USA ligger på rekordnivå. 79.7 miljoner bushels är den fjärde högsta nivån de senaste fem åren och långt över genomsnittet.
I fredags publicerades NOPA:s ”crush” siffror för oktober och på 157 Mbu ar de högre än väntat. Dessutom, som nämnt ovan, bekräftade EPA ett lägre inblandningskrav av biobränslen i drivmedel i USA.
Informa behöll 2014 års arealestimat oförändrat på 83.8 mA från förra månaden. Det är i och för sig väsentligt högre än årets 76.5 mA, men den ökade skillnaden mellan majs och soja borde ha lett till en höjning av arealen.
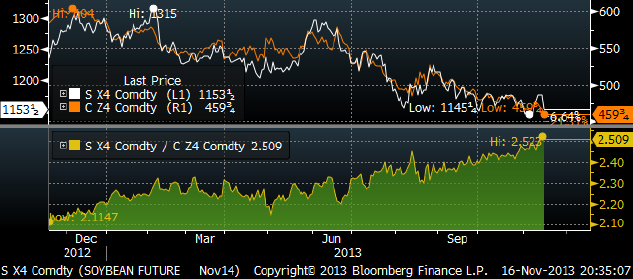
Nedan ser vi relationen mellan priset på Nov 2014 sojabönor och Dec 2014 majs, alltså priset på SX4 dividerat med priset på CZ4. Kvoten klättrade sedan förra veckan från 2.49 till 2.52.
Trots en rad nyheter, som borde ha varit positiva för sojabönorna, slutade veckans handel med ett lägre pris. Sojabönor är helt enkelt väldigt mycket för dyra i förhållande till andra jordbruksprodukter. Så länge vädret fortsätter att vara ”OK” i Sydamerika, kommer priset på sojabönor successivt att falla.
Vi behåller säljrekommendation.
Raps
November 2014-kontraktet har gått till slutet av den triangelformation vi skrev om och brutit ur triangeln på det sättet. Enligt handboken i teknisk analys, innebär detta inte den ”köpsignal” det skulle ha gjort om köparna tagit kommandot tidigare. Nu betyder det ingenting. Vi fortsätter därför med neutral rekommendation.
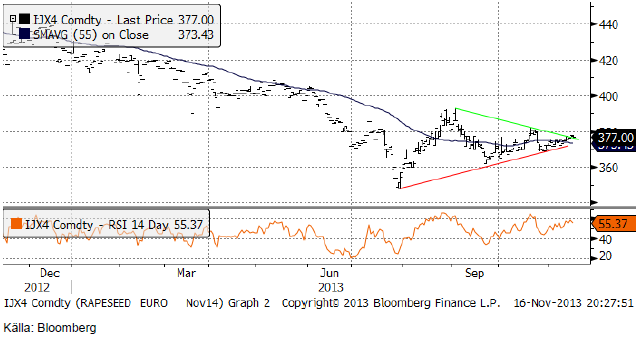
EU-28:s totala areal för oljeväxter förväntas falla med 2% till 11.9 miljoner hektar, där rapsarealen för skörd 2014 förväntas minska med 1% till 6.6 miljoner hektar enligt Strategie Grains rapport i veckan.
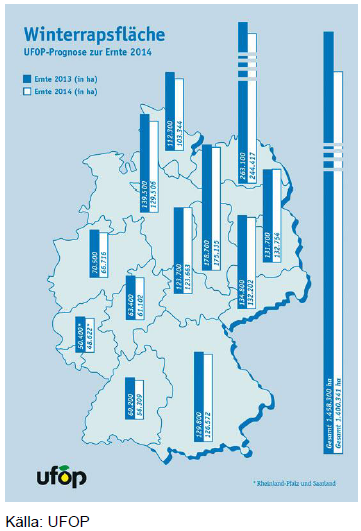
Efter den snabba expansionen under det senaste året förväntas en minskning av areal för raps i Tyskland – framförallt i de norra delarna – vilket framförallt återspeglar växtföljd samt ett mindre skifte till andra grödor till följd av högre priser. Baserat på en nyligen genomförd undersökning hos ca 5000 lantbrukare under september/oktober uppskattar UFOP arealen för höstraps skörd 2014 till 1.4 miljoner hektar. Jämfört med den skördade arealen 2013 representerar detta en liten minskning med 4% eller 57 959 hektar.
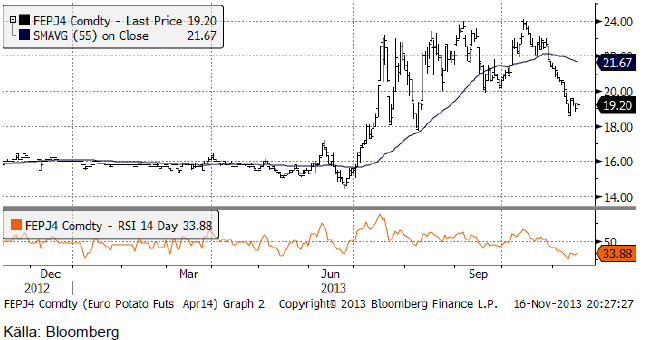
Potatis
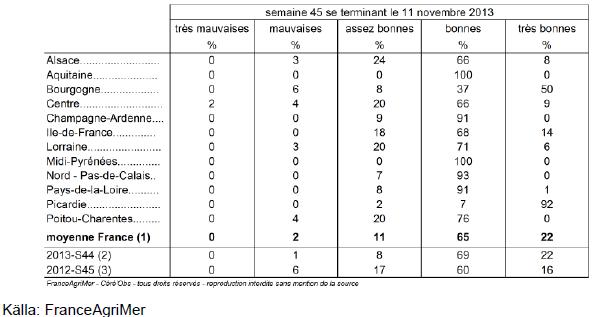
Potatispriset av årets skörd, fortsatte den senaste tidens prisfall, men fanns stöd vid 19 euro per deciton. Marknaden är kraftigt översåld och det bör kunna finna stöd vi de här nivåerna.
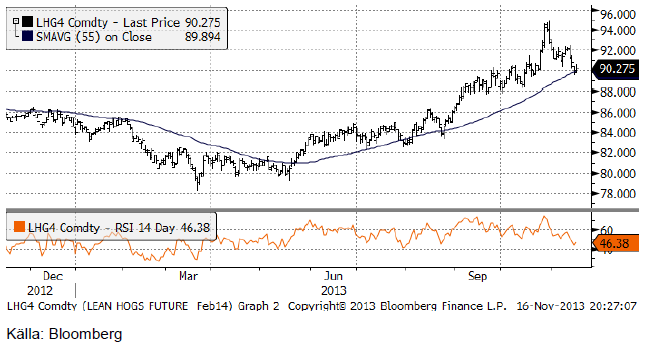
Gris
Lean hogs mars-kontrakt har rekylerat ner till 55-dagars glidande medelvärde. Ur teknisk synvinkel kan detta innebära stöd för priset och en möjlighet till en återgång till den stigande pristrenden.
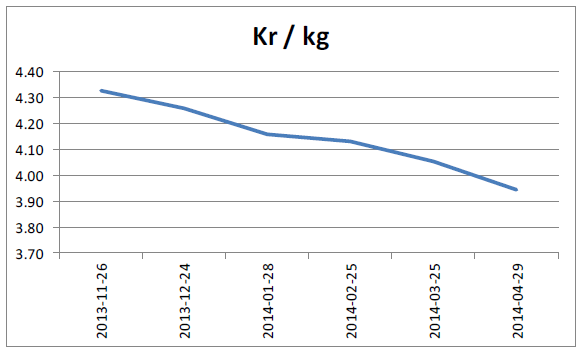
Mjölk
Terminerna på smör och skummjölkspulver vid Eurex-börsen steg båda i veckan. Det gjorde även USDA:s notering på SMB FOB NWE och Fonterras SMP-pris. Eftersom även euron steg med 2% mot den svenska kronan, innebar detta en betydande prisuppgång i kronor per kilo.
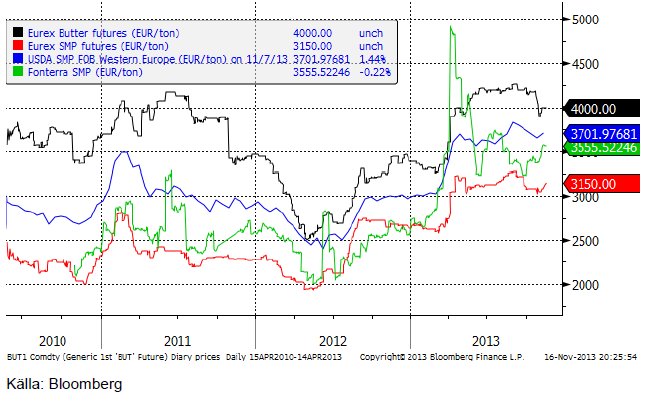
Om vi utgår från terminspriserna på smör och SMP och aktuell växelkurs EURSEK, får vi följande terminskurva i kronor per kilo svensk mjölklråvara. Notera dock att dessa priser alltid bör ligga över ett pris för råvaran i Sverige (och på andra ställen också) eftersom SMP och smör är produkter och inte råvaror.
Hela kurvan ligger ca 12 -20 öre / Kg högre än förra veckan. Höjningen är störst för februari 2014 (+20 öre) och lägst för november och december 2013 (+12 öre). För de lite längre kontrakten, från juli och framåt, där det inte finns någon handel och priserna är något mer osäkra stannade veckans prisuppgång på +8 öre, men dessa är som sagt inte handlade priser.
Socker
Marskontraktet på råsocker föll ner till 17.55 cent i fredags. Det är den lägsta prisnivån sedan i september. RSI-index på 28.79 (<30) indikerar en översåld marknad och man kan vänta sig ett slut på prisfallet, följt av en rekyl uppåt. Priset är vid nivåer där det funnits tekniskt stöd / motstånd tidigare, under augusti och september. Dessa två tekniska faktorer: RSI och gamla stödnivåer, talar för en vändning uppåt i veckan som kommer.
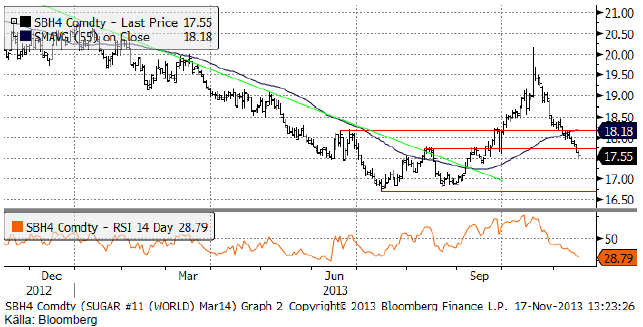
International Sugar Organization i London publicerade en ny rapport och uppdaterade prognoser i torsdags. De höjde prognosen på det globala produktionsöverskottet 2013/14 till 4.73 mt från 4.5 mt i prognosen från augusti. ISO höjde produktionen i Indien med 1.5 mt till 26.5 mt pga den goda monsunen, men sänkte produktionen i Braslien och i EU-28. Global produktion väntas bli 181.5 mt, som är 1.2% lägre än för ett år sedan och den första minskningen på fem år. ISO förväntar sig att global produktion fortsätter att sjunka och att produktionsöverskottet vänds i ett underskott.
Den som tycker om att köpa på rekyler, kan passa på nu. Vi rekommenderar köp.
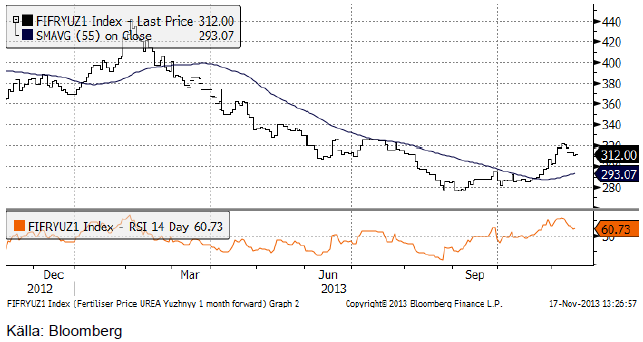
Gödsel
Priset på kväve / urea som förra veckan stängde på 303 dollar per ton, inledde veckan med att stiga till över 320 dollar, innan priset rekylerade ner och stängde veckan på 312, en uppgång med 9 dollar per ton.
[box]SEB Veckobrev Jordbruksprodukter är producerat av SEB Commodities Sales desk och publiceras i samarbete och med tillstånd på Råvarumarknaden.se[/box]
Detta marknadsföringsmaterial, framtaget av SEB’s Commodities Sales desk, har upprättats enbart i informationssyfte.
Även om innehållet är baserat på källor som SEB bedömt som tillförlitliga ansvarar SEB inte för fel eller brister i informationen. Den utgör inte oberoende, objektiv investeringsanalys och skyddas därför inte av de bestämmelser som SEB har infört för att förebygga potentiella intressekonflikter. Yttranden från SEB’s Commodities Sales desk kan vara oförenliga med tidigare publicerat material från SEB, då den senare hänvisas uppmanas du att läsa den fullständiga rapporten innan någon åtgärd vidtas.
Dokumentationen utgör inte någon investeringsrådgivning och tillhandahålls till dig utan hänsyn till dina investeringsmål. Du uppmanas att självständigt bedöma och komplettera uppgifterna i denna dokumentation och att basera dina investeringsbeslut på material som bedöms erforderligt. Alla framåtblickande uttalanden, åsikter och förväntningar är föremål för risker, osäkerheter och andra faktorer och kan orsaka att det faktiska resultatet avviker väsentligt från det förväntade. Historisk avkastning är ingen garanti för framtida resultat. Detta dokument utgör inte ett erbjudande att teckna några värdepapper eller andra finansiella instrument. SEB svarar inte för förlust eller skada – direkt eller indirekt, eller av vad slag det vara må – som kan uppkomma till följd av användandet av detta material eller dess innehåll.
Observera att det kan förekomma att SEB, dess ledamöter, dess anställda eller dess moder- och/eller dotterbolag vid olika tillfällen innehar, har innehaft eller kommer att inneha aktier, positioner, rådgivningsuppdrag i samband med corporate finance-transaktioner, investment- eller merchantbankinguppdrag och/eller lån i de bolag/finansiella instrument som nämns i materialet.
Materialet är avsett för mottagaren, all spridning, distribuering mångfaldigande eller annan användning av detta meddelande får inte ske utan SEB:s medgivande. Oaktat detta får SEB tillåta omfördelning av materialet till utvald tredje part i enlighet med gällande avtal. Materialet får inte spridas till fysiska eller juridiska personer som är medborgare eller har hemvist i ett land där sådan spridning är otillåten enligt tillämplig lag eller annan bestämmelse.
Skandinaviska Enskilda Banken AB (publ) är ett [publikt] aktiebolag och står under tillsyn av Finansinspektionen samt de lokala finansiella tillsynsmyndigheter i varje jurisdiktionen där SEB har filial eller dotterbolag.

Market is starting to take US/Iran headlines with a pinch of salt. Brent crude rose $2.8/b yesterday to an official close of $112.1/b. But after that it traded as low as $108.05/b before ending late night at around $109.7/b. Through the day it traded in a range of $106.87 – 112.72/b amid a flurry of news or rumors from Iran and the US. ”US temporary sanctions during negotiations” (falls alarm). ”We will bomb Iran” (not anyhow),… etc. While the market is still fluctuating to this kind of news flow, it is starting to take such headlines with a pinch of salt.

We’ll see. Maybe, maybe not. The Brent M1 contract is trading at $110.2/b this morning which very close to the average ticks through yesterday of $110.4/b.
Trump with bearish, verbal intervention whenever Brent trades above $110/b it seems. What seems to be a pattern is that Trump states something like ”very good negotiations going on with Iran”, ”New leaders in Iran are great,..”, ”Great progress in negotiations,…”, ”Deal in sight,..” etc whenever the Brent M1 contract trades above $110/b. An effort to cool the market. These hot air verbal interventions from Trump used to have a heavy bearish impact on prices, but they now seems to have less and less effect unless they are backed by reality.
As far as we can see there has been no real progress in the negotiations between the US and Iran with both sides still standing by their previous demands.
Iran is getting stronger while the cease fire lasts making a return to war for Trump yet harder. Iran is naturally in constant preparation for a return to war given Trump’s steady threats of bombing Iran again. Iran is naturally doing what ever is possible to prepare for a return to war. And every day the cease fire lasts it is better prepared. This naturally makes it more and more difficult and dangerous for the US to return to warring activity versus Iran as the consequences for energy infrastructure in the Persian Gulf will be more and more severe the longer the cease fire lasts. Israel seems to see it this way as well. That the war is not won and that current frozen state of a cease fire gives Iran opportunity to rebuild military and politically.
Global inventories are drawing down day by day. How much? In the meantime the Strait of Hormuz stays closed. There is varying measures and estimates of how much global inventories are drawing down. Our rough estimate, back of the envelope, is that global inventories are drawing down by at least some 10 mb/d or about 300 mb/d in a balance between loss of supply versus demand destruction. Other estimates we see are a monthly draw of 250-270 mb/d. The IEA only ’measured’ a draw in global observable stocks of 117 mb in April with oil on water rising 53 mb while on shore stocks fell 170 mb. But global stocks are hard to measure with large invisible, unmeasured stocks. As such a back of the envelope approach may be better.
Oil products is what the world is consuming. Oil product prices likely to rise while product stocks fall. Strategic Petroleum Reserves (SPR) are predominantly crude oil. Discharging oil from OECD SPR stocks, a sharp reduction in Chinese crude imports and a reduction in global refinery throughput of 6-7 mb/d has helped to keep crude oil markets satisfactorily supplied. But global inventories are drawing down none the less. And oil products is really what the world is consuming. So if global refinery throughput stays subdued, then demand will eventually have to match the supply of oil products. The likely path forward this summer is a steady draw down in jet fuel, diesel and gasoline. Higher prices for these. Then, if possible, higher refinery throughput and higher usage of crude in response to very profitable refinery margins. And lastly sharper draw in crude stocks and higher prices for these. But some 6 mb/d of oil products used to be exported through the Strait of Hormuz. And it may not be so easy to ramp up refinery activity across the world to compensate. Especially as Ukraine continues to damage Russian refineries as well as Russian crude production and export facilities.
Watch oil product stocks and prices as well as Brent calendar 2027. What to watch for this summer is thus oil product inventories falling and oil product premiums to crude rising. Another measure to watch is the Brent crude 2027 contract as it rises steadily day by day as the Strait of Hormuz stays closed and global oil inventories decline. The latter is close to the highest level since the start of the war and keeps rising.
The Brent M1 contract and the Brent 2027 prices and current price of jet fuel in Europe (ARA). All in USD/b

Our back of the envelope calculation of the global shortage created by the closure of the Strait of Hormuz. Note that 3.5 mb/d of discharge from SPR is also a draw. Note also that ’Forced demand loss’ of 2.5 mb/d is probably temporary and will fall back towards zero as logistics are sorted out leaving ’Price demand loss’ to do the job of balancing the market. Thus a shortfall of at least 9 mb/d created by the closure. More if SPR discharge is included and more if Forced demand loss recedes.

Brent is climbing higher. Front-month is at USD 106.3/bl this morning, close to a weekly high and a USD 9/bl jump from Mondays open. This is the move we flagged as a risk earlier in the week: the market shifting from ”a deal is around the corner” to ”this is going to take longer than we thought”.

Analyst Commodities, SEB
During April, rest-of-year Brent remained remarkably stable around USD 90/bl. A stability which rested on one single assumption: the SoH reopens around 1 May. That assumption is now slowly falling apart.
As we highlighted yesterday: every week of delay beyond 1 May adds (theoretically) ish USD 5/bl to the rest-of-year average, as global inventories draw 100 million barrels per week. i.e., a mid-May reopening implies rest-of-year Brent closer to USD 100/bl, and anything pushing into June or July takes us meaningfully higher.
What’s changed in the last 48 hours:
#1: The US military has formally warned that clearing suspected sea mines from SoH could take up to six months. That is a completely different timescale from what the financial market is pricing. Even a political deal tomorrow does not immediately reopen the strait.
#2: Trump has shifted his tone from urgency to ”strategic patience”. In yesterday’s press conference: ”Don’t rush me… I want a great deal.” The market is reading this as a president no longer feeling pressured by timelines, with the naval blockade running in the background.
#3: So far, the military activity is escalating, not de-escalating. Axios reports Iran is laying more mines in SoH. The US 3rd carrier strike group (USS George H.W. Bush) is arriving with two countermine vessels. Trump yesterday ordered the US Navy to destroy any Iranian boats caught laying mines. While CNN reports that the Pentagon is actively drawing up plans to strike Iranian SoH capabilities and individual Iranian military leaders if the ceasefire collapses. i.e., NOT a attitude consistent with an imminent deal!
Spot crude and product prices eased off the early-April highs on a combination of system rerouting and deal optimism. Both now weakening. Goldman estimates April Gulf output is reduced by 14.5 mbl/d, or 57% of pre-war supply, a number that keeps getting worse the longer this drags on.
Demand-side adaptation is ongoing: S. Korea has cut its Middle East crude dependence from 69% to 56% by pulling more from the Americas and Africa, and Japan is kicking off a second round of SPR releases from 1 May. But SPRs are finite.
Ref. to the negotiations, we should not bet on speed. The current Iranian leadership is dominated by genuine hardliners willing to absorb economic pain and run the clock to extract concessions. That is not a setup for a rapid resolution. US/Israeli media briefings keep framing the delay as ”internal Iranian divisions”, the reality is more complicated and points toward weeks and months, not days.
Our point is that the complexity is large, and higher prices have only just started (given a scenario where the negotiations drag out in time). The market spent April leaning on the USD 90/bl rest-of-year assumption; that case is diminishing by the hour. If ”early May reopening” is replaced by ”June, July or later” over the next week or two, both crude and products have meaningful room to reprice higher from here. There is a high risk being short energy and betting on any immediate political resolution(!).
Down on Friday. Up on Monday. The Brent June crude oil contract traded down 5.1% last week to a close of $90.38/b. It reached a high of $103.87/b last Monday and a low of $86.09/b on Friday as Iran announced that the Strait of Hormuz was fully open for transit. That quickly changed over the weekend as the US upheld its blockade of Iranian oil exports while Iran naturally responded by closing the SoH again. The US blew a hole in the engine room of the Iranian ship TOUSKA and took custody of the ship on Sunday. Brent crude is up 5.6% this morning to $95.4/b.
The cease-fire is expiring tomorrow. The US has said it will send a delegation for a second round of negotiations in Islamabad in Pakistan. But Iran has for now rejected a second round of talks as it views US demands as unrealistic and excessive while the US is also blocking the Strait of Hormuz.
While Brent is up 5% this morning, the financial market is still very optimistic that progress will be made. That talks will continue and that the SoH will fully open by the start of May which is consistent with a rest-of-year average Brent crude oil price of around $90/b with the market now trading that balance at around $88/b.
Financial optimism vs. physical deterioration. We have a divergence where the financial market is trading negotiations, improvements and resolution while at the same time the physical market is deteriorating day by day. Physical oil flows remain constrained by disrupted flows, longer voyage times and elevated freight and insurance costs.
Financial markets are betting that a US/Iranian resolution will save us in time from violent shortages down the road. But every day that the SoH remains closed is bringing us closer to a potentially very painful point of shortages and much higher prices.
The US blockade is also a weapon of leverage against its European and Asian allies. When Iran closed the SoH it held the world economy as a hostage against the US. The US blockade of the SoH is of course blocking Iranian oil exports. But it is also an action of disruption directed towards Europe and Asia. The US has called for the rest of the world to engaged in the war with Iran: ”If you want oil from the Persian Gulf, then go and get it”. A risk is that the US plays brinkmanship with the global oil market directed towards its European and Asian allies and maybe even towards China to force them to engage and take part. Maybe unthinkable. But unthinkable has become the norm with Trump in the White House.


Sommarväder skapar prisrally på elbörsen
Oil product price pain is set to rise as the Strait of Hormuz stays closed into summer

Solkraften pressar elpriserna dagtid

Michel Gubel ger sin syn på oljemarknaden