

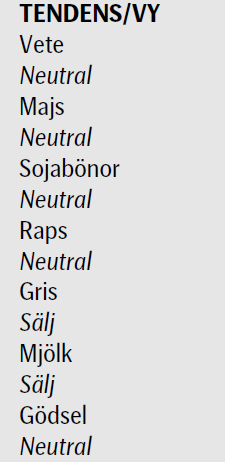
Analys
SEB Jordbruksprodukter, 18 mars 2013

 Prisfallet på spannmål har stannat av och såväl Chicago som Matif hade en av sina bättre veckor på länge. Sojabönorna med rapsfröet i släptåg gick åt motsatt håll, men båda håller sig ännu över sina respektive tekniska stödnivåer. Terminer på mjölkprodukterna smör och SMP steg på den tyska börsen Eurex. På tisdag får vi resultatet av Fonterras senaste auktion.
Den 28 mars är det dags för kvartalsstatistiken från det amerikanska jordbruksdepartementet. Klockan 17 den dagen presenteras uppdaterade siffror på ”prospective plantings” för vete och majs och lagerstatistiken per den första mars.
Odlingsväder
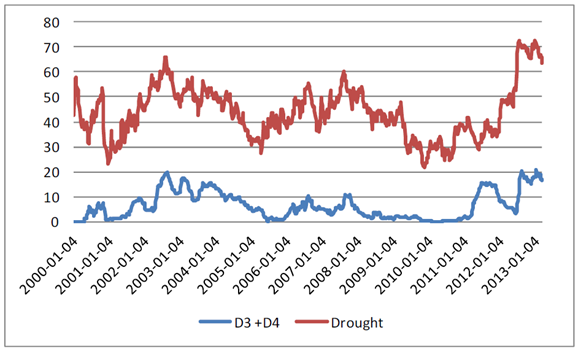
I veckan som gick regnade det i området kring Mississippi-floden, medan de västra delarna var fortsatt torra. Torkan släpper längs Mississippifloden och i östra USA och tränger ut torkan längre mot väster. Fortfarande är stora delar av USA torkdrabbat, men något mindre i veckans rapport. 63.6% av USA:s mark är torrare än normalt. I Juldagens rapport var det som värst med över 72% torrt. 16.5% av USA:s mark är fortfarande extremt eller exceptionellt torr. Även det är en minskning från maximum på över 19% som nåddes den sista januari.
Regn och kyla var på sina håll i USA så besvärande att sådden av majs hindrades. Europa fick nederbörd i veckan. Tidigare i år har Europa fått lite mindre nederbörd än normalt.
Vete
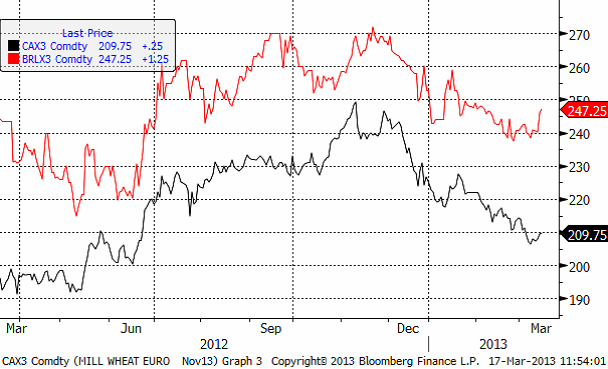
Priset på november (2013) steg upp mot 210-nivån i veckan. Det är ett avgörande läge, eftersom den här prisnivån just nu också är i den övre delen av den trendkanal nedåt som priset legat i sedan början av december när WASDE-rapporten fick marknaden på fall. När man är ute och talar med lantbrukare i Sverige får man höra följande: För det första är det ganska få som hann med att prissäkra på de höga prisnivåerna över 230 euro per ton som marknaden erbjöd mellan augusti och december. Den första stora prisuppgången 2007 var det nästan ingen som sålde eftersom man inte visste hur långt upp priset kunde gå. Vid nästa stora prisuppgång, 2010, prissäkrade man därför för tidigt, redan i september i många fall. Därför ångrade man sig när toppen noterades i februari 2011. Den här gången har man därför väntat – och missat toppen. Därför är det säkert många som kommer att passa på och sälja om priset rekylerar upp till – exempelvis – 220 euro per ton. Detta gör att uppgångar härifrån kan bli ganska begränsade, om inte utbudet i världen skadas allvarligt av försämrade odlingsförhållanden.
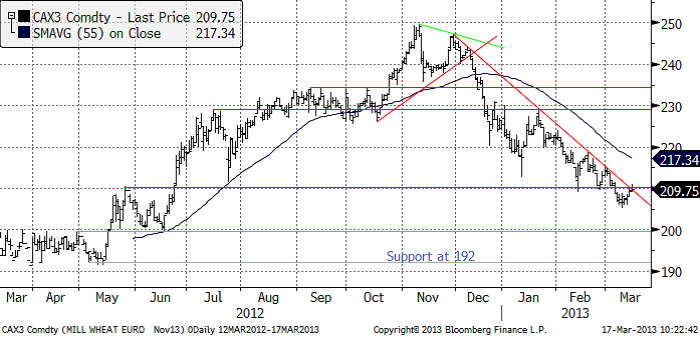
Jag tror att prisfallet de tre senaste månaderna är över och att vi får se lite ”sidledes” rörelse de närmaste veckorna. Intresse att prissäkra från lantbrukshåll finns om priserna är lite högre. Utvecklingen på vädret framöver blir viktigt.
Decemberkontraktet på CBOT hade en av sida bättre veckor, även den. Inte för att det är början på en prisuppgång, utan för att priset, som vi skrev förra veckan, kanske gått lite för långt ner lite för hastigt. Prisuppgången kommer alltså trots att det i veckan kom rapporter om ökande nederbörd och avtagande torka. Den enda tolkningen då är rimligen den, att priset gått ner lite för långt.
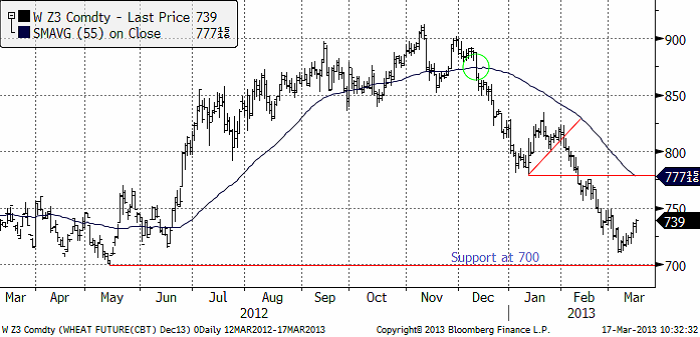
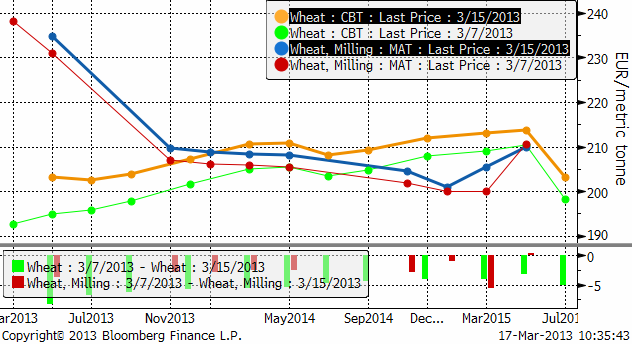
Terminskurvorna visar att alla terminer stigit. På Matif har alla löptider gått upp lika mycket. I USA har gammal skörd handlats upp mer än ny. Det är rimligt att detta sker, eftersom lagerkostnaderna minskar med minskande lager och att transporterna ut från USA kommer igång igen. Att vete blivit billigare än majs för gammal skörd bidrar också till att dra upp priset på vete.
Det har kommit en del statistik i veckan – som pekar åt olika håll. Franska Cocerals rapport indikerar högre priser. De tror att skörden i Frankrike blir bara något högre och 12 mt lägre i Storbritannien, där sådden var 25% mindre än normalt i höstas. Frankrike, som är EU:s största veteproducent beräknas bara öka skörden marginellt med 0.1 mt till 35.9 mt. Detta beror på att de största odlingsdistrikten Picardie och Centre fick mer än dubbelt så mycket nederbörd som normalt i december. FranceAgriMer estimerar att 66% av den franska veteskörden är i ”good” eller ”very good” condition per den 4 mars. Förra året samma tid var siffran 68%. Det är alltså nästan samma nivå.
 Coceral estimerade den tyska skörden till 23.6 mt, vilket är på samma nivå som DRV (Deutsche Raiffeisenverband) också publicerade i veckan som gick. DRV pekade på att det hittills inte förekommit några övervintringsskador på grund av frost.
Spanien, som förra året drabbades av torka, väntas i år producera normalt. Forna öststater väntas fortsätta öka produktionen. I förra veckans WASDE-rapport noterade vi också att den enda justering som USDA gjorde var att höja Litauens skörd med 500,000 ton. Det är en tydlig tendens.
”Soft Wheat” – skörden i EU tror Coceral blir 127.8 mt (+3.2 mt från förra året).
Strategie Grains som också rapporterade i veckan tror att samma skörd blir 131.6 mt. EU-kommissionen tror på ännu högre skörd, 132.1 mt.
Liksom förra veckan tror jag att de tre senaste månadernas prisfall på vete är över. Däremot tror jag inte på någon rask uppgång, utan mer på ”sidledes” rörelse medan marknaden tolkar de rapporter som kommer in – och lagerstatistiken som USDA publicerar den 28 mars. Ska man hålla koll på någonting särskilt är det om 210-nivån på Matif bryts på uppsidan. Det vore ett klart styrketecken om köparna lyckas ta hand om alla säljordrar som troligtvis anhopat sig där.
Maltkorn
Priset på maltkorn med leverans i november har visat mer styrka än kvarnvetet i veckan som gick. Priset steg från 240 till 247, medan kvarnvetet ”bara” steg några euro.
Majs
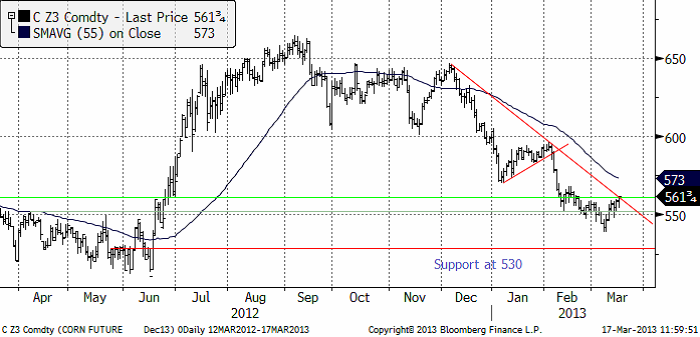
Majspriset (december 2013) fortsatte att stiga i veckan som gick. Priset gick upp till 561 cent – en nivå som dels ligger an mot den övre trendkanalen och dels är en nivå där uppgångar slutat tidigare. Marknaden står alltså nu under helgen och väger. Om priset håller sig på den här nivån får vi en någorlunda god bekräftelse på att prisfallet från december är över.
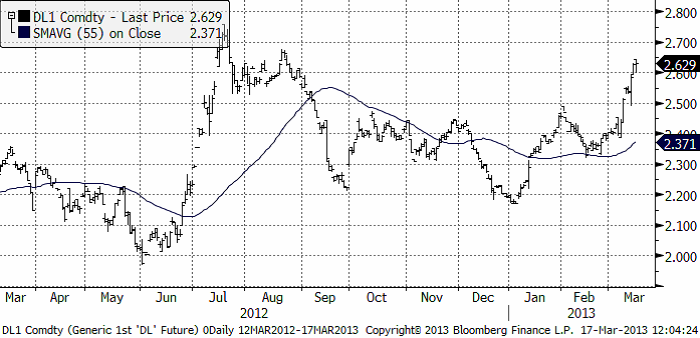
Veckovis etanolproduktion i minskade i veckan, men priset på etanol steg kraftigt. Vid årsskiftet handlades etanolen i 2.20 dollar per gallon och nu ligger den på 2.60. Detta sker samtidigt som oljepriset har fallit. Högre pris borde leda till högre produktion och högre efterfrågan på majs.
Vi har samma tolkning av marknaden som förra veckan. Prisfallet har troligtvis ebbat ut och priset bör röra sig ”sidledes”.
Sojabönor
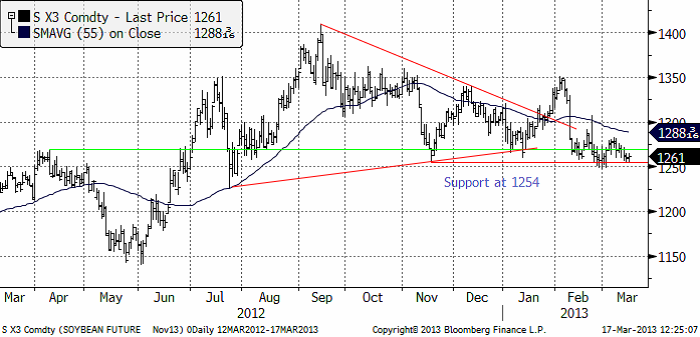
Sojabönorna (november 2013) har till skillnad från majs, vete och maltkorn, handlats ner i veckan som stödet som jag skrivit om tidigare, på 1254 cent, har hållit. Novemberterminen stängde i fredags på 1261.
Skörden i Brasilien har kommit halvvägs. Bönderna har sålt 60% av skörden. Som jag skrev förra veckan är priserna inåt landet pressade på grund av den långsamma exporten. I Paranagua är väntan 75 dagar enligtFryer reports. Argentinska bönder har bara sålt 10% av skörden vilket är mindre än förra året då 30% sålt så här års. Argentina förklarades nästan i konkurs i en domstol i London häromveckan. Det finns därför en anledning att behålla sparkapitalet i den reala och säkra form som sojabönorna utgör.
I fredags publicerade NOPA (National Oilseed Processors Organisation) sin månadsvisa crush report. Den visar att sojabönslagret i USA äts upp i ett rasande tempo, samtidigt som världen får lov att vänta för att kunna få tag på de sydamerikanska bönorna.
Marknadsläget är oförändrat från förra veckan: I veckan som kommer får man hålla koll på om priset håller sig över det tekniska stödet vid 1254 eller om det bryts. Om det bryts vill vi vara korta sojabönor.
Raps
Rapspriset (november 2013) föll i torsdags rakt ner till det tekniska stödet på 415 euro per ton, men vände i fredags upp därifrån till 420, men stängde veckan på exakt 415 euro. Det var stora prisfall även i Winnipeg. Detta ”borde” inte ske ur ett fundamentalt perspektiv eftersom lagren är så små men sojabönorna sjönk och då kan inte rapsen gå sin egen väg.
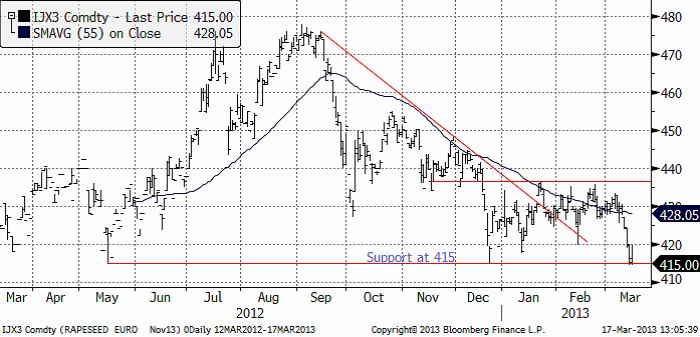
Olyckligtvis lämnade vi förra veckan en negativ vy på rapsen till nuvarande neutrala. Om marknaden handlar ner priset under 415 går vi omedelbart över till negativ vy igen, annars håller vi fast vid det neutrala. Jag tror inte man bör vara lång raps, så har man raps som inte är prissäkrat bör man överväga att göra det.
Gris
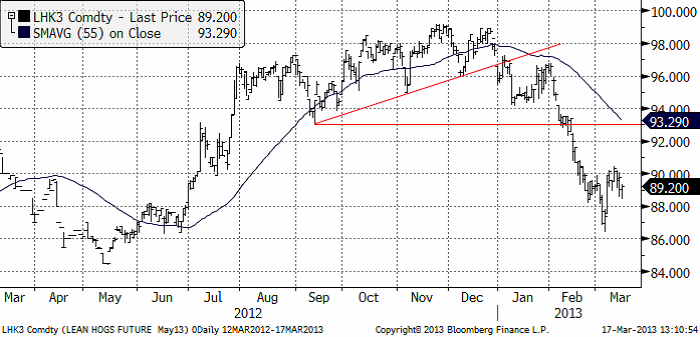
Grispriset (Maj 13) vände ner igen, precis som vi skrev förra veckan. Prisuppgången i början på mars får vi än så länge betrakta som en rekyl mot den i det större perspektivet fallande trenden.
Mjölk
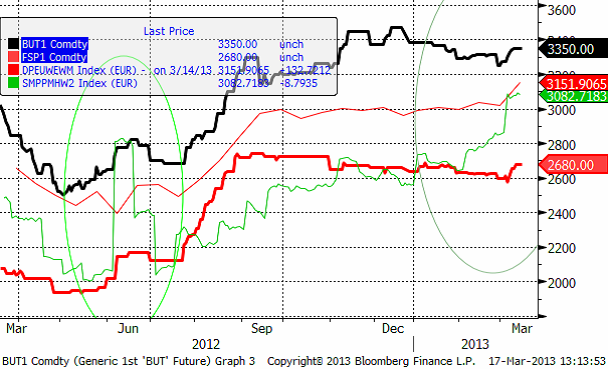
Resultatet för Fonterras auktion presenteras på tisdag. I februari började det priset stiga ordentligt, från 2600 euro per ton till 3082 euro per ton. Den senaste veckan har vi också sett att priserna på Eurex stigit något, men inte alls i samma utsträckning som Fonterra auktionens pris.
I kursdiagrammet nedan ser vi fyra kurvor, som förra veckan. Överst har vi smör i euro per ton, alla är i euro per ton. Den tunna röda linjen USDA:s notering för SMP i västra Europa. Den feta röda linjen är terminspriset på SMP på Eurex, som avser snittpriset på SMP i Tyskland, Holland och Frankrike. Den gröna linjen är Fonterras auktionspris på SMP.
SEB Commodities erbjuder ett litet ”prova-på” kontrakt som består av 0.5 ton Eurex-smör och 0.9 ton Eurex SMP. Ett paket som motsvarar 10 ton flytande mjölkråvara. Just nu är det underliggande värdet på ett sådant kontrakt drygt 33 000 kronor.
Den som vill följa priset på SMP på Eurex gör det via länken:
www.eurexchange.com/exchange-en/products/com/agr/14016/
Vi har säljrekommendation på mjölkterminer.
[box]SEB Veckobrev Jordbruksprodukter är producerat av SEB Merchant Banking och publiceras i samarbete och med tillstånd på Råvarumarknaden.se[/box]
Disclaimer
The information in this document has been compiled by SEB Merchant Banking, a division within Skandinaviska Enskilda Banken AB (publ) (“SEB”).
Opinions contained in this report represent the bank’s present opinion only and are subject to change without notice. All information contained in this report has been compiled in good faith from sources believed to be reliable. However, no representation or warranty, expressed or implied, is made with respect to the completeness or accuracy of its contents and the information is not to be relied upon as authoritative. Anyone considering taking actions based upon the content of this document is urged to base his or her investment decisions upon such investigations as he or she deems necessary. This document is being provided as information only, and no specific actions are being solicited as a result of it; to the extent permitted by law, no liability whatsoever is accepted for any direct or consequential loss arising from use of this document or its contents.
About SEB
SEB is a public company incorporated in Stockholm, Sweden, with limited liability. It is a participant at major Nordic and other European Regulated Markets and Multilateral Trading Facilities (as well as some non-European equivalent markets) for trading in financial instruments, such as markets operated by NASDAQ OMX, NYSE Euronext, London Stock Exchange, Deutsche Börse, Swiss Exchanges, Turquoise and Chi-X. SEB is authorized and regulated by Finansinspektionen in Sweden; it is authorized and subject to limited regulation by the Financial Services Authority for the conduct of designated investment business in the UK, and is subject to the provisions of relevant regulators in all other jurisdictions where SEB conducts operations. SEB Merchant Banking. All rights reserved.

Market is starting to take US/Iran headlines with a pinch of salt. Brent crude rose $2.8/b yesterday to an official close of $112.1/b. But after that it traded as low as $108.05/b before ending late night at around $109.7/b. Through the day it traded in a range of $106.87 – 112.72/b amid a flurry of news or rumors from Iran and the US. ”US temporary sanctions during negotiations” (falls alarm). ”We will bomb Iran” (not anyhow),… etc. While the market is still fluctuating to this kind of news flow, it is starting to take such headlines with a pinch of salt.

We’ll see. Maybe, maybe not. The Brent M1 contract is trading at $110.2/b this morning which very close to the average ticks through yesterday of $110.4/b.
Trump with bearish, verbal intervention whenever Brent trades above $110/b it seems. What seems to be a pattern is that Trump states something like ”very good negotiations going on with Iran”, ”New leaders in Iran are great,..”, ”Great progress in negotiations,…”, ”Deal in sight,..” etc whenever the Brent M1 contract trades above $110/b. An effort to cool the market. These hot air verbal interventions from Trump used to have a heavy bearish impact on prices, but they now seems to have less and less effect unless they are backed by reality.
As far as we can see there has been no real progress in the negotiations between the US and Iran with both sides still standing by their previous demands.
Iran is getting stronger while the cease fire lasts making a return to war for Trump yet harder. Iran is naturally in constant preparation for a return to war given Trump’s steady threats of bombing Iran again. Iran is naturally doing what ever is possible to prepare for a return to war. And every day the cease fire lasts it is better prepared. This naturally makes it more and more difficult and dangerous for the US to return to warring activity versus Iran as the consequences for energy infrastructure in the Persian Gulf will be more and more severe the longer the cease fire lasts. Israel seems to see it this way as well. That the war is not won and that current frozen state of a cease fire gives Iran opportunity to rebuild military and politically.
Global inventories are drawing down day by day. How much? In the meantime the Strait of Hormuz stays closed. There is varying measures and estimates of how much global inventories are drawing down. Our rough estimate, back of the envelope, is that global inventories are drawing down by at least some 10 mb/d or about 300 mb/d in a balance between loss of supply versus demand destruction. Other estimates we see are a monthly draw of 250-270 mb/d. The IEA only ’measured’ a draw in global observable stocks of 117 mb in April with oil on water rising 53 mb while on shore stocks fell 170 mb. But global stocks are hard to measure with large invisible, unmeasured stocks. As such a back of the envelope approach may be better.
Oil products is what the world is consuming. Oil product prices likely to rise while product stocks fall. Strategic Petroleum Reserves (SPR) are predominantly crude oil. Discharging oil from OECD SPR stocks, a sharp reduction in Chinese crude imports and a reduction in global refinery throughput of 6-7 mb/d has helped to keep crude oil markets satisfactorily supplied. But global inventories are drawing down none the less. And oil products is really what the world is consuming. So if global refinery throughput stays subdued, then demand will eventually have to match the supply of oil products. The likely path forward this summer is a steady draw down in jet fuel, diesel and gasoline. Higher prices for these. Then, if possible, higher refinery throughput and higher usage of crude in response to very profitable refinery margins. And lastly sharper draw in crude stocks and higher prices for these. But some 6 mb/d of oil products used to be exported through the Strait of Hormuz. And it may not be so easy to ramp up refinery activity across the world to compensate. Especially as Ukraine continues to damage Russian refineries as well as Russian crude production and export facilities.
Watch oil product stocks and prices as well as Brent calendar 2027. What to watch for this summer is thus oil product inventories falling and oil product premiums to crude rising. Another measure to watch is the Brent crude 2027 contract as it rises steadily day by day as the Strait of Hormuz stays closed and global oil inventories decline. The latter is close to the highest level since the start of the war and keeps rising.
The Brent M1 contract and the Brent 2027 prices and current price of jet fuel in Europe (ARA). All in USD/b

Our back of the envelope calculation of the global shortage created by the closure of the Strait of Hormuz. Note that 3.5 mb/d of discharge from SPR is also a draw. Note also that ’Forced demand loss’ of 2.5 mb/d is probably temporary and will fall back towards zero as logistics are sorted out leaving ’Price demand loss’ to do the job of balancing the market. Thus a shortfall of at least 9 mb/d created by the closure. More if SPR discharge is included and more if Forced demand loss recedes.

Brent is climbing higher. Front-month is at USD 106.3/bl this morning, close to a weekly high and a USD 9/bl jump from Mondays open. This is the move we flagged as a risk earlier in the week: the market shifting from ”a deal is around the corner” to ”this is going to take longer than we thought”.

Analyst Commodities, SEB
During April, rest-of-year Brent remained remarkably stable around USD 90/bl. A stability which rested on one single assumption: the SoH reopens around 1 May. That assumption is now slowly falling apart.
As we highlighted yesterday: every week of delay beyond 1 May adds (theoretically) ish USD 5/bl to the rest-of-year average, as global inventories draw 100 million barrels per week. i.e., a mid-May reopening implies rest-of-year Brent closer to USD 100/bl, and anything pushing into June or July takes us meaningfully higher.
What’s changed in the last 48 hours:
#1: The US military has formally warned that clearing suspected sea mines from SoH could take up to six months. That is a completely different timescale from what the financial market is pricing. Even a political deal tomorrow does not immediately reopen the strait.
#2: Trump has shifted his tone from urgency to ”strategic patience”. In yesterday’s press conference: ”Don’t rush me… I want a great deal.” The market is reading this as a president no longer feeling pressured by timelines, with the naval blockade running in the background.
#3: So far, the military activity is escalating, not de-escalating. Axios reports Iran is laying more mines in SoH. The US 3rd carrier strike group (USS George H.W. Bush) is arriving with two countermine vessels. Trump yesterday ordered the US Navy to destroy any Iranian boats caught laying mines. While CNN reports that the Pentagon is actively drawing up plans to strike Iranian SoH capabilities and individual Iranian military leaders if the ceasefire collapses. i.e., NOT a attitude consistent with an imminent deal!
Spot crude and product prices eased off the early-April highs on a combination of system rerouting and deal optimism. Both now weakening. Goldman estimates April Gulf output is reduced by 14.5 mbl/d, or 57% of pre-war supply, a number that keeps getting worse the longer this drags on.
Demand-side adaptation is ongoing: S. Korea has cut its Middle East crude dependence from 69% to 56% by pulling more from the Americas and Africa, and Japan is kicking off a second round of SPR releases from 1 May. But SPRs are finite.
Ref. to the negotiations, we should not bet on speed. The current Iranian leadership is dominated by genuine hardliners willing to absorb economic pain and run the clock to extract concessions. That is not a setup for a rapid resolution. US/Israeli media briefings keep framing the delay as ”internal Iranian divisions”, the reality is more complicated and points toward weeks and months, not days.
Our point is that the complexity is large, and higher prices have only just started (given a scenario where the negotiations drag out in time). The market spent April leaning on the USD 90/bl rest-of-year assumption; that case is diminishing by the hour. If ”early May reopening” is replaced by ”June, July or later” over the next week or two, both crude and products have meaningful room to reprice higher from here. There is a high risk being short energy and betting on any immediate political resolution(!).
Down on Friday. Up on Monday. The Brent June crude oil contract traded down 5.1% last week to a close of $90.38/b. It reached a high of $103.87/b last Monday and a low of $86.09/b on Friday as Iran announced that the Strait of Hormuz was fully open for transit. That quickly changed over the weekend as the US upheld its blockade of Iranian oil exports while Iran naturally responded by closing the SoH again. The US blew a hole in the engine room of the Iranian ship TOUSKA and took custody of the ship on Sunday. Brent crude is up 5.6% this morning to $95.4/b.
The cease-fire is expiring tomorrow. The US has said it will send a delegation for a second round of negotiations in Islamabad in Pakistan. But Iran has for now rejected a second round of talks as it views US demands as unrealistic and excessive while the US is also blocking the Strait of Hormuz.
While Brent is up 5% this morning, the financial market is still very optimistic that progress will be made. That talks will continue and that the SoH will fully open by the start of May which is consistent with a rest-of-year average Brent crude oil price of around $90/b with the market now trading that balance at around $88/b.
Financial optimism vs. physical deterioration. We have a divergence where the financial market is trading negotiations, improvements and resolution while at the same time the physical market is deteriorating day by day. Physical oil flows remain constrained by disrupted flows, longer voyage times and elevated freight and insurance costs.
Financial markets are betting that a US/Iranian resolution will save us in time from violent shortages down the road. But every day that the SoH remains closed is bringing us closer to a potentially very painful point of shortages and much higher prices.
The US blockade is also a weapon of leverage against its European and Asian allies. When Iran closed the SoH it held the world economy as a hostage against the US. The US blockade of the SoH is of course blocking Iranian oil exports. But it is also an action of disruption directed towards Europe and Asia. The US has called for the rest of the world to engaged in the war with Iran: ”If you want oil from the Persian Gulf, then go and get it”. A risk is that the US plays brinkmanship with the global oil market directed towards its European and Asian allies and maybe even towards China to force them to engage and take part. Maybe unthinkable. But unthinkable has become the norm with Trump in the White House.


Sommarväder skapar prisrally på elbörsen
Oil product price pain is set to rise as the Strait of Hormuz stays closed into summer

Solkraften pressar elpriserna dagtid

Michel Gubel ger sin syn på oljemarknaden