

Analys
SEB Jordbruksprodukter, 16 december 2013


 Årets sista WASDE-rapport publicerades i tisdags och bekräftade Australiens och Kanadas rapporter, men nonchalerade Argentinas, alla från veckan innan. För sojabönor hamnade USDA på oförändrade 88 mt för Brasilien. Samma dag publicerade CONAB en prognos på 90 mt. Kanadas rapport för två veckor sedan fick canolan i Winnipeg i fritt fall, vilket börjar sprida sig till Europa nu. Att Frankrike höjde rapsarealen istället för att som väntat sänka den, kommer att bidra till att baissen får grepp i Europa också.
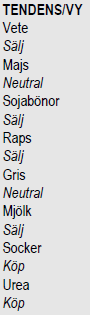
Jag tror att vetemarknaden kommer att ha en lite svagare utveckling framöver och går därför över till en kortsiktig säljrekommendation (från neutral).
Mjölkpriserna basis Eurex SMP och smör-terminer steg med 1% i svenska kronor per kilo mjölkråvara och det berodde helt på att kronan försvagades mot euron. Mjölkbörserna var annars lite svagare i veckan än förut.
Nästa WASDE-rapport publiceras den 10 januari och det här veckobrevet är också det sista för året och önskar alla läsare en God Jul och ett Gott Nytt År 2013.
Odlingsväder
Det är både blötare och varmare i Europa än normalt och detta väntas bestå åtminstone fram till slutet av året. I Nordamerika drar i skrivande stund en snöstorm fram, som fått flygen att bli inställda t ex i Toronto.
I Sydamerika, kan vi notera att det är onormalt varmt och lite nederbörd i norra Argentina, landets kornbod. Vi ser detta i kartbilden nedan.
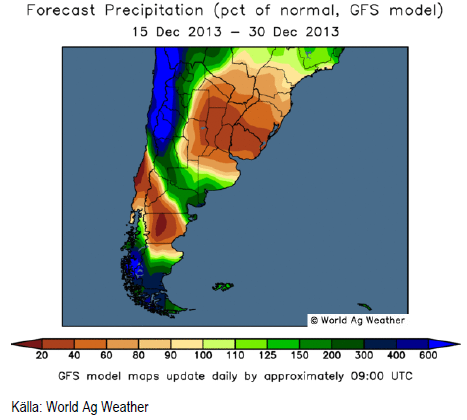
I Brasiilien är vädret alltjämt normalt.
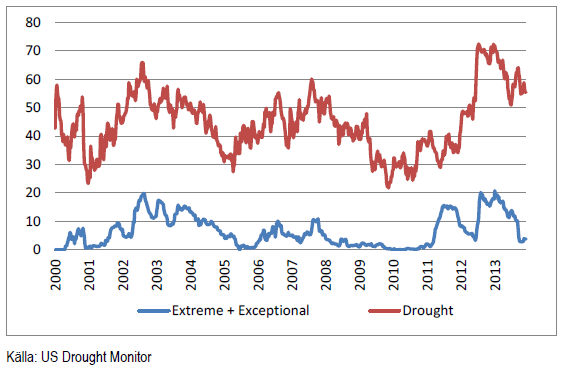
En hastig blick på US Drought Monitor, visar att det inte varit några stora förändringar i hur stor andel av USA:s areal som är torrare än normalt.
Vete
Terminskontrakten i Chicago föll med 3% i veckan och Matif med 2%. WASDE-rapporten i sig själv påverkade inte marknaden, eftersom den inte innehöll något nytt, utan snarare bekräftade produktionshöjningarna i Kanada och Australien från veckan innan och som väntat nonchalerade Argentinas påstående att skörden skulle bli 8.5 mt istället för 11 mt som alla andra utom den Argentinska staten förväntat sig.
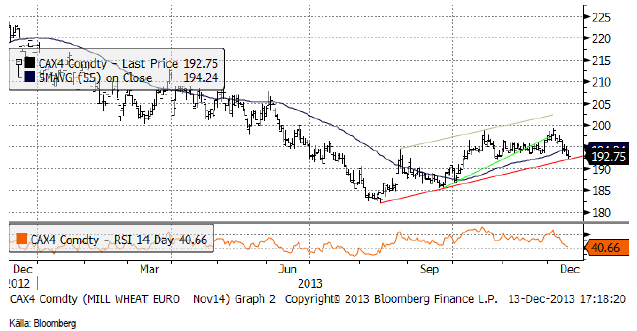
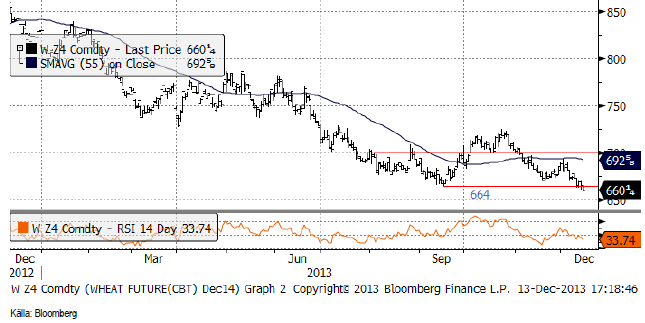
Tekniskt stängde Matif precis på stödet för uppgången från början av augusti. Eftersom Chicagovetet i fredags gick under stödet på 664 cent (basis Dec 2014-kontraktet), skulle det inte förvåna om Matif bröt stödet och inledde en rekyl nedåt. November 2014-kontraktet låg i fredags på 192.75 och om stödet bryts finns nästa stöd på 185 euro. Vi skulle tro att priset går dit. Eventuellt finns stöd på 190, där priset kan studsa som hastigast.
Decemberkontraktet 2014 på CBOT som föll tillbaka ner mot det tekniska stödet, efter ABARES och Stats Canadas rapporter, bröt igenom stödet på 664 i fredags. Det är en teknisk säljsignal.
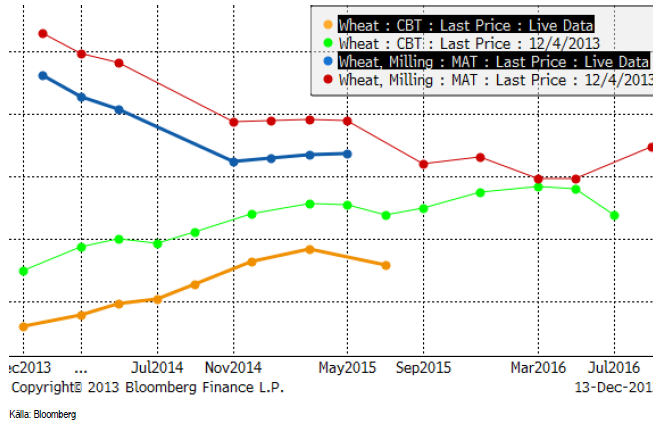
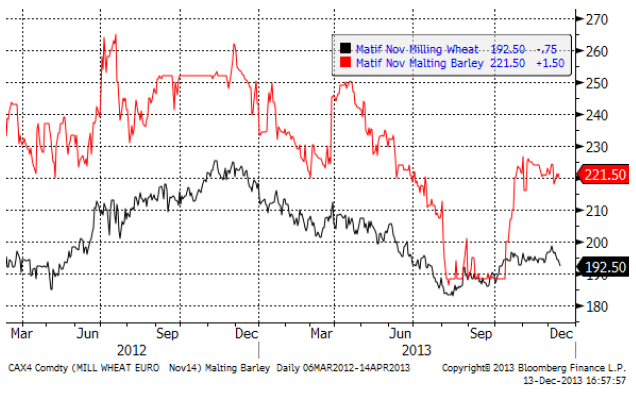
Nedan ser vi terminskurvorna för Chicagovete och Matif.
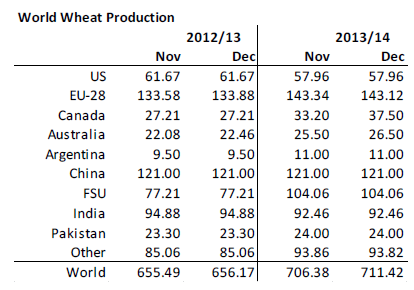
I tisdags kom så årets sista WASDE-rapport från USDA. USDA fick med och tog till sig de nya högre produktionsestimaten från veckan innan från Kanada (37.5 mt) och Australien (26.5), men gjorde inte det för Argentina, där USDA fortfarande har 11 mt. Det står ju helt klart att Argentinas produktionsestimat är lågt därför att det då begränsar exporten till 1.5 mt och inte 4 mt som det hade varit om de hade sagt 11 mt. Sammantaget justeras alltså global produktion 2013/14 upp med 5 mt till 711.42 mt.
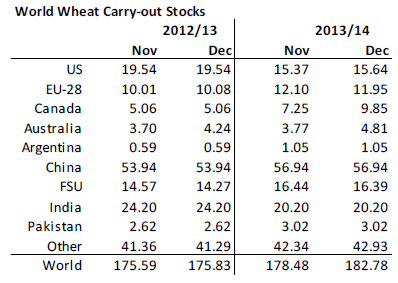
Höjningen av produktionsestimatet så plötsligt gör också att utgående lager justeras upp. Det finns ju ingen anledning att tro att konsumtionen ska öka om inte priset sjunker, eller tillväxten i tillväxtländer tar fart. Utgående lager justeras upp med 4 mt. Det kan synas märkligt att man inte höjde med 5 mt, eftersom inget har hänt som motiverar högre konsumtion.
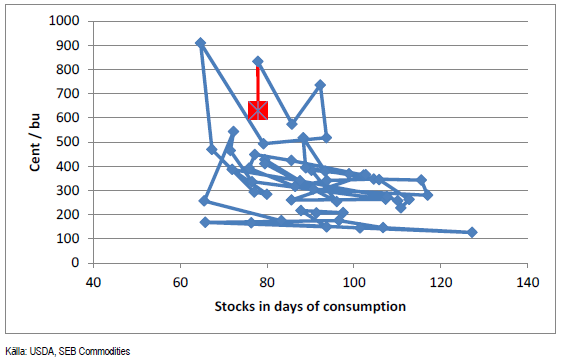
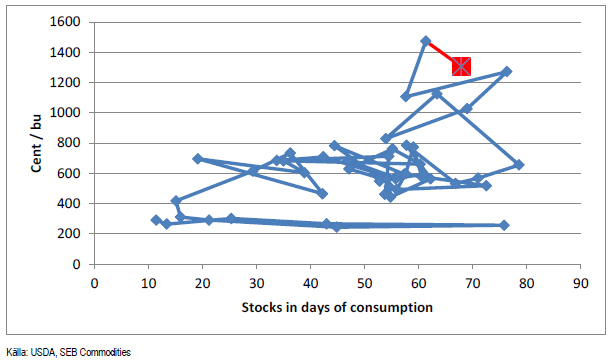
Ser vi till prisets relation till utgående lager, ligger priset möjligtvis något lågt om vi jämför med den allmänna bilden som förhållandet mellan pris och lager de senaste åren ger. Å andra sidan kan vi jämföra med punkten för fem år sedan, när priset var 100 cent lägre för nästan samma nivå på lagret. Det är alltså svårt att dra några entydiga slutsatser om priset just nu är för ”högt” eller för ”lågt”.
Vi tror det kommer en period med lite svagare marknad nu, med en mindre nedgång i terminerna på vete. På ett lite längre perspektiv är vi mer eller mindre neutrala, men på kort sikt går vi över från neutral till säljrekommendation.
Optioner på vete
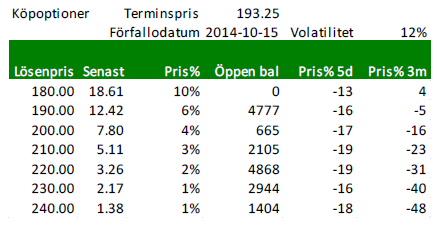
Nedan ser vi priserna på köpoptioner på Matif på November-2014 (Matif vete). Notera att historisk volatilitet har stigit upp från 11% till 12% igen.
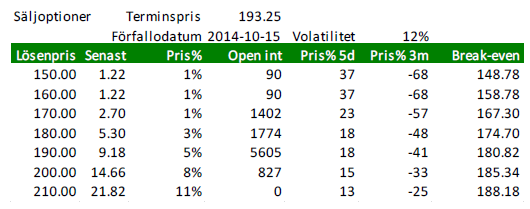
Nedanstående är priser på säljoptioner.
Maltkorn
November 2014 – kontraktet på har den senaste tiden gått lite svagare än Matif-vetet.
Majs
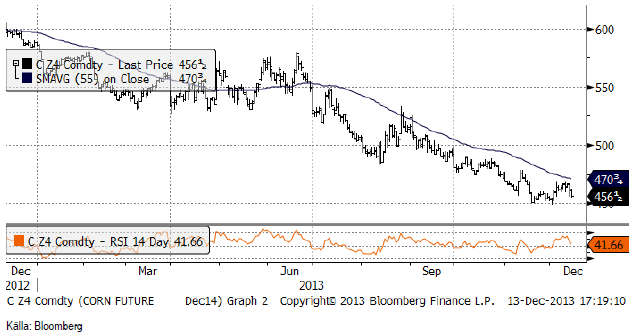
Majspriset reagerade på WASDE-rapporten, till skillnad från vetet. Trots att utgående lager justerades ner, oroar sig marknaden för att januari-rapporten ska visa högre produktion både i USA och i Kina. Kinas eget estimat, som kom härom veckan, ligger 6.5 mt högre än USDA. Tekniskt ser marknaden illavarslande ut, då priset ser ut att återigen vara på väg ner till den psykologiskt viktiga nivån 450 cent. Ska det bli tredje gången gillt och ett fall under den nivån?
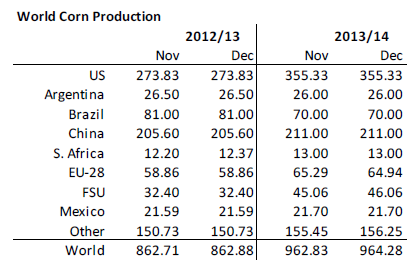
USDA justerade upp global produktion med 1.5 mt. En liten sänkning gjordes av estimatet för EU-28, skörden i fd Sovjet (Ukraina) höjdes ytterligare, med 1 mt. Men det saknas alltså +6.5 mt på Kina. Att Kina inte verkar importera majs från USA i samma utsträckning som tidigare, indikerar att Kina verkligen har fått en bättre skörd än väntat. Marknaden ser det så i alla fall, och ”justerar” USDA:s estimat så att den global produktion nu är 8 mt högre än estimerat i november.
USDA sänker utgående lager med 2 mt, därför att man räknar med högre foderefterfrågan i EU-28, Kanada, Ukraina och högre efterfrågan på majs till etanoltillverkning i USA. Detta verkar rimligt med tanke på boomen i kött och mjölkpriser. Det är nog en trend vi kommer att se mer höjningar i konsumtionen för. Men vi tror inte att höjningen av efterfrågan på majs till etanolindustrin är långsiktigt hållbar. Kina har dessutom satt en båtlast med DDG (drank) från USA i karantän därför att man misstänker att den innehåller GMO-vara av en sort som är förbjuden i Kina. Skulle DDG-exporten till Kina stanna av, skulle ekonomin i etanoltillverkningen försämras, allt annat lika.
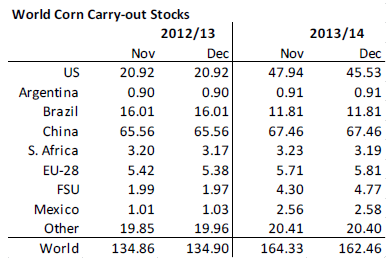
”Egentligen” skulle den här rapporten, med Kinas egna produktionsestimat, ha visat högre utgående lager.
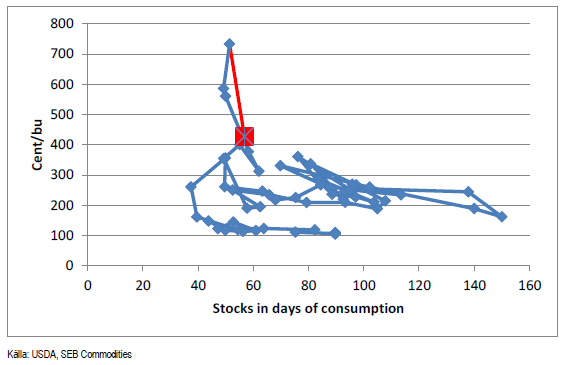
Priset ser ut att ligga ”OK” i förhållande till estimerat utgående lager och i förhållande till de senaste årens relation mellan pris och lager.
Vi fortsätter med neutral rekommendation, men skulle 450 cent brytas, bör man vara nettosåld majs, pga vad den tekniska analysen då säger.
Sojabönor
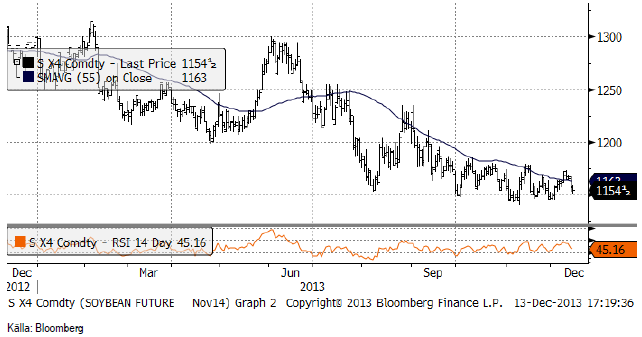
Även sojabönorna föll efter WASDE-rapporten. 1150 cent är dock ett starkt stöd för marknaden. 55% av Brasiliens sojaskörd är enligt uppgifter därifrån redan såld / prissäkrad.
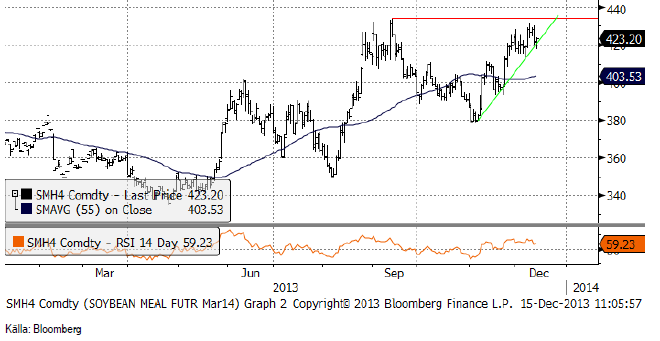
Gammal skörd av sojamjöl (mars-kontraktet 2014) lyckades inte ta sig upp till en ny all-time-high i veckan. Priset ligger precis på stödlinjen för uppgången. Det skulle inte förvåna om säljare kommer in här, samtidigt som köpare tar hem vinster och vi får ett brott av stödlijen, med prisfall ner till 400 dollar som följd.
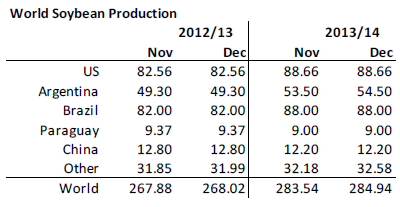
WASDE-rapporten visade 1.5 mt högre produktion. Argentina höjdes 1 mt och övriga länder med 0.5. Värt att notera är att produktionen antagligen är högre än vad USDA har estimerat här i december-rapporten. Dels är estimatet för Argentina på 54.5 mt fortfarande 3 mt lägre än vad USDA:s egen attaché vid FAS rapporterade härom veckan. Dels är estimatet för Brasilien oförändrat på 88 mt, när CONAB och många privata firmor på plats ligger på 90 mt. Kanske avvaktar USDA hur vädret utvecklar sig i Argentina och Brasilien. I Argentina har det blivit lite varmare, men i Brasilien är vädret muito bom.
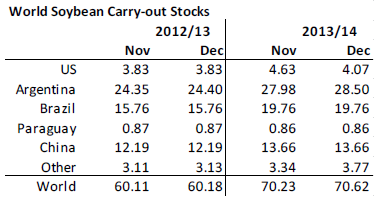
Med en produktionsökning på 1.5 mt höjer USDA utgående lager med 0.5 mt – allt i Argentina – vilket förmodligen är helt riktigt. Utgående lager sänktes för USA, vilket också verkar rimligt med tanke på prisutvecklingen för griskött och mjölk, t ex. Efterfrågan på sojamjöl kommer antagligen att fortsatt vara stark.
För fyra år sedan var lagernivån på ungefär samma nivå som nu och priset var 150 cent lägre. Det talar för en svag prisutveckling framöver. Det är dock värt att hålla koll på vart priserna på mjölk och lean hogs tar vägen framöver. Skulle de fortsätta att stärkas och därmed stimulera till större besättningar, kan efterfrågan på sojamjöl vara en faktor som dämpar eller hindrar prisfall på sojan.
Kina har satt en båtlast med DDG i karantän för undersökning av GMO-innehåll. Risken är att DDG som gått till Kina kommer att stanna i USA – och därmed pressa priset på sojamjöl.
Vi behåller säljrekommendation.
Raps
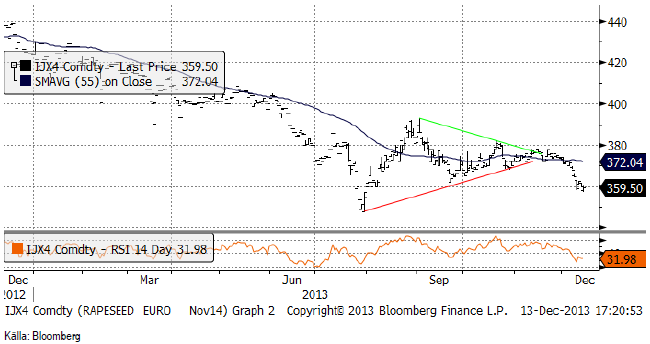
November 2014-kontraktet som jag säljrekommenderade förra veckan föll ner till 360 euro. Priset bröt även den nivån mot slutet av veckan och nästa nivå i sikte är nu 350 euro. Vi fortsätter med säljrekommendation.
Frankrike höjde rapsarealen med 7% jämfört med förra året. Den allmänna uppfattningen under hösten var att den skulle bli mindre, pga den försämrade lönsamheten i valet av raps framför t ex vete.
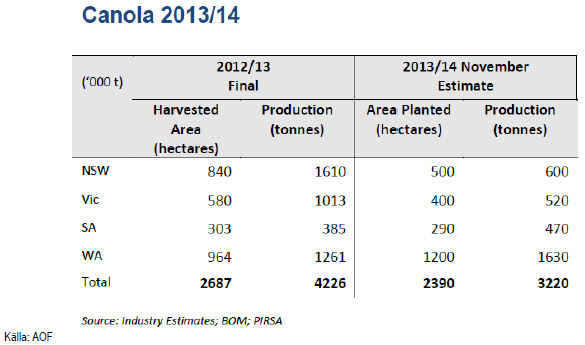
AOF (Australian Oilseeds Federation) gör endast en mindre nedjustering från tidigare estimat för landets produktion av canola 2013/14, detta trots en betydande negativ påverkan på grödorna till följd av frost i New South Wales och Victoria. Produktionen beräknas uppgå till 3.2 mt i år, ner från tidigare estimat på 3.4 mt och förra årets produktion på 4.2 mt. En varm start på våren påskyndade grödornas utveckling och gjorde dem mer känsliga för extrema väderslag, vilket gjorde att torra väderförhållanden och frost under våren fick en betydande inverkan på grödorna i NSW och Victoria. Bortfallet av grödor i östkust staterna har dock nästan helt kompenserats av avkastningen i Western Australia där de säsongsmässiga förhållandena har varit näst intill perfekta under de senaste månaderna.
Produktionen av raps i EU-28 förväntas uppgå till 21.3 mt 2014/15 enligt Strategie Grains, en ökning med 500 000 ton eller 2.4% från årets 20.8 mt då högre avkastning förväntas kompensera en liten nedgång i sådd. Den genomsnittliga avkastningen för nästa års skörd beräknas uppgå till 3.2 t/ha mot årets 3.1 t/ha, vilket skulle kompensera för en minskad areal (från 6.7 mha till 6.6 mha).
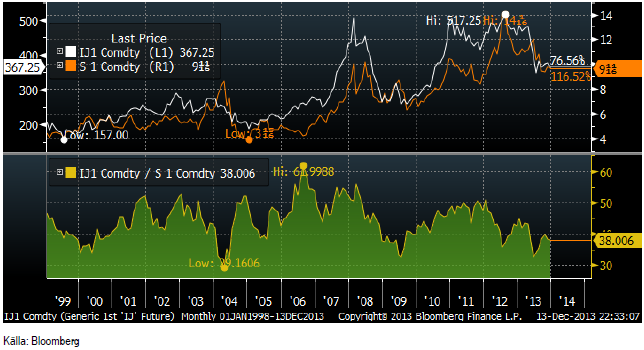
Efter nyheten om rekordskörden av canola i Kanada, har rapspriset förlorat mark i förhållande till soja. I diagrammet nedan ser vi att detta är en fortsättning på en trend, som inleddes redan 2006, när raps var som dyrast i förhållande till soja. I diagrammet nedan har jag räknat om sojapriset till euro (per bushel).
Canolaterminerna i Kanada har förlorat ännu mer mark i förhållande till sojabönorna i Chicago i veckan som gått. Rapspriset på Matif har inte riktigt tagit in det prisfallet.
Vi fortsätter med förra veckans säljrekommendation.
Potatis
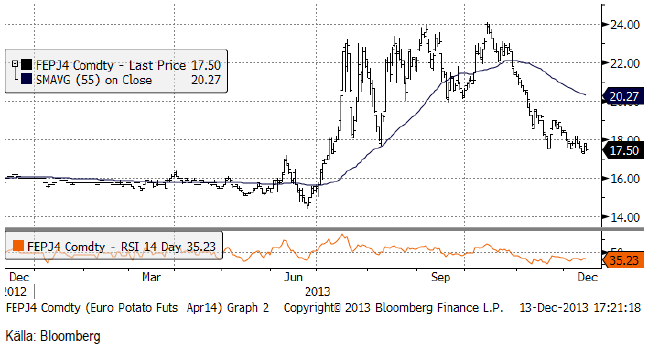
Potatispriset av årets skörd, har fortsatt att handlas svagt och noterades i fredags en halv euro lägre per deciton, på 17.50 euro.
Gris
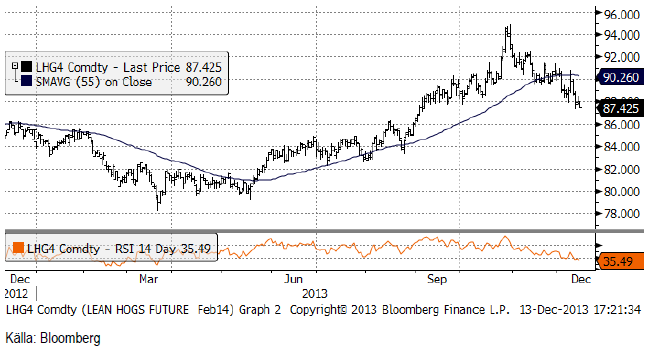
Lean hogs mars-kontrakt fortsatte att gå ner i pris i veckan som gick och stängde 1.5 cent lägre än förra veckan. Lägre pris på lean hogs är en faktor som påverkar soja- och majspriserna negativt.
Mjölk
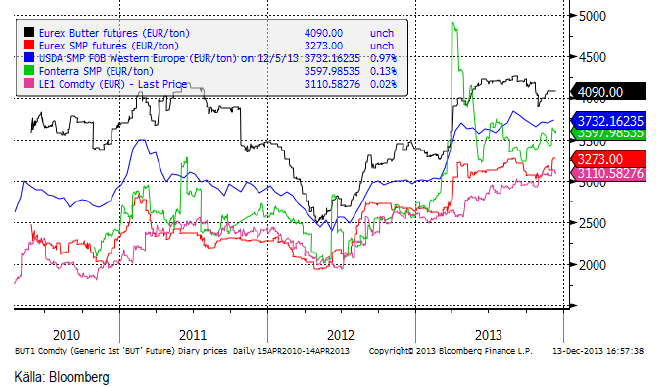
SMP-terminerna på Eurex var oförändrade i veckan. SMP handlades lite starkare i början på veckan, men var sedan oförändrade. Smörpriset var oförändrat. I svenska kronor steg priset med 1% för alla terminsköptider, eftersom euron steg mot kronor.
Terminspriserna i Chicago sjönk faktiskt. Prisuppgången som varit mycket stadig i ett och ett halvt år, tycks hålla på att tappa lite av sitt momentum och det märks tydligast i prisutvecklingen på smör.
I diagrammet nedan har jag lagt till priset på CME:s SMP-kontrakt, omräknat till euro per ton och därmed i samma enhet som de andra prisserierna. Det är den lila kurvan. Vi ser att den faktiskt och inte så förvånande, följer Eurex SMP-termin.
Nedan ser vi terminspriserna man får i svenska kronor från terminspriserna på SMP och smör på Eurex, omräknat till kronor per kilo mjölkråvara. Notera dock att hela den här prisnivån alltid ska ligga över avräkningspriset på mjölkråvara med ca 50 öre, som är en uppskattning av kostnaden för att förädla mjölkråvara till SMP och smör.
Socker
Marskontraktet på råsocker har till vår stora besvikelse fortsatt att falla till kontraktslägsta på 16.29 cent per pund i marskontraktet. RSI ligger på en ny lägsta nivå om 16.75. En nivå under 30 brukar anses indikera en ”översåld” marknad och en nära förestående rekyl. En så här lång period av rekylfri nedgång är mycket ovanlig och kan bara förklaras av att många måste ha trott på en rekyl uppåt tidigare, liksom vi, och successivt tagit stoppar. Det är svårt att resonera här, för trots att priset faller, så byggs potentialen i rekylen uppåt upp allt mer, ju mer priset faller. Å andra sidan föll priset under det tekniska stödet på 16.60, vilket indikerar ytterligare svaghet i marknaden.
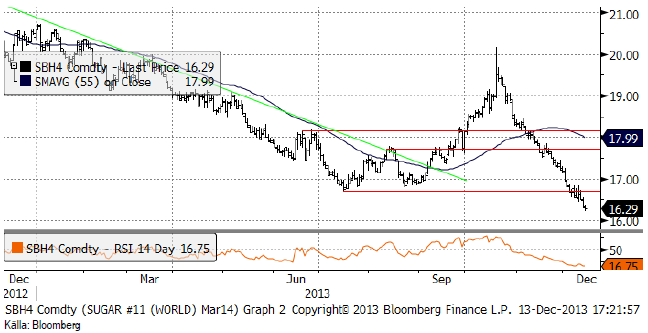
Om vi ser till ”spotkontraktet”, ser vi att prisfallet börjar nå ner till 16 cent, som var bottennoteringen i juli. Det är en nivå där det bör finnas stöd.
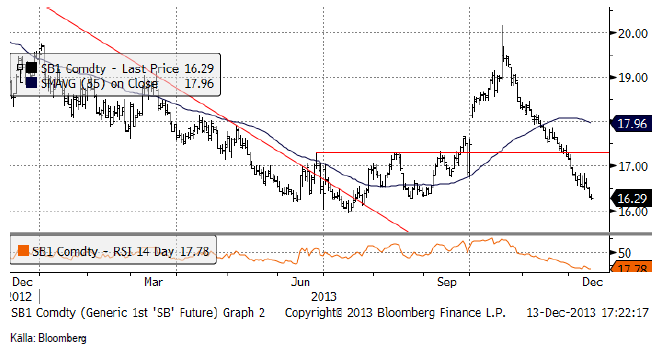
Marknaden har fortsatt handla starkt vid starten på handelsdagen, dvs under europeisk dagtid, för att sedan falla under amerikansk handelstid. Skörden i Brasilien har förbättrats mot slutet och det är antagligen producenter som prissäkrar, särskilt då priset i reais inte fallit som det gjort i dollar. Den Thailändska skörden börjar nu och det kan också vara en orsak till den påtagliga svagheten i prisutvecklingen just nu. Importmarginalen till Kina är negativ. Kina är en av världens största importörer.
Vi tror att botten noterades i juli och att den i och för sig mycket kraftiga nedgången är en rekyl.
Produktionsöverskottet går mot sitt slut och därmed finns en potential för priset att nå upp till produktionskostnaden. Vi rekommenderar köp av SOCKER S eller BULL SOCKER X4 S för den som vill ta mer risk.
Gödsel
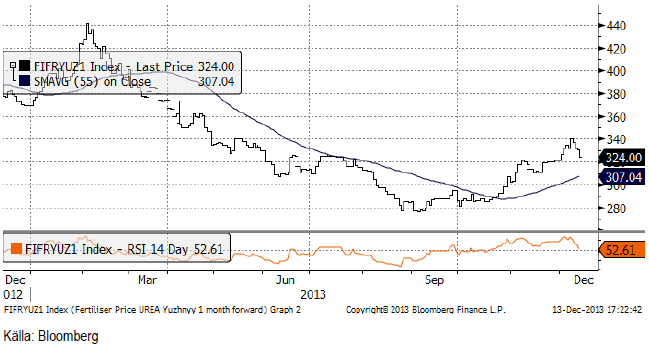
Förra veckan skrev vi att marknaden för urea var överköpt med ett RSI på 80 (över 70, som är gränsen för en ”överköpt” marknad. Priset har nu fallit tillbaka från 340 dollar till 324 dollar. Trenden är dock uppåtriktad, alltjämt och vi ser detta som ett köptillfälle.
[box]SEB Veckobrev Jordbruksprodukter är producerat av SEB Commodities Sales desk och publiceras i samarbete och med tillstånd på Råvarumarknaden.se[/box]
Detta marknadsföringsmaterial, framtaget av SEB’s Commodities Sales desk, har upprättats enbart i informationssyfte.
Även om innehållet är baserat på källor som SEB bedömt som tillförlitliga ansvarar SEB inte för fel eller brister i informationen. Den utgör inte oberoende, objektiv investeringsanalys och skyddas därför inte av de bestämmelser som SEB har infört för att förebygga potentiella intressekonflikter. Yttranden från SEB’s Commodities Sales desk kan vara oförenliga med tidigare publicerat material från SEB, då den senare hänvisas uppmanas du att läsa den fullständiga rapporten innan någon åtgärd vidtas.
Dokumentationen utgör inte någon investeringsrådgivning och tillhandahålls till dig utan hänsyn till dina investeringsmål. Du uppmanas att självständigt bedöma och komplettera uppgifterna i denna dokumentation och att basera dina investeringsbeslut på material som bedöms erforderligt. Alla framåtblickande uttalanden, åsikter och förväntningar är föremål för risker, osäkerheter och andra faktorer och kan orsaka att det faktiska resultatet avviker väsentligt från det förväntade. Historisk avkastning är ingen garanti för framtida resultat. Detta dokument utgör inte ett erbjudande att teckna några värdepapper eller andra finansiella instrument. SEB svarar inte för förlust eller skada – direkt eller indirekt, eller av vad slag det vara må – som kan uppkomma till följd av användandet av detta material eller dess innehåll.
Observera att det kan förekomma att SEB, dess ledamöter, dess anställda eller dess moder- och/eller dotterbolag vid olika tillfällen innehar, har innehaft eller kommer att inneha aktier, positioner, rådgivningsuppdrag i samband med corporate finance-transaktioner, investment- eller merchantbankinguppdrag och/eller lån i de bolag/finansiella instrument som nämns i materialet.
Materialet är avsett för mottagaren, all spridning, distribuering mångfaldigande eller annan användning av detta meddelande får inte ske utan SEB:s medgivande. Oaktat detta får SEB tillåta omfördelning av materialet till utvald tredje part i enlighet med gällande avtal. Materialet får inte spridas till fysiska eller juridiska personer som är medborgare eller har hemvist i ett land där sådan spridning är otillåten enligt tillämplig lag eller annan bestämmelse.
Skandinaviska Enskilda Banken AB (publ) är ett [publikt] aktiebolag och står under tillsyn av Finansinspektionen samt de lokala finansiella tillsynsmyndigheter i varje jurisdiktionen där SEB har filial eller dotterbolag.

Market is starting to take US/Iran headlines with a pinch of salt. Brent crude rose $2.8/b yesterday to an official close of $112.1/b. But after that it traded as low as $108.05/b before ending late night at around $109.7/b. Through the day it traded in a range of $106.87 – 112.72/b amid a flurry of news or rumors from Iran and the US. ”US temporary sanctions during negotiations” (falls alarm). ”We will bomb Iran” (not anyhow),… etc. While the market is still fluctuating to this kind of news flow, it is starting to take such headlines with a pinch of salt.

We’ll see. Maybe, maybe not. The Brent M1 contract is trading at $110.2/b this morning which very close to the average ticks through yesterday of $110.4/b.
Trump with bearish, verbal intervention whenever Brent trades above $110/b it seems. What seems to be a pattern is that Trump states something like ”very good negotiations going on with Iran”, ”New leaders in Iran are great,..”, ”Great progress in negotiations,…”, ”Deal in sight,..” etc whenever the Brent M1 contract trades above $110/b. An effort to cool the market. These hot air verbal interventions from Trump used to have a heavy bearish impact on prices, but they now seems to have less and less effect unless they are backed by reality.
As far as we can see there has been no real progress in the negotiations between the US and Iran with both sides still standing by their previous demands.
Iran is getting stronger while the cease fire lasts making a return to war for Trump yet harder. Iran is naturally in constant preparation for a return to war given Trump’s steady threats of bombing Iran again. Iran is naturally doing what ever is possible to prepare for a return to war. And every day the cease fire lasts it is better prepared. This naturally makes it more and more difficult and dangerous for the US to return to warring activity versus Iran as the consequences for energy infrastructure in the Persian Gulf will be more and more severe the longer the cease fire lasts. Israel seems to see it this way as well. That the war is not won and that current frozen state of a cease fire gives Iran opportunity to rebuild military and politically.
Global inventories are drawing down day by day. How much? In the meantime the Strait of Hormuz stays closed. There is varying measures and estimates of how much global inventories are drawing down. Our rough estimate, back of the envelope, is that global inventories are drawing down by at least some 10 mb/d or about 300 mb/d in a balance between loss of supply versus demand destruction. Other estimates we see are a monthly draw of 250-270 mb/d. The IEA only ’measured’ a draw in global observable stocks of 117 mb in April with oil on water rising 53 mb while on shore stocks fell 170 mb. But global stocks are hard to measure with large invisible, unmeasured stocks. As such a back of the envelope approach may be better.
Oil products is what the world is consuming. Oil product prices likely to rise while product stocks fall. Strategic Petroleum Reserves (SPR) are predominantly crude oil. Discharging oil from OECD SPR stocks, a sharp reduction in Chinese crude imports and a reduction in global refinery throughput of 6-7 mb/d has helped to keep crude oil markets satisfactorily supplied. But global inventories are drawing down none the less. And oil products is really what the world is consuming. So if global refinery throughput stays subdued, then demand will eventually have to match the supply of oil products. The likely path forward this summer is a steady draw down in jet fuel, diesel and gasoline. Higher prices for these. Then, if possible, higher refinery throughput and higher usage of crude in response to very profitable refinery margins. And lastly sharper draw in crude stocks and higher prices for these. But some 6 mb/d of oil products used to be exported through the Strait of Hormuz. And it may not be so easy to ramp up refinery activity across the world to compensate. Especially as Ukraine continues to damage Russian refineries as well as Russian crude production and export facilities.
Watch oil product stocks and prices as well as Brent calendar 2027. What to watch for this summer is thus oil product inventories falling and oil product premiums to crude rising. Another measure to watch is the Brent crude 2027 contract as it rises steadily day by day as the Strait of Hormuz stays closed and global oil inventories decline. The latter is close to the highest level since the start of the war and keeps rising.
The Brent M1 contract and the Brent 2027 prices and current price of jet fuel in Europe (ARA). All in USD/b

Our back of the envelope calculation of the global shortage created by the closure of the Strait of Hormuz. Note that 3.5 mb/d of discharge from SPR is also a draw. Note also that ’Forced demand loss’ of 2.5 mb/d is probably temporary and will fall back towards zero as logistics are sorted out leaving ’Price demand loss’ to do the job of balancing the market. Thus a shortfall of at least 9 mb/d created by the closure. More if SPR discharge is included and more if Forced demand loss recedes.

Brent is climbing higher. Front-month is at USD 106.3/bl this morning, close to a weekly high and a USD 9/bl jump from Mondays open. This is the move we flagged as a risk earlier in the week: the market shifting from ”a deal is around the corner” to ”this is going to take longer than we thought”.

Analyst Commodities, SEB
During April, rest-of-year Brent remained remarkably stable around USD 90/bl. A stability which rested on one single assumption: the SoH reopens around 1 May. That assumption is now slowly falling apart.
As we highlighted yesterday: every week of delay beyond 1 May adds (theoretically) ish USD 5/bl to the rest-of-year average, as global inventories draw 100 million barrels per week. i.e., a mid-May reopening implies rest-of-year Brent closer to USD 100/bl, and anything pushing into June or July takes us meaningfully higher.
What’s changed in the last 48 hours:
#1: The US military has formally warned that clearing suspected sea mines from SoH could take up to six months. That is a completely different timescale from what the financial market is pricing. Even a political deal tomorrow does not immediately reopen the strait.
#2: Trump has shifted his tone from urgency to ”strategic patience”. In yesterday’s press conference: ”Don’t rush me… I want a great deal.” The market is reading this as a president no longer feeling pressured by timelines, with the naval blockade running in the background.
#3: So far, the military activity is escalating, not de-escalating. Axios reports Iran is laying more mines in SoH. The US 3rd carrier strike group (USS George H.W. Bush) is arriving with two countermine vessels. Trump yesterday ordered the US Navy to destroy any Iranian boats caught laying mines. While CNN reports that the Pentagon is actively drawing up plans to strike Iranian SoH capabilities and individual Iranian military leaders if the ceasefire collapses. i.e., NOT a attitude consistent with an imminent deal!
Spot crude and product prices eased off the early-April highs on a combination of system rerouting and deal optimism. Both now weakening. Goldman estimates April Gulf output is reduced by 14.5 mbl/d, or 57% of pre-war supply, a number that keeps getting worse the longer this drags on.
Demand-side adaptation is ongoing: S. Korea has cut its Middle East crude dependence from 69% to 56% by pulling more from the Americas and Africa, and Japan is kicking off a second round of SPR releases from 1 May. But SPRs are finite.
Ref. to the negotiations, we should not bet on speed. The current Iranian leadership is dominated by genuine hardliners willing to absorb economic pain and run the clock to extract concessions. That is not a setup for a rapid resolution. US/Israeli media briefings keep framing the delay as ”internal Iranian divisions”, the reality is more complicated and points toward weeks and months, not days.
Our point is that the complexity is large, and higher prices have only just started (given a scenario where the negotiations drag out in time). The market spent April leaning on the USD 90/bl rest-of-year assumption; that case is diminishing by the hour. If ”early May reopening” is replaced by ”June, July or later” over the next week or two, both crude and products have meaningful room to reprice higher from here. There is a high risk being short energy and betting on any immediate political resolution(!).
Down on Friday. Up on Monday. The Brent June crude oil contract traded down 5.1% last week to a close of $90.38/b. It reached a high of $103.87/b last Monday and a low of $86.09/b on Friday as Iran announced that the Strait of Hormuz was fully open for transit. That quickly changed over the weekend as the US upheld its blockade of Iranian oil exports while Iran naturally responded by closing the SoH again. The US blew a hole in the engine room of the Iranian ship TOUSKA and took custody of the ship on Sunday. Brent crude is up 5.6% this morning to $95.4/b.
The cease-fire is expiring tomorrow. The US has said it will send a delegation for a second round of negotiations in Islamabad in Pakistan. But Iran has for now rejected a second round of talks as it views US demands as unrealistic and excessive while the US is also blocking the Strait of Hormuz.
While Brent is up 5% this morning, the financial market is still very optimistic that progress will be made. That talks will continue and that the SoH will fully open by the start of May which is consistent with a rest-of-year average Brent crude oil price of around $90/b with the market now trading that balance at around $88/b.
Financial optimism vs. physical deterioration. We have a divergence where the financial market is trading negotiations, improvements and resolution while at the same time the physical market is deteriorating day by day. Physical oil flows remain constrained by disrupted flows, longer voyage times and elevated freight and insurance costs.
Financial markets are betting that a US/Iranian resolution will save us in time from violent shortages down the road. But every day that the SoH remains closed is bringing us closer to a potentially very painful point of shortages and much higher prices.
The US blockade is also a weapon of leverage against its European and Asian allies. When Iran closed the SoH it held the world economy as a hostage against the US. The US blockade of the SoH is of course blocking Iranian oil exports. But it is also an action of disruption directed towards Europe and Asia. The US has called for the rest of the world to engaged in the war with Iran: ”If you want oil from the Persian Gulf, then go and get it”. A risk is that the US plays brinkmanship with the global oil market directed towards its European and Asian allies and maybe even towards China to force them to engage and take part. Maybe unthinkable. But unthinkable has become the norm with Trump in the White House.


Sommarväder skapar prisrally på elbörsen
Oil product price pain is set to rise as the Strait of Hormuz stays closed into summer

Solkraften pressar elpriserna dagtid

Michel Gubel ger sin syn på oljemarknaden