

Analys
SEB Jordbruksprodukter, 14 oktober 2013

 Vete, raps, potatis och socker gick upp förra veckan, majs och sojabönor ner. Det var en lugn vecka förra veckan, främst på grund av European Exchange, som gick av stapeln i Paris under torsdagen och fredagen. Med nästan hela den Europeiska marknaden i Paris blev handeln tunn.
Vete
November månads terminskontrakt på Matif har gått upp mot 200 euro, ett tekniskt motstånd. Det har varit en god uppgång och många kommer att vilja sälja till 200 euro. Vi gissar en det kommer en rekyl nedåt den här veckan, vilket vi tror är ett köptillfälle.
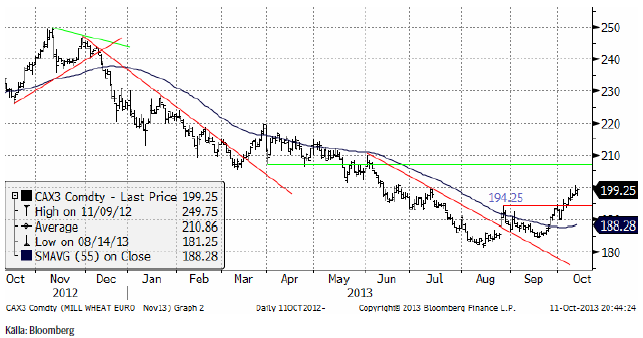
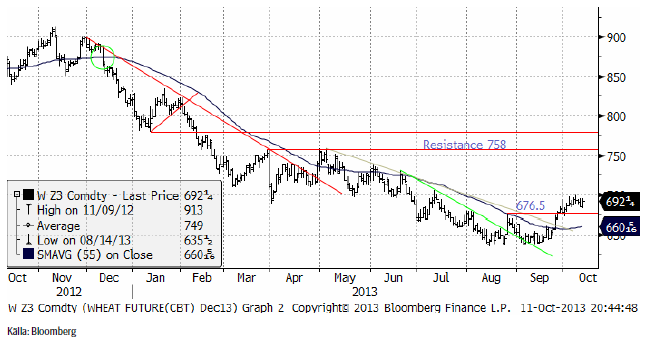
Decemberkontraktet på CBOT har haft svårt att ta sig över 700 cent, på samma sätt som Matif kämpar med 200 euro.
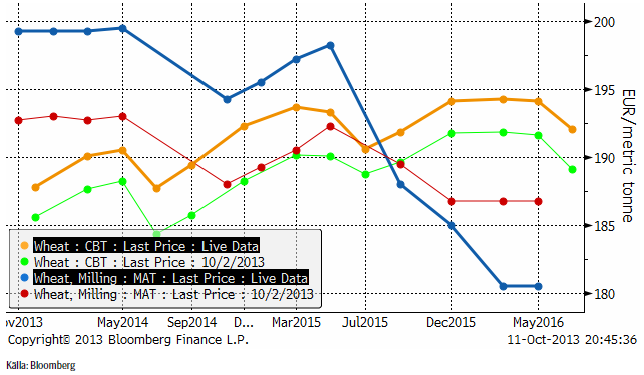
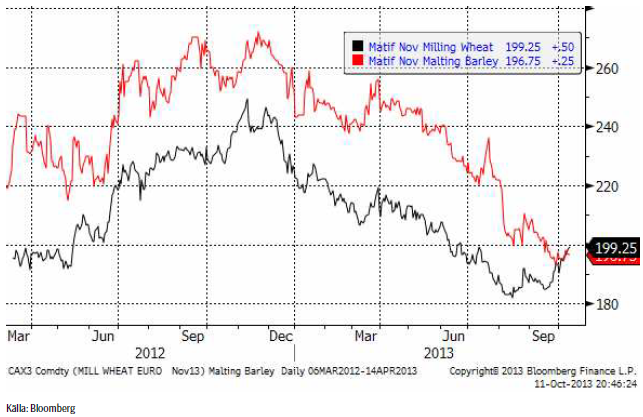
Nedan ser vi terminskurvorna för Chicagovete och Matif. Det är nästan backwardation i Matifmarknaden. Det är en återspegling av att så många lantbrukare håller på sitt vete för att de tror att priset ska stiga. Istället borde de sälja sin spannmål och ta sin position genom att köpa terminer. Det bytet innebär samma position i marknaden, samma antal ton, men pengar på banken (räntevinst), ingen risk för försämring av varan i lager och möjligheten att köpa på termin utan terminspåslag.
GASC ratade erbjudandena i veckan därför att man tyckte att priset var för högt.
Argentinas BAGE estimerade den kommande Argentinska veteskörden till drygt 10 mt. USDA:s senaste WASDE i september angav den till 12 mt.
 USA:s jordbruksdepartement är stängt pga budgetproblemen, vilket innebär att vi inte har några crop conditions, inga exportsiffror och ingen WASDE-rapport. Den skulle ha kommit den 11 september och analytikerna behöver ca 10 dagar på sig. Det innebär att den kan komma först den 24 oktober. Då är det nästan ingen idé att publicera den, vilket kan innebära att den helt kommer att utgå.
Även Europa var lugnt mot slutet av veckan på grund av European Exchange i Paris i torsdags och fredags. European Exchange är en mötesplats för alla i den europeiska spannmålsbranschen.
Den långsamma sådden i Ukraina är en faktor som påverkat prisutvecklingen positivt. Nu har vädret blivit bättre, vilket gör att höstarbetet underlättas.
Vi får en del frågor om optioner. Den som vill köpa en option via SEB kan göra det. Det behövs ett ramavtal, men däremot behöver banken inte göra en kreditprövning och man behöver inte heller ställa säkerhet, eftersom man som kund betalar priset (”premien”) i början och sedan erhåller eventuellt realvärde vid optionens lösen. Man behöver inte heller påkalla lösen själv, utan det sköts automatiskt till kontot i banken.
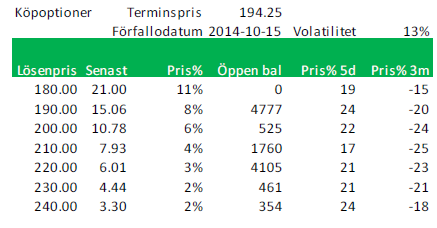
Det är så kort tid kvar till förfallet för novemberterminen 2013, så nedan ser vi priserna på köpoptioner på Matif på November-2014 (Matif vete). Notera att volatiliteten 13% är ganska låg. Volatiliteten brukar vara låg när priserna är låga.
Nedanstående optioner är köpoptioner. Terminen (Nov 2014) handlas i 194.25 euro per ton. En köpoption om ett ton vete, som ger rätt att köpa vete för 200 euro kostar 10.78 euro, eller 6% av 194.25 euro. När man köper optionen får man betala det beloppet (plus lite till för säljkurs, detta är senast betalt). Om priset i oktober (vid förfall) nästa år är 250 euro på terminen betalar banken 50 euro till optionsinnehavaren (omräknat till kronor om man vill och kommer överens om det). Om terminen står i 190 euro (under lösenpriset) förfaller optionen värdelös och inget belopp betalas ut.
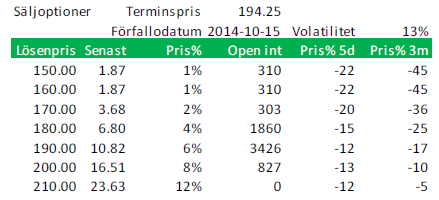
Nedanstående är priser på säljoptioner. Om du köpt optionen med lösenpris 200 euro (för 16.51) och terminen i oktober nästa år står i 180 euro, betalar banken ut 20 euro. Om terminspriset är över 200 euro betalar banken inte ut någonting alls och optionen förfaller värdelös.
En del använder optioner för att spekulera kortsiktigt. Som du ser av kolumnen Pris% 5d, som visar den procentuella prisförändringen på respektive option, rör sig priser på optioner med en väsentlig utväxling i förhållande till förändringar i terminspriset.
Vi har alltså köprekommendation på vete, men tror att en rekyl nedåt kan komma. Vi betraktar en sådan rekyl nedåt som ett köptillfälle.
Maltkorn
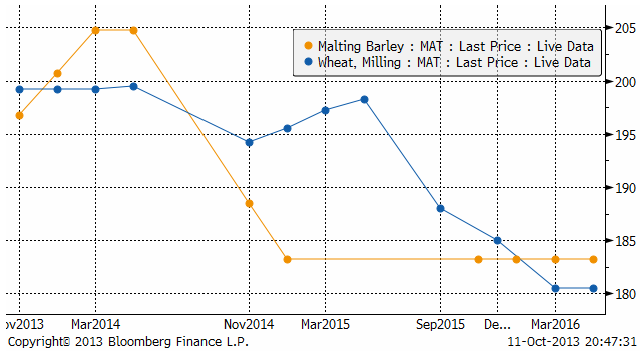
Terminspriset (november) ligger återigen under Matif:s kvarnvetekontrakt för november.
Som vi ser av diagrammet nedan, ligger novembers maltkornskontrakt under vetet, men januari, mars och maj ligger alla över. Det indikerar ett ”överutbud” av maltkorn just nu och / eller en brist på kvarnvete.
Majs
Majspriset (december 2013) har fortsatt att falla. Nyhetsflödet har gett bränsle åt nedgången: Dels har siffrorna på väntad skörd per acre i USA fortsatt att förbättras, dels har brasilianska CONAB estimerat landets skörd 2014 till 78 – 80 mt i veckan. Det ska jämföras med USDA:s senaste estimat på 72 mt. Tidigare rapporter indikerade också lägre sådd av majs och motsvarande mer av sojabönor. Även på efterfrågesidan har negativ information kommit. Amerikanska EPA väntas sänka inblandningsmandatet av etanol i bensin med 1.4 miljarder gallons, vilket leder till en minskad efterfrågan på majs med upp till 500 miljoner bushels. Efterfrågan till etanol har inte ökat alls de senaste åren, efter att man kommit upp i 10% (”blending wall”) etanol.
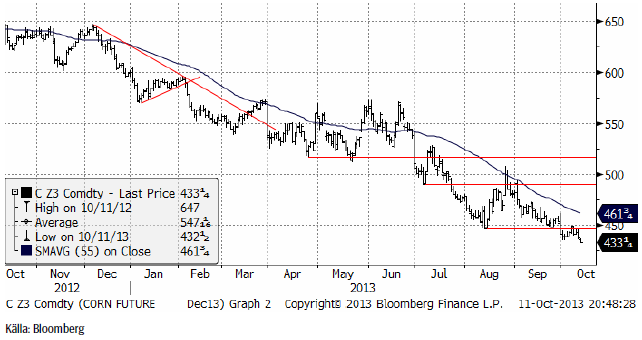
Det är oroväckande att majsen handlats så svagt, men vi tror ändå att priserna är nära botten och att förhållandet mellan sojabönor (oljeväxter) och majs (spannmål) leder till mindre produktion av majs – med högre pris i framtiden som konsekvens.
Vi väljer att hålla fast vid köprekommendationen.
Sojabönor
Novemberkontraktet på sojabönor slutade förra veckan med ett rejält prisfall. Priset närmar sig den nivå på 1250 som vi talade om för några veckor sedan. Bakom fredagens prisfall låg samma faktor som bakom prisfallet i majsmarknaden – en oro för att EPA ska komma att sänka inblandningskravet avseende biobränslen, i fallet för sojabönor gällde det biodiesel.
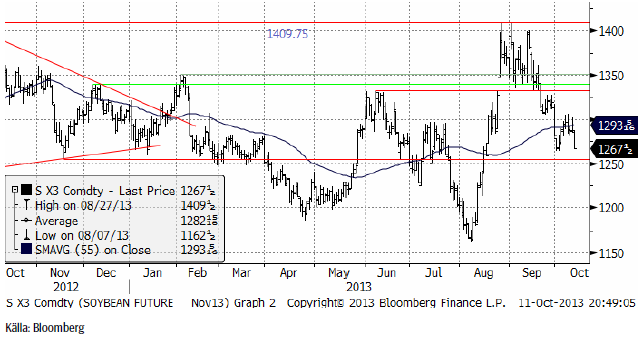
Brasilianska CONAB estimerar landets skörd 2014 till 87.6 – 89.7 mt. Det är något högre än USDA:s 88 mt.
I USA talar en del nu, något oväntat, om en skörd på 43 bushels per acre. Efter torkan i augusti har marknaden tagit emot en serie av estimat från privata firmor och analytiker som visar på bättre skörd än befarat.
Vi behåller säljrekommendation.
Raps
Rapspriset (november 2013) fortsatte att stiga i början av förra veckan efter beskedet om att en strafftull kommer att införas mot 90% av EU:s import av biodiesel. Den här frågan var ”snackisen” på European Exchange som gick av stapeln i Paris i torsdags och fredags. Samtalet rörde främst ”vem” som fått kännedom om beslutet innan det offentliggjordes.
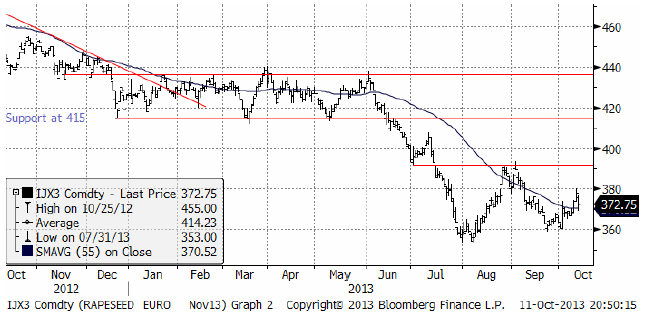
Vi behåller säljrekommendationen på raps.
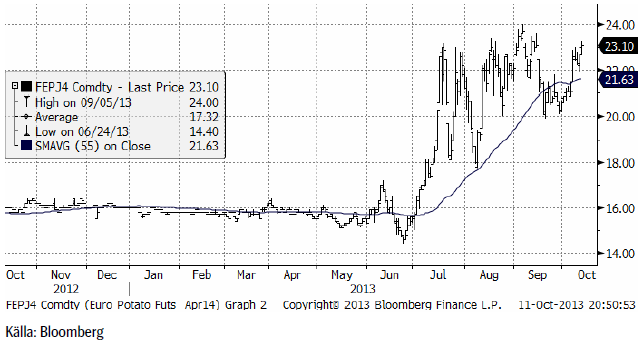
Potatis
Potatispriset av årets skörd, som handlas i april-kontraktet på Eurex, har vänt upp till den högsta nivån på en månad, en uppgång från början av oktober med 15%, till 23.10 euro per dt. 24 euro ser ut att vara inom räckhåll.
Gris
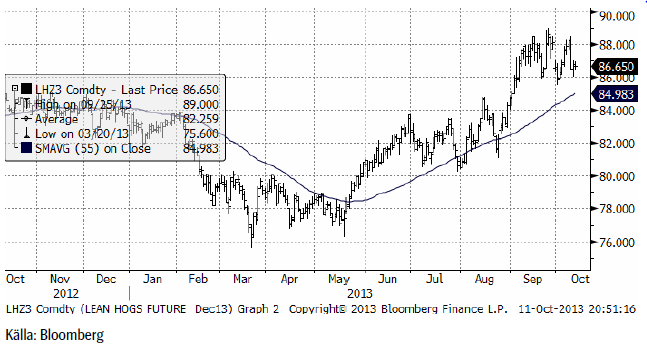
Prist på Lean Hogs fortsatta att röra sig ”sidledes” inom vad vi tolkar som en ”toppformation”, baserat på kända mönster inom den tekniska analys-skolan.
Mjölk
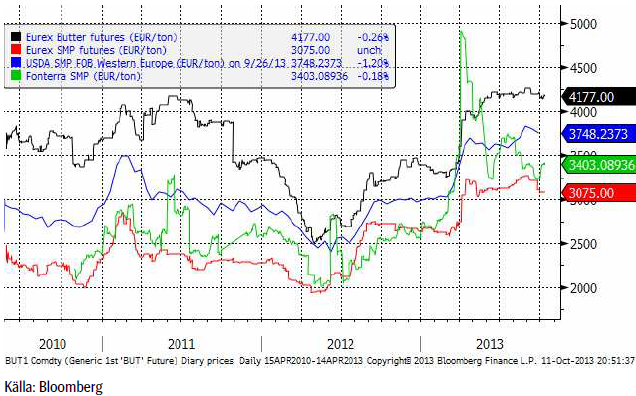
Terminerna på smör och skummjölkspulver vid Eurex-börsen var stabila och rörde sig inte mycket under veckan som gick. Fonterras pris steg något, efter det kraftiga prisfall från toppen som varit.
Socker
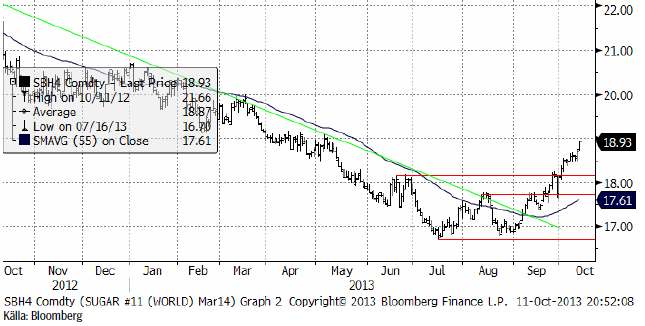
Marskontraktet på råsocker steg kraftigt upp till 18.93 cent på marskontraktet. Vid 19 cent finns ett starkt motstånd och det skulle inte förvåna om vinsthemtagningar sätter in, som kan ta ner priset till 18 cent. Vi tror att det, om det händer, är ett utmärkt köptillfälle.
Gödsel
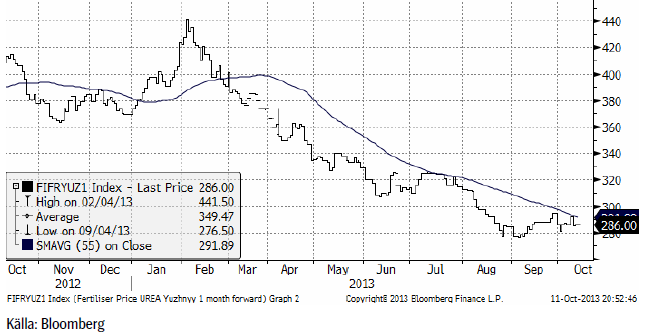
Priset på kväve / urea var stabilt i veckan som gick med endast små kursförändringar.
[box]SEB Veckobrev Jordbruksprodukter är producerat av SEB Commodities Sales desk och publiceras i samarbete och med tillstånd på Råvarumarknaden.se[/box]
Detta marknadsföringsmaterial, framtaget av SEB’s Commodities Sales desk, har upprättats enbart i informationssyfte.
Även om innehållet är baserat på källor som SEB bedömt som tillförlitliga ansvarar SEB inte för fel eller brister i informationen. Den utgör inte oberoende, objektiv investeringsanalys och skyddas därför inte av de bestämmelser som SEB har infört för att förebygga potentiella intressekonflikter. Yttranden från SEB’s Commodities Sales desk kan vara oförenliga med tidigare publicerat material från SEB, då den senare hänvisas uppmanas du att läsa den fullständiga rapporten innan någon åtgärd vidtas.
Dokumentationen utgör inte någon investeringsrådgivning och tillhandahålls till dig utan hänsyn till dina investeringsmål. Du uppmanas att självständigt bedöma och komplettera uppgifterna i denna dokumentation och att basera dina investeringsbeslut på material som bedöms erforderligt. Alla framåtblickande uttalanden, åsikter och förväntningar är föremål för risker, osäkerheter och andra faktorer och kan orsaka att det faktiska resultatet avviker väsentligt från det förväntade. Historisk avkastning är ingen garanti för framtida resultat. Detta dokument utgör inte ett erbjudande att teckna några värdepapper eller andra finansiella instrument. SEB svarar inte för förlust eller skada – direkt eller indirekt, eller av vad slag det vara må – som kan uppkomma till följd av användandet av detta material eller dess innehåll.
Observera att det kan förekomma att SEB, dess ledamöter, dess anställda eller dess moder- och/eller dotterbolag vid olika tillfällen innehar, har innehaft eller kommer att inneha aktier, positioner, rådgivningsuppdrag i samband med corporate finance-transaktioner, investment- eller merchantbankinguppdrag och/eller lån i de bolag/finansiella instrument som nämns i materialet.
Materialet är avsett för mottagaren, all spridning, distribuering mångfaldigande eller annan användning av detta meddelande får inte ske utan SEB:s medgivande. Oaktat detta får SEB tillåta omfördelning av materialet till utvald tredje part i enlighet med gällande avtal. Materialet får inte spridas till fysiska eller juridiska personer som är medborgare eller har hemvist i ett land där sådan spridning är otillåten enligt tillämplig lag eller annan bestämmelse.
Skandinaviska Enskilda Banken AB (publ) är ett [publikt] aktiebolag och står under tillsyn av Finansinspektionen samt de lokala finansiella tillsynsmyndigheter i varje jurisdiktionen där SEB har filial eller dotterbolag.

Market is starting to take US/Iran headlines with a pinch of salt. Brent crude rose $2.8/b yesterday to an official close of $112.1/b. But after that it traded as low as $108.05/b before ending late night at around $109.7/b. Through the day it traded in a range of $106.87 – 112.72/b amid a flurry of news or rumors from Iran and the US. ”US temporary sanctions during negotiations” (falls alarm). ”We will bomb Iran” (not anyhow),… etc. While the market is still fluctuating to this kind of news flow, it is starting to take such headlines with a pinch of salt.

We’ll see. Maybe, maybe not. The Brent M1 contract is trading at $110.2/b this morning which very close to the average ticks through yesterday of $110.4/b.
Trump with bearish, verbal intervention whenever Brent trades above $110/b it seems. What seems to be a pattern is that Trump states something like ”very good negotiations going on with Iran”, ”New leaders in Iran are great,..”, ”Great progress in negotiations,…”, ”Deal in sight,..” etc whenever the Brent M1 contract trades above $110/b. An effort to cool the market. These hot air verbal interventions from Trump used to have a heavy bearish impact on prices, but they now seems to have less and less effect unless they are backed by reality.
As far as we can see there has been no real progress in the negotiations between the US and Iran with both sides still standing by their previous demands.
Iran is getting stronger while the cease fire lasts making a return to war for Trump yet harder. Iran is naturally in constant preparation for a return to war given Trump’s steady threats of bombing Iran again. Iran is naturally doing what ever is possible to prepare for a return to war. And every day the cease fire lasts it is better prepared. This naturally makes it more and more difficult and dangerous for the US to return to warring activity versus Iran as the consequences for energy infrastructure in the Persian Gulf will be more and more severe the longer the cease fire lasts. Israel seems to see it this way as well. That the war is not won and that current frozen state of a cease fire gives Iran opportunity to rebuild military and politically.
Global inventories are drawing down day by day. How much? In the meantime the Strait of Hormuz stays closed. There is varying measures and estimates of how much global inventories are drawing down. Our rough estimate, back of the envelope, is that global inventories are drawing down by at least some 10 mb/d or about 300 mb/d in a balance between loss of supply versus demand destruction. Other estimates we see are a monthly draw of 250-270 mb/d. The IEA only ’measured’ a draw in global observable stocks of 117 mb in April with oil on water rising 53 mb while on shore stocks fell 170 mb. But global stocks are hard to measure with large invisible, unmeasured stocks. As such a back of the envelope approach may be better.
Oil products is what the world is consuming. Oil product prices likely to rise while product stocks fall. Strategic Petroleum Reserves (SPR) are predominantly crude oil. Discharging oil from OECD SPR stocks, a sharp reduction in Chinese crude imports and a reduction in global refinery throughput of 6-7 mb/d has helped to keep crude oil markets satisfactorily supplied. But global inventories are drawing down none the less. And oil products is really what the world is consuming. So if global refinery throughput stays subdued, then demand will eventually have to match the supply of oil products. The likely path forward this summer is a steady draw down in jet fuel, diesel and gasoline. Higher prices for these. Then, if possible, higher refinery throughput and higher usage of crude in response to very profitable refinery margins. And lastly sharper draw in crude stocks and higher prices for these. But some 6 mb/d of oil products used to be exported through the Strait of Hormuz. And it may not be so easy to ramp up refinery activity across the world to compensate. Especially as Ukraine continues to damage Russian refineries as well as Russian crude production and export facilities.
Watch oil product stocks and prices as well as Brent calendar 2027. What to watch for this summer is thus oil product inventories falling and oil product premiums to crude rising. Another measure to watch is the Brent crude 2027 contract as it rises steadily day by day as the Strait of Hormuz stays closed and global oil inventories decline. The latter is close to the highest level since the start of the war and keeps rising.
The Brent M1 contract and the Brent 2027 prices and current price of jet fuel in Europe (ARA). All in USD/b

Our back of the envelope calculation of the global shortage created by the closure of the Strait of Hormuz. Note that 3.5 mb/d of discharge from SPR is also a draw. Note also that ’Forced demand loss’ of 2.5 mb/d is probably temporary and will fall back towards zero as logistics are sorted out leaving ’Price demand loss’ to do the job of balancing the market. Thus a shortfall of at least 9 mb/d created by the closure. More if SPR discharge is included and more if Forced demand loss recedes.

Brent is climbing higher. Front-month is at USD 106.3/bl this morning, close to a weekly high and a USD 9/bl jump from Mondays open. This is the move we flagged as a risk earlier in the week: the market shifting from ”a deal is around the corner” to ”this is going to take longer than we thought”.

Analyst Commodities, SEB
During April, rest-of-year Brent remained remarkably stable around USD 90/bl. A stability which rested on one single assumption: the SoH reopens around 1 May. That assumption is now slowly falling apart.
As we highlighted yesterday: every week of delay beyond 1 May adds (theoretically) ish USD 5/bl to the rest-of-year average, as global inventories draw 100 million barrels per week. i.e., a mid-May reopening implies rest-of-year Brent closer to USD 100/bl, and anything pushing into June or July takes us meaningfully higher.
What’s changed in the last 48 hours:
#1: The US military has formally warned that clearing suspected sea mines from SoH could take up to six months. That is a completely different timescale from what the financial market is pricing. Even a political deal tomorrow does not immediately reopen the strait.
#2: Trump has shifted his tone from urgency to ”strategic patience”. In yesterday’s press conference: ”Don’t rush me… I want a great deal.” The market is reading this as a president no longer feeling pressured by timelines, with the naval blockade running in the background.
#3: So far, the military activity is escalating, not de-escalating. Axios reports Iran is laying more mines in SoH. The US 3rd carrier strike group (USS George H.W. Bush) is arriving with two countermine vessels. Trump yesterday ordered the US Navy to destroy any Iranian boats caught laying mines. While CNN reports that the Pentagon is actively drawing up plans to strike Iranian SoH capabilities and individual Iranian military leaders if the ceasefire collapses. i.e., NOT a attitude consistent with an imminent deal!
Spot crude and product prices eased off the early-April highs on a combination of system rerouting and deal optimism. Both now weakening. Goldman estimates April Gulf output is reduced by 14.5 mbl/d, or 57% of pre-war supply, a number that keeps getting worse the longer this drags on.
Demand-side adaptation is ongoing: S. Korea has cut its Middle East crude dependence from 69% to 56% by pulling more from the Americas and Africa, and Japan is kicking off a second round of SPR releases from 1 May. But SPRs are finite.
Ref. to the negotiations, we should not bet on speed. The current Iranian leadership is dominated by genuine hardliners willing to absorb economic pain and run the clock to extract concessions. That is not a setup for a rapid resolution. US/Israeli media briefings keep framing the delay as ”internal Iranian divisions”, the reality is more complicated and points toward weeks and months, not days.
Our point is that the complexity is large, and higher prices have only just started (given a scenario where the negotiations drag out in time). The market spent April leaning on the USD 90/bl rest-of-year assumption; that case is diminishing by the hour. If ”early May reopening” is replaced by ”June, July or later” over the next week or two, both crude and products have meaningful room to reprice higher from here. There is a high risk being short energy and betting on any immediate political resolution(!).
Down on Friday. Up on Monday. The Brent June crude oil contract traded down 5.1% last week to a close of $90.38/b. It reached a high of $103.87/b last Monday and a low of $86.09/b on Friday as Iran announced that the Strait of Hormuz was fully open for transit. That quickly changed over the weekend as the US upheld its blockade of Iranian oil exports while Iran naturally responded by closing the SoH again. The US blew a hole in the engine room of the Iranian ship TOUSKA and took custody of the ship on Sunday. Brent crude is up 5.6% this morning to $95.4/b.
The cease-fire is expiring tomorrow. The US has said it will send a delegation for a second round of negotiations in Islamabad in Pakistan. But Iran has for now rejected a second round of talks as it views US demands as unrealistic and excessive while the US is also blocking the Strait of Hormuz.
While Brent is up 5% this morning, the financial market is still very optimistic that progress will be made. That talks will continue and that the SoH will fully open by the start of May which is consistent with a rest-of-year average Brent crude oil price of around $90/b with the market now trading that balance at around $88/b.
Financial optimism vs. physical deterioration. We have a divergence where the financial market is trading negotiations, improvements and resolution while at the same time the physical market is deteriorating day by day. Physical oil flows remain constrained by disrupted flows, longer voyage times and elevated freight and insurance costs.
Financial markets are betting that a US/Iranian resolution will save us in time from violent shortages down the road. But every day that the SoH remains closed is bringing us closer to a potentially very painful point of shortages and much higher prices.
The US blockade is also a weapon of leverage against its European and Asian allies. When Iran closed the SoH it held the world economy as a hostage against the US. The US blockade of the SoH is of course blocking Iranian oil exports. But it is also an action of disruption directed towards Europe and Asia. The US has called for the rest of the world to engaged in the war with Iran: ”If you want oil from the Persian Gulf, then go and get it”. A risk is that the US plays brinkmanship with the global oil market directed towards its European and Asian allies and maybe even towards China to force them to engage and take part. Maybe unthinkable. But unthinkable has become the norm with Trump in the White House.


Sommarväder skapar prisrally på elbörsen
Oil product price pain is set to rise as the Strait of Hormuz stays closed into summer

Solkraften pressar elpriserna dagtid

Michel Gubel ger sin syn på oljemarknaden