

Analys
Oil price bottoming in Q1-19 seems like a fair bet

 Q1: When will pledged cuts by OPEC+ become visible in oil inventory data?
Q2: When will we see softer US oil production growth due to lower oil prices?
Q3: When will the global growth cooldown bottom out?
These are probably the key questions for when the oil price sell-off will bottom out as well. As of yet we have seen none of the above. US oil production continues to rise strongly while global growth continues to deteriorate.

Bjarne Schieldrop, Chief analyst commodities, SEB
The latest PMI’s in Asia have declined below the 50 line and thus into contractionary territory. The US EIA official October crude oil production came in at 11.537 m bl/d which is 177 k bl/d higher than what the EIA used for October in its latest monthly report. The EIA will likely have to lift its US production projection for 2019 accordingly.
During Q1-19 however we should probably see some positive effects of the cuts by OPEC+, some US oil rig count decline due to lower oil prices while the low point in bearishness over global growth will hopefully have bottomed out.
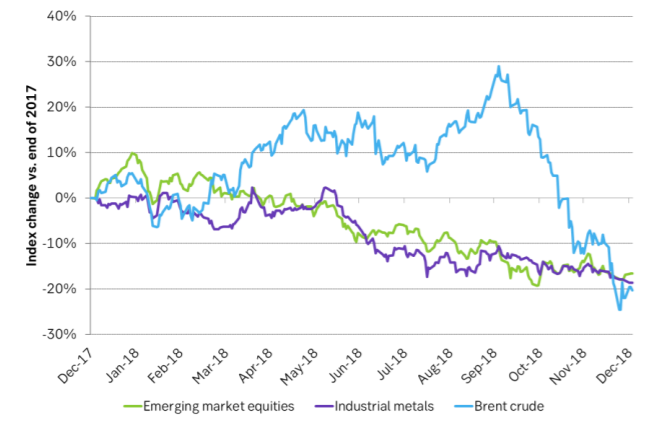
The front month Brent crude oil price declined 19.5% from end of 2017 to end of 2018 when it settled at $53.8/bl. Medium term oil prices however moved very little as the the rolling Brent crude 3yr contract only moved down 0.8% to $57.72/bl. It was of course not just oil prices which had a bad year in 2018. Industrial metals also sold off 18.6% along with emerging market equities which declined 16.6%.
The sell-off in crude oil in 2018 thus matches well with the overall sell-off in emerging market equities and industrial metals in 2018. Thus global economic cooldown in general and emerging market specifically seems to be a highly important factor for the oil price sell-off in 2018.
This brings us back to Q3 above: When will we see global growth cooldown bottom out? As we have seen with the latest PMI’s the signs are still pointing negative and lower. Data for US Q4-18 GDP is due on January 30th. This has the potential to be a real disappointment and could as such be the low point as it could change the direction of the Fed’s tightening monetary policy path.
Q1 above is a bit tricky. Firstly because the pledged cuts from OPEC+ are not so big that we expect to see a steep decline in inventories but rather inventory stabilization. Thirdly because there is typically a significant delay from cuts appears to when inventories are impacted and lastly because there is also a lag in the reporting of the OECD inventories of about two months. So when we get the IEA report in April we should have the OECD inventory data for February which then should hopefully show a good stabilization of inventories. Before that we have to contend with weekly inventory data which will be followed closely and which definitely can provide some positive news much earlier than the IEA reports in March and April.
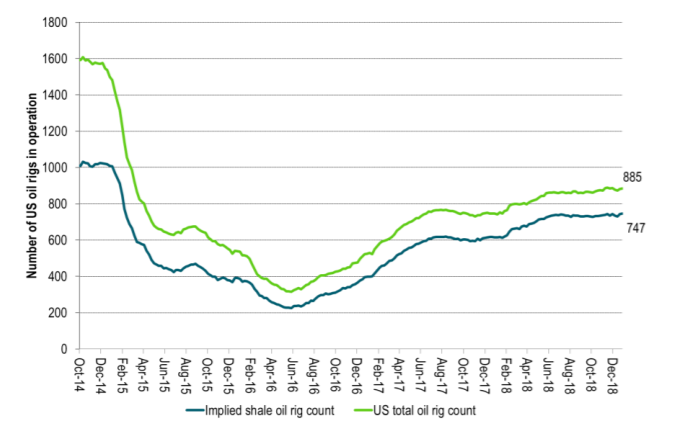
On Q2 above there have been a few US shale oil companies who have signalled that they will reduce activity/spending on drilling and completions in 2019 due to lower oil prices and we expect to see more of this. This has however not yet been reflected in a lower rig count or a lower level of well completions. During the previous “shale oil reset” the typical price inflection point was when the WTI 18 months forward crude contract moved above $45-47/bl. That was when the US shale oil rig count started to rise back in June 2016 however with a typical 6 week time lag versus the oil price. At the moment the WTI 18 mths contract trades at $48.8/bl and over the past 6 weeks it has averaged $52.2/bl. The comparable local Permian crude oil price does however trade some $5-6/bl lower with a proxy “Permian 18 mths contract” averaging $45/bl over the past 6 weeks. As such we could start to see weekly US oil rig count declines about now.
If we look ahead into Q1-19 we are likely to experience yet more negative headwinds for oil from the macroeconomic side potentially culminating with a bad Q4-18 US GDP report on 30 January. Some US oil rig count decline should materialize at current oil prices but the US EIA is likely to revise its projection for US 2019 crude production higher in its STEO report in January due to the latest October data. Inventory draws as a result of cuts by OPEC+ may not be so easily visible for a while but avoiding a steep inventory increase in H1-19 is what the market needs to see. A bottoming for the oil price during Q1-19 seems like a fair bet with higher oil prices thereafter.
Ch1: Lower oil prices have not yet started to drag US oil rig count lower. Current prices should lead to declines in Jan/Feb
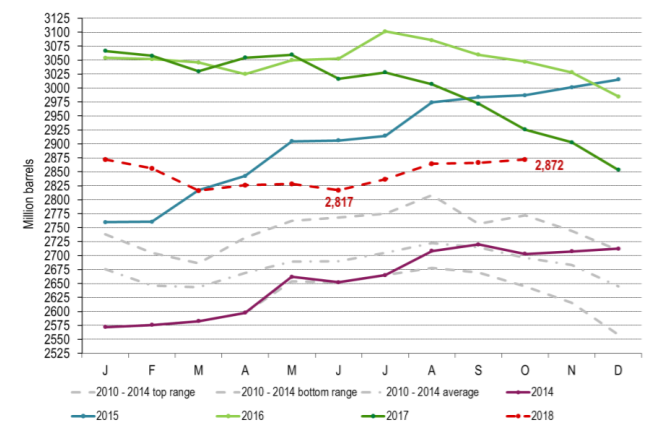
Ch2: OECD oil inventories with a two months lag. Cuts by OPEC+ starts in January. Inventory effects may be visible in weekly inventory data in Jan/Feb but we will not see OECD inventoris for Jan/Feb before IEA releases its monthly oil report in Mar/Apr. OECD inventories were probably close to unchanged from Dec-17 to Dec-18.
Ch3: Industrial metals, emerging market equities and oil were not so different after all. A turn to a more positive outlook for global growth in general and emerging markets specifically may be needed to push all of them higher again even though OPEC+ is lending a helping hand to the oil market through its cuts.
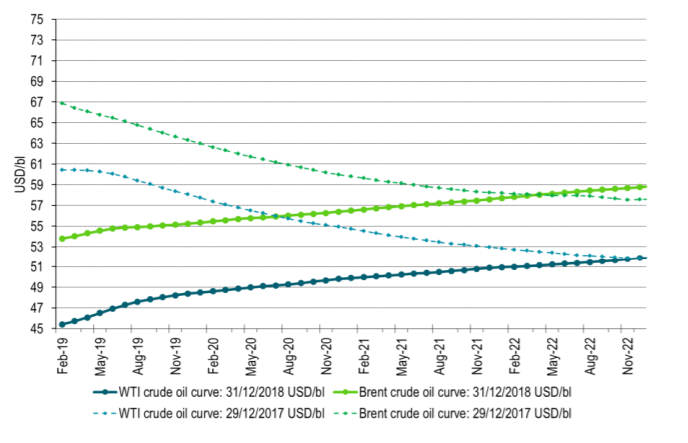
Ch4: Crude oil forward curves end of 2017 versus end of 2018. Difference is all in the front end of the curves. One year ago it was a tightening market, declining inventories and backwardation with speculators rolling into the market. Now it is contango, weakening global growth backdrop and slightly rising inventories and a huge exit of speculators from the market over the past 6 to 9 months. The longer term price anchor with Brent crude pegged around $60/bl is however intact. A flat, neutral oil market should thus maybe be around the $60/bl mark for Brent crude. Though with a question mark for the Brent to WTI crude oil price spread which may evaporate with new oil pipelines coming on-line in 2019/2020.
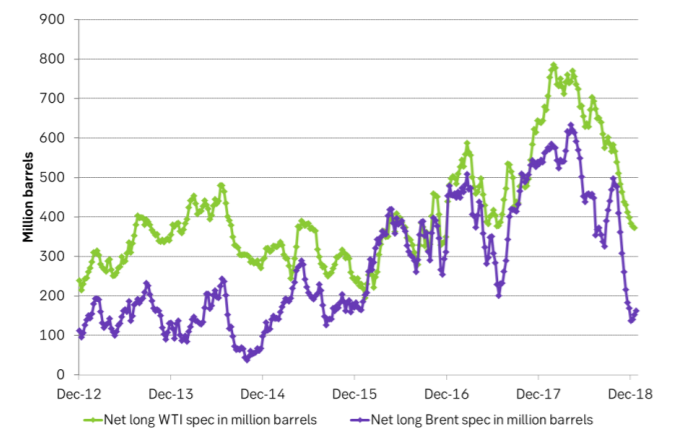
Ch5: Speculators will roll back into the market again at some point. Not a lot of net long spec in Brent crude at the moment.

The latest weekly report from the US DOE showed a substantial drawdown across key petroleum categories, adding more upside potential to the fundamental picture.

Commercial crude inventories (excl. SPR) fell by 5.8 million barrels, bringing total inventories down to 415.1 million barrels. Now sitting 11% below the five-year seasonal norm and placed in the lowest 2015-2022 range (see picture below).
Product inventories also tightened further last week. Gasoline inventories declined by 2.1 million barrels, with reductions seen in both finished gasoline and blending components. Current gasoline levels are about 3% below the five-year average for this time of year.
Among products, the most notable move came in diesel, where inventories dropped by almost 4.1 million barrels, deepening the deficit to around 20% below seasonal norms – continuing to underscore the persistent supply tightness in diesel markets.
The only area of inventory growth was in propane/propylene, which posted a significant 5.1-million-barrel build and now stands 9% above the five-year average.
Total commercial petroleum inventories (crude plus refined products) declined by 4.2 million barrels on the week, reinforcing the overall tightening of US crude and products.


A classic case of “buy the rumor, sell the news” played out in oil markets, as Brent crude has dropped sharply – down nearly USD 10 per barrel since yesterday evening – following Iran’s retaliatory strike on a U.S. air base in Qatar. The immediate reaction was: “That was it?” The strike followed a carefully calibrated, non-escalatory playbook, avoiding direct threats to energy infrastructure or disruption of shipping through the Strait of Hormuz – thus calming worst-case fears.
After Monday morning’s sharp spike to USD 81.4 per barrel, triggered by the U.S. bombing of Iranian nuclear facilities, oil prices drifted sideways in anticipation of a potential Iranian response. That response came with advance warning and caused limited physical damage. Early this morning, both the U.S. President and Iranian state media announced a ceasefire, effectively placing a lid on the immediate conflict risk – at least for now.
As a result, Brent crude has now fallen by a total of USD 12 from Monday’s peak, currently trading around USD 69 per barrel.
Looking beyond geopolitics, the market will now shift its focus to the upcoming OPEC+ meeting in early July. Saudi Arabia’s decision to increase output earlier this year – despite falling prices – has drawn renewed attention considering recent developments. Some suggest this was a response to U.S. pressure to offset potential Iranian supply losses.
However, consensus is that the move was driven more by internal OPEC+ dynamics. After years of curbing production to support prices, Riyadh had grown frustrated with quota-busting by several members (notably Kazakhstan). With Saudi Arabia cutting up to 2 million barrels per day – roughly 2% of global supply – returns were diminishing, and the risk of losing market share was rising. The production increase is widely seen as an effort to reassert leadership and restore discipline within the group.
That said, the FT recently stated that, the Saudis remain wary of past missteps. In 2018, Riyadh ramped up output at Trump’s request ahead of Iran sanctions, only to see prices collapse when the U.S. granted broad waivers – triggering oversupply. Officials have reportedly made it clear they don’t intend to repeat that mistake.
The recent visit by President Trump to Saudi Arabia, which included agreements on AI, defense, and nuclear cooperation, suggests a broader strategic alignment. This has fueled speculation about a quiet “pump-for-politics” deal behind recent production moves.
Looking ahead, oil prices have now retraced the entire rally sparked by the June 13 Israel–Iran escalation. This retreat provides more political and policy space for both the U.S. and Saudi Arabia. Specifically, it makes it easier for Riyadh to scale back its three recent production hikes of 411,000 barrels each, potentially returning to more moderate increases of 137,000 barrels for August and September.
In short: with no major loss of Iranian supply to the market, OPEC+ – led by Saudi Arabia – no longer needs to compensate for a disruption that hasn’t materialized, especially not to please the U.S. at the cost of its own market strategy. As the Saudis themselves have signaled, they are unlikely to repeat previous mistakes.
Conclusion: With Brent now in the high USD 60s, buying oil looks fundamentally justified. The geopolitical premium has deflated, but tensions between Israel and Iran remain unresolved – and the risk of missteps and renewed escalation still lingers. In fact, even this morning, reports have emerged of renewed missile fire despite the declared “truce.” The path forward may be calmer – but it is far from stable.
Analys
A muted price reaction. Market looks relaxed, but it is still on edge waiting for what Iran will do
Brent crossed the 80-line this morning but quickly fell back assigning limited probability for Iran choosing to close the Strait of Hormuz. Brent traded in a range of USD 70.56 – 79.04/b last week as the market fluctuated between ”Iran wants a deal” and ”US is about to attack Iran”. At the end of the week though, Donald Trump managed to convince markets (and probably also Iran) that he would make a decision within two weeks. I.e. no imminent attack. Previously when when he has talked about ”making a decision within two weeks” he has often ended up doing nothing in the end. The oil market relaxed as a result and the week ended at USD 77.01/b which is just USD 6/b above the year to date average of USD 71/b.

Brent jumped to USD 81.4/b this morning, the highest since mid-January, but then quickly fell back to a current price of USD 78.2/b which is only up 1.5% versus the close on Friday. As such the market is pricing a fairly low probability that Iran will actually close the Strait of Hormuz. Probably because it will hurt Iranian oil exports as well as the global oil market.
It was however all smoke and mirrors. Deception. The US attacked Iran on Saturday. The attack involved 125 warplanes, submarines and surface warships and 14 bunker buster bombs were dropped on Iranian nuclear sites including Fordow, Natanz and Isfahan. In response the Iranian Parliament voted in support of closing the Strait of Hormuz where some 17 mb of crude and products is transported to the global market every day plus significant volumes of LNG. This is however merely an advise to the Supreme leader Ayatollah Ali Khamenei and the Supreme National Security Council which sits with the final and actual decision.
No supply of oil is lost yet. It is about the risk of Iran closing the Strait of Hormuz or not. So far not a single drop of oil supply has been lost to the global market. The price at the moment is all about the assessed risk of loss of supply. Will Iran choose to choke of the Strait of Hormuz or not? That is the big question. It would be painful for US consumers, for Donald Trump’s voter base, for the global economy but also for Iran and its population which relies on oil exports and income from selling oil out of that Strait as well. As such it is not a no-brainer choice for Iran to close the Strait for oil exports. And looking at the il price this morning it is clear that the oil market doesn’t assign a very high probability of it happening. It is however probably well within the capability of Iran to close the Strait off with rockets, mines, air-drones and possibly sea-drones. Just look at how Ukraine has been able to control and damage the Russian Black Sea fleet.
What to do about the highly enriched uranium which has gone missing? While the US and Israel can celebrate their destruction of Iranian nuclear facilities they are also scratching their heads over what to do with the lost Iranian nuclear material. Iran had 408 kg of highly enriched uranium (IAEA). Almost weapons grade. Enough for some 10 nuclear warheads. It seems to have been transported out of Fordow before the attack this weekend.
The market is still on edge. USD 80-something/b seems sensible while we wait. The oil market reaction to this weekend’s events is very muted so far. The market is still on edge awaiting what Iran will do. Because Iran will do something. But what and when? An oil price of 80-something seems like a sensible level until something do happen.


Hur säkrar vi Sveriges tillgång till kritiska metaller och mineral i en ny geopolitisk verklighet?

Lundin Mining ska bli en av de tio största kopparproducenterna i världen

Sommarvädret styr elpriset i Sverige

Samtal om flera delar av råvarumarknaden
Tightening fundamentals – bullish inventories from DOE

Stor uppsida i Lappland Guldprospekterings aktie enligt analys
Silverpriset släpar efter guldets utveckling, har mer uppsida

Uppgången i oljepriset planade ut under helgen

Låga elpriser i sommar – men mellersta Sverige får en ökning

Mahvie Minerals växlar spår – satsar fullt ut på guld
-
 Nyheter4 veckor sedan
Stor uppsida i Lappland Guldprospekterings aktie enligt analys
-
 Nyheter4 veckor sedan
Silverpriset släpar efter guldets utveckling, har mer uppsida
-
 Nyheter3 veckor sedan
Uppgången i oljepriset planade ut under helgen
-
 Nyheter3 veckor sedan
Låga elpriser i sommar – men mellersta Sverige får en ökning
-
 Nyheter2 veckor sedan
Mahvie Minerals växlar spår – satsar fullt ut på guld
-
Analys3 veckor sedan
Very relaxed at USD 75/b. Risk barometer will likely fluctuate to higher levels with Brent into the 80ies or higher coming 2-3 weeks
-

 Nyheter1 vecka sedan
Oljan, guldet och marknadens oroande tystnad
-

 Nyheter1 vecka sedan
Jonas Lindvall är tillbaka med ett nytt oljebolag, Perthro, som ska börsnoteras