Nyheter
David Hargreaves on Precious Metals, week 5 2014

Gold tries and fails to break out upwards – RSA’s platinum looks bloody, but who cares? Silver remains the lame dog whilst the dollar sails on.
Platinum. The world auto industry is burgeoning. It takes over half of all PGMs in exhaust catalysts and over half of all that comes from South Africa. That country’s platinum mining sector has been tearing itself apart for over a year in a war which shows no sign of abating. So the platinum price should be sky high, eh? It is not. The mining companies are calling the bluff of the unions, the gold price is under pressure and the Pt/Au ratio, which has been at a premium for over a year, is on the slide. The mining companies saw this one coming. The big producers have stockpiles that should see them comfortably through an 8-week strike, by which time the union lads will either have acquiesced or resorted to violence. Have you noticed how they turn up ever carrying long sticks? Now the NUM has mostly settled, but newcomer AMCU is holding out. Everything to lose springs to mind. Settlements are up to 9% per year (plus benefits), guaranteed for three years.
WIM says: Here is a bit of arithmetic for the unions:
9% per year for 3 years is 1.295 x now.
In a labour intensive industry such as this, labour costs are up to 40% of total.
Wages come out of sales revenues. In most mines, total costs are pushing $1000/oz.
So labour = 40% x 1000 = $400/oz. If it rises by 1.295x in three years, that equates to $518/oz, an increase of $118.oz.
Most forecasters now see gold heading to $1000/oz and the Pt/Au premium going to level. Thus platinum at $1000/oz, too. Wages would thus be 518/1000=52% of total cost. Not tenable chaps. Heads will roll. Yours.
Gold. As long as the US Fed QE programme continues to shed $10 bn per month, we must not expect fireworks from the gold price. Particularly as the successor to Chairman B Bernanke has promised more of the same. 2013 output. GFMS tells us newly mined gold output worldwide in 2013 was 2982t, up 4% on 2012. This ties in with the trend of highgrading as the price fell. This is a relatively short-term expedient so unless some of the major pipeline projects see production, output will be under pressure.
WIM says: We are unlikely to see much change from the c.3000tpa newly mined figure in the near future. So it is to demand we look. As we note below, currencies are not playing a strong part in gold buying patterns with China and India to the fore. We learn (thanks Mineweb) that Chinese imports via Hong Kong were 1139t net in 2013, about 40% of newly mined total, but it was probably not all newly mined. It was a record tonnage. But China also imports from non-Hong Kong sources. Then add China’s domestically mined supplies of over 400t and we see the growing impact of that country. Add India’s import demand – good for at least 1000t despite the government clampdown – and we have to look at scrap recycling and de-stocking to balance the books. Now is India having second thoughts about the impact of gold imports on its balance of payments deficit? The government considers a 2% cut in the recently hiked levy of 10% as it sees the domestic jewellery industry (and thus exports) suffer. Credit Suisse has now joined the bottom-side $1000/oz lobby to which WIM subscribes, ventilating the usual reasons.
The argument continues as to whether people buy more gold, or indeed any commodity, in a rising or a falling market.
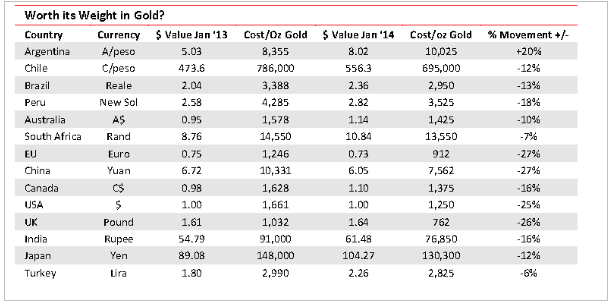
The comfort of a rising price is that you have possibly seen the bottom. Tied in with the emerging nations exchange rate crises we show here how various countries would have fared, buying an ounce of gold in their own currency, over the past year. Between January 2013 and 2014, the value of gold in US dollars fell c.25% from $1660 to $1250. Had you bought gold domestically at the start of that period and sold it at the end, here would have been the result:
Argentina -20%, South Africa +7%, Australia +10%, Japan +12%, Brazil +13%, India +16%, Peru +18%, Chile +12%, Canada +16%, UK +26%, EU +27%, China +27%.
Newmont (NEM.N $21.6; Hi-Lo $45.81-21.27) the third largest producer, did 5.1Moz in 2013, the top end of its forecast, plus 17,000t copper. It expects to maintain this in 2014. It also expects all-in sustaining costs of $1075- 1175/oz gold, a but close to the bone we feel.
Endeavour Mines (EDV.TSX A$0.67) operating four mines in four countries in West Africa, did a record 324,275 oz in 2013, but looks for a 35% uplift to 400,000-440,000 oz this year. It looks at all-in sustaining costs of c.$900/oz in 2014.

[hr]
About David Hargreaves


David Hargreaves
David Hargreaves is a mining engineer with over forty years of senior experience in the industry. After qualifying in coal mining he worked in the iron ore mines of Quebec and Northwest Ontario before diversifying into other bulk minerals including bauxite. He was Head of Research for stockbrokers James Capel in London from 1974 to 1977 and voted Mining Analyst of the year on three successive occasions.
Since forming his own metals broking and research company in 1977, he has successfully promoted and been a director of several public companies. He currently writes “The Week in Mining”, an incisive review of world mining events, for stockbrokers WH Ireland. David’s research pays particular attention to steel via the iron ore and coal supply industries. He is a Chartered Mining Engineer, Fellow of the Geological Society and the Institute of Mining, Minerals and Materials, and a Member of the Royal Institution. His textbook, “The World Index of Resources and Population” accurately predicted the exponential rise in demand for steel industry products.