Analys
Crude oil comment – Hard to be bullish for the coming 6 months


- Crude oil comment – Hard to be bullish for the coming 6 months
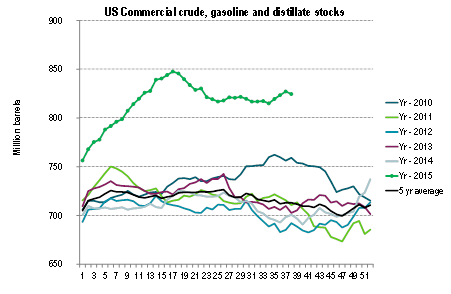
- Graph: US commercial crude and product stocks – on par with two years production from US frack log
- Graph: Less Brent crude 12mth contango lately, but mostly since longer dated contracts are falling
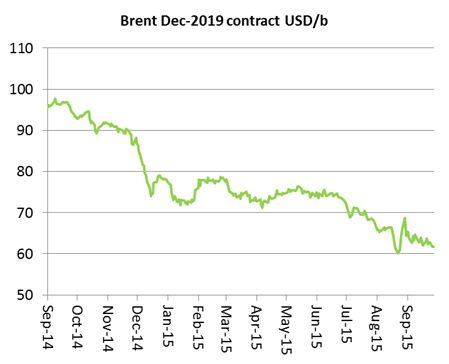
- Graph: The relentless decline of the Brent crude oil December 2019 contract
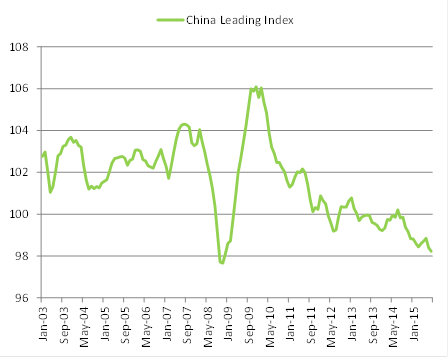
- Graph: China Leading Index inched yet lower to 98.23 and the lowest since 2009

Crude oil price action – Down and then back towards the $48/b converging point – for now
Brent crude oil traded down 2.6% yesterday to $47.34/b amid a broad based sell-off in European and US equities (-2.6%). Growth concerns for China (industrial profits down 8.8% y/y in August) and the close to 30% drop in Glencore shares helped to drive the bearish sentiment. Do note that Industrial metals only lost 1% so there was not really much of a shake-out in metals on the back of rising China concerns yesterday. Note that while Brent crude saw a percentage wise large drop yesterday, it did not stray too far from the $48/b line which has been a converging price point lately. Today Asia is in the red following the US from last night, but US equities are rebounding. Also Brent crude is rebounding today to $47.7/b and is closing in on the $48/b level again.
Crude oil comment – Hard to be bullish for the coming 6 months
It is difficult to be bullish for the coming 6 months. First out in October and November is the refining turnaround season where refineries now increasingly are taken off-line for maintenance and adjustments ahead of the Northern hemisphere winter season. As this happens more crude oil is left in the market as refineries are not consuming it. Chinese refineries are also projected to process some 250 kb/d to 400 kb/d less in Q4-15 than in Q3-15. At the same time crude oil production in the North Sea is increasing into October and may rise further in November and December, potentially to multi year high. While Q4 is normally a strong demand period of the year it also marks the entrance into demand weakness in Q1 and Q2. We are quite confident that OPEC will not trim its production at its December 4 meeting in Vienna. We are also quite confident that Iran will increase exports of crude oil in Q1 and Q2 as sanctions are lifted and that we overall will get yet another strong rise in global oil stocks in 1H-16. Global oil inventories are already very high with commercial OECD stocks up 272 mb y/y in July to 2972 mb. Of this the US account for 825 mb of crude, gasoline and distillates with a y/y rise of 124 mb (September). On top of this we have the so called US fracklog of drilled wells that have not yet been fracked and put into production. It is difficult to know the size of the fracklog exactly but one estimate places it at around 4500 wells. If we view the fracklog as a kind of oil storage, then 4500 wells amounts to around 800 mb of crude oil that can be put into the market over two years. In other words if all these 4500 wells were producing for two years they would yield some 800 mb of crude oil. After those two years comes the tail-production which will yield even more oil, but over quite a few years.
Counter to this however is the intensifying credit and liquidity situation for the many smaller US shale oil players which will lead to continued declining US crude oil production. Overall however there is limited risk to the upside with so much oil at hand in stocks around the world as well as the US fracklog. In a slightly longer perspective towards the end of 2016 deciding whether the market will be in surplus or deficit in Q4-16 is highly uncertain and will amongst other things depend highly on OPEC production. OPEC has increased production by between 1-2 mb/d this year with main contributors being Iraq and Saudi Arabia. While we expect increasing exports from Iran, it is highly uncertain whether we will see the same increase from Iraq and Saudi Arabia in 2016 as in 2015.
US commercial crude and product stocks – on par with two years production from US frack log
Two years of production from the US fracklog of yet unfracked, but drilled wells will yield crude oil in a magnitude of the current US commercial oil inventories.

Less Brent crude 12mth contango lately, but mostly since longer dated contracts are falling
A key factor here is however that this is not so much to do with strengthening in the front end of the curve, but more to do with a relentless decline in longer dated contracts.


The relentless decline of the Brent crude oil December 2019 contract
The front end of the Brent crude oil curve seems to be very well supported at the $48/b level for the time being. However as the longer dated contracts like the Dec-19 contract ticks lower and lower it forces the curve to be flatter with less contango. If stocks are to increase yet further, which is our base case into 1H-16, an increase in the contango will however be needed. If the longer dated contracts continue to push lower or just stay steady at current level, then the front end contract will need to move lower in order to create the necessary contango to hold increasing storage. At the moment we expect the longer dated contracts to continue lower as producers need to hedge out on the curve while consumer will preferred to purchase oil more towards the front end of the curve in order to utilize contango and low spot crude oil prices.

And then one last graph for the China bears. The China Leading Index inched yet lower to 98.23 and the lowest level since 2009.
Watch out for China PMI manufacturing and services index on Thursday this week.

Bjarne Schieldrop
Chief analyst, Commodities
SEB Markets
Merchant Banking