Analys
US shale oil update – More rigs, higher productivity and net production about to break higher


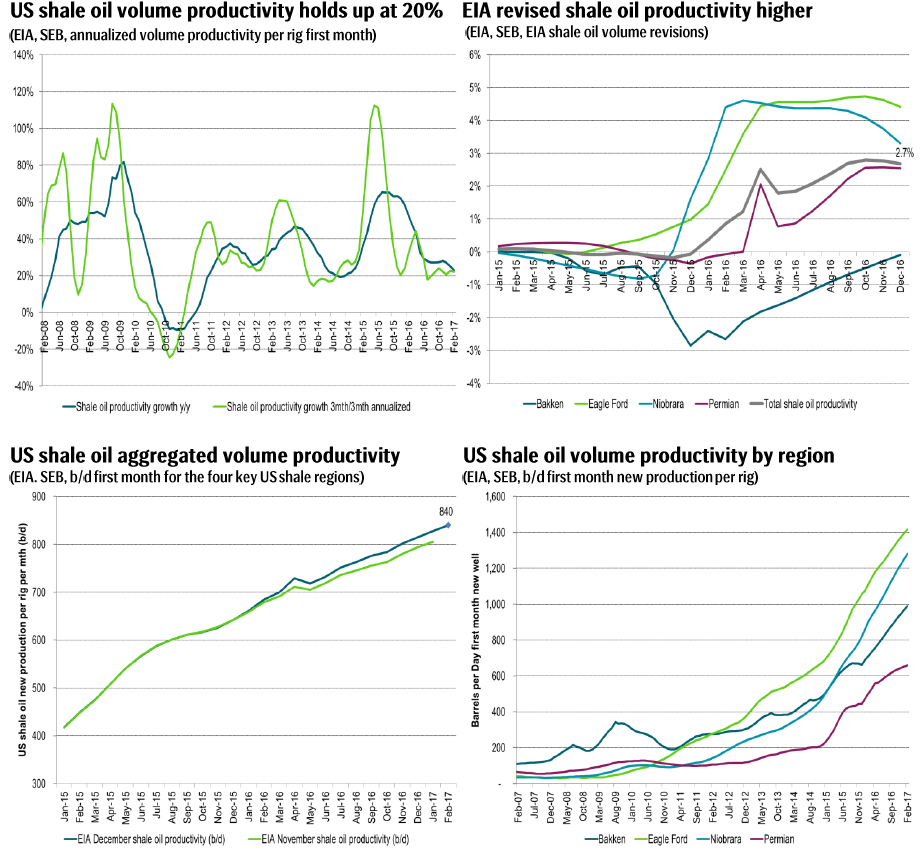
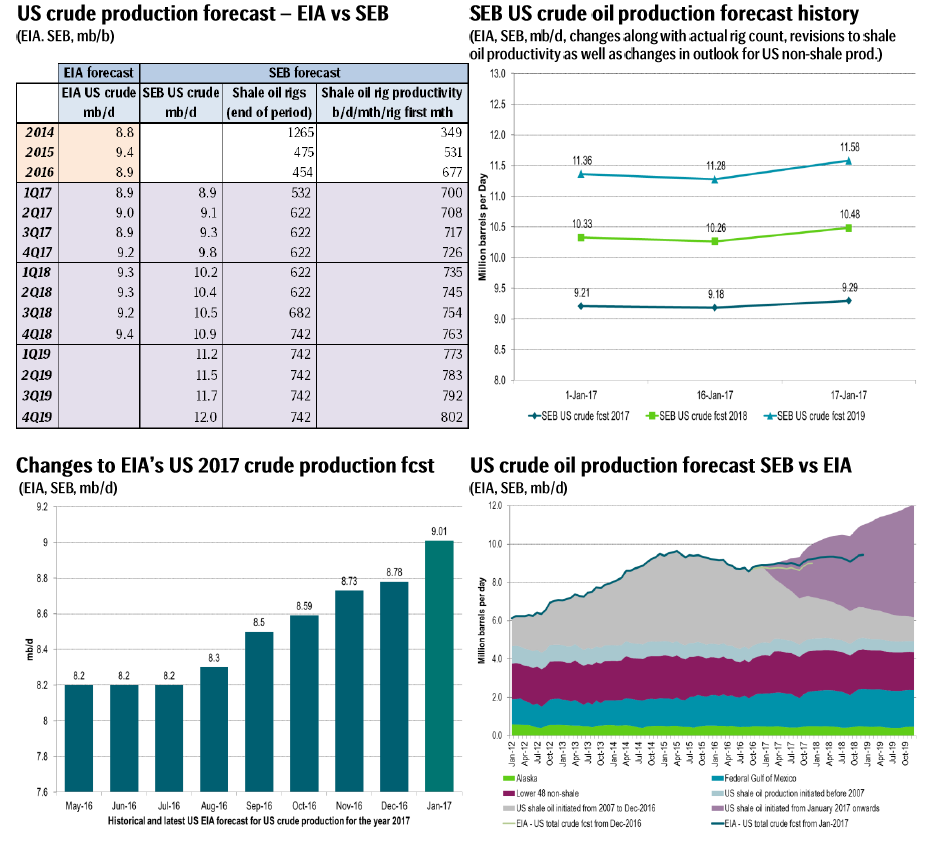
The higher productivity and rig count lifted our total US crude oil production forecast as follows:
2017: 9.29 mb/d (+109 kb/d)
2018: 10.48 mb/d (+221 kb/d)
2019: 11.58 mb/d (+303 kb/d)
Our forecast for US crude oil production will naturally be changing along with constant updates in actual rig counts versus projected once as well as revisions to volume productivity.
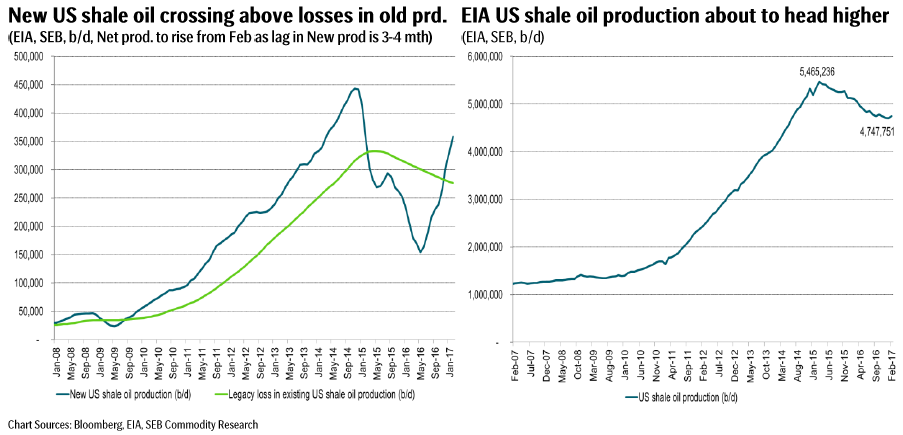
Besides the still continued solid 20% pa rise in volume productivity what also became very clear from the report is that US shale oil production is on the verge of breaking higher. When US shale oil production peaked in Mar 2015 at 5.46 mb/d it started to head downwards as if the line had been broken off. It was no soft turnaround. The turnaround was abrupt as new production each month broke below the running losses in already existing US shale oil production. To some degree this is now likely to happen in reverse. As shown in the graph below: “New US shale oil crossing above losses in old prd.”, the rise in newly initiated US shale oil production is now about to break straight up through the level of gradually declining legacy losses. As such the net increase in US shale oil production which has headed downwards in a pretty straight line since Mar 2015 is now likely going to head upwards in a pretty straight line instead.
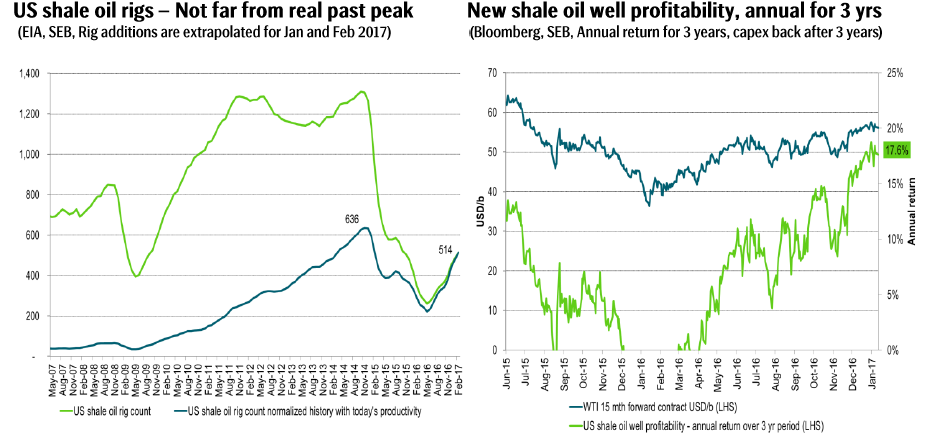
If we extrapolate monthly rig additions seen this autumn (about +30 rigs per month) for January and February we’ll have a US shale oil rig count standing at 514 rigs at the end of February. If we then productivity adjust the historical rig count we see that the rig count at the end of February this year will only be 122 rigs shy of the prior peak of 636 rigs (in real terms versus today’s rig productivity).
Selected Graphs