Analys
US shale oil rigs keeps rolling in (oil price not yet low enough to reverse the inflow)

Crude oil price action – A marginal rebound this morning before selling down further


Further, what has now become entirely clear is that cutting production makes little sense as long as US drillers keeps adding +30 rigs each month.
Crude oil comment – US shale oil rigs keeps rolling in (oil price not yet low enough to reverse the inflow)
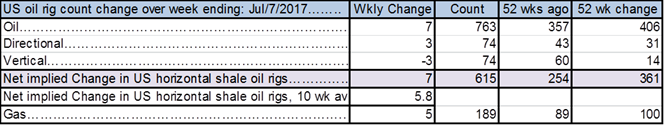
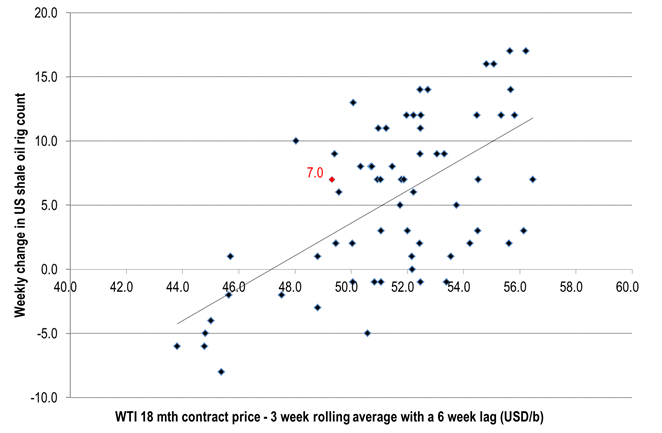
The number of US oil rigs rose by 7 last week and also by 7 for implied shale oil rigs. That is above the 10 week average of 5.8 rigs/week. The weekly average since start of June 2016 is 6.7 rigs/wk. There is typically a 6 week lag from price action to rig count change reaction. Six weeks ago the 18mth forward WTI price stood at around $49 – 50/b and thus above the $45-47/b empirical inflection point from one year ago (the price level where oil rigs neither increase nor decrease). Thus naturally rigs keep flowing into market. I.e. the oil price and the forward WTI crude curve were still too high six weeks ago.
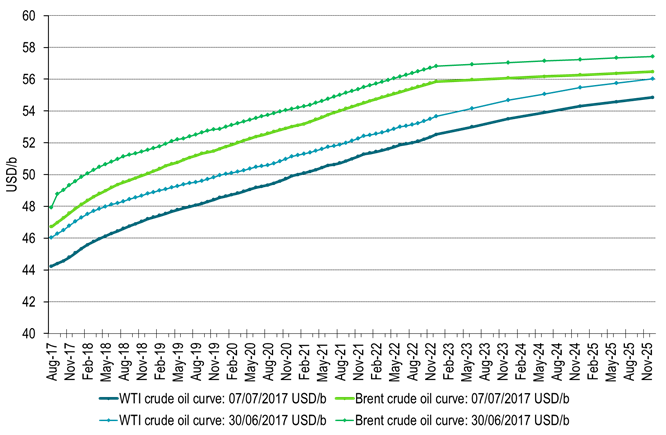
The WTI 18 mth on Friday closed at $47.3/b and thus just touching down to the inflection point (empirical value from one year ago)
US oil rig inflow has not yet stopped and continues to flow into the market at a solid, steady rate as of yet.
The oil price needs to move lower in order to stem the inflow.
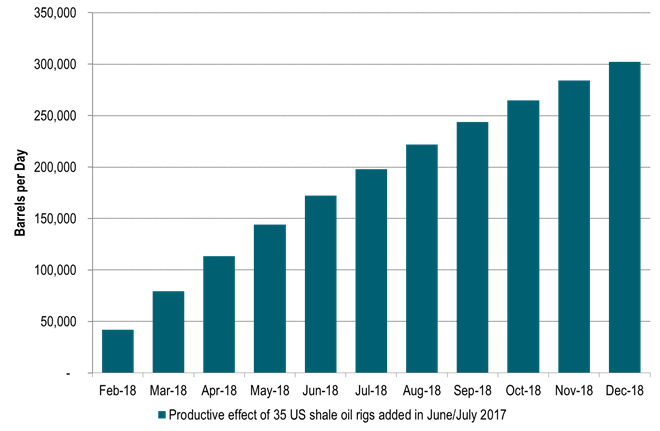
Over the past six weeks 35 shale oil rigs were added into active operation. So what is the productive impact of these extra 35 rigs? Our estimate is that today each active rig will lead to about 1200 b/d/mth of new production in a combination of [wells/rig/month] and [barrels/well/day/mth1]. That is 42,000 b/d/mth of new production for the 35 rigs. Today we assume a lag from rig activation to first oil of some 8 months due to pad drilling practice. The 35 rigs added over the past 6 weeks will thus be hitting the market with production in January/February 2018. From then onwards well will be stacked on well month after month. The staggering calculation is that by the end of 2018 these 35 rigs will add some 300 kb/d of production when the production of all these wells is stacked on top of each other (assuming 60% well production decline after 12mths).
Tomorrow the US EIA will release its monthly Short Term Energy Outlook (STEO) with a forecast stretching to end of 2019. The EIA has been lagging and under estimating US crude production consistently over the past year. As such they have revised US production forecast up, up, up every month with respect to 2017 and 2018 forecasts. Today their 2017 forecast is probably mostly correct. Their forecasts for 2018 and 2019 are however in our view hugely under estimated. As such we expect them to continue to revise their US crude production forecasts higher and that this will also be part of their message tomorrow at 1800 CET.
Table 1: US oil rig count up by 7 last week

Ch1: US shale oil rig count change versus oil prices 6 weeks ago

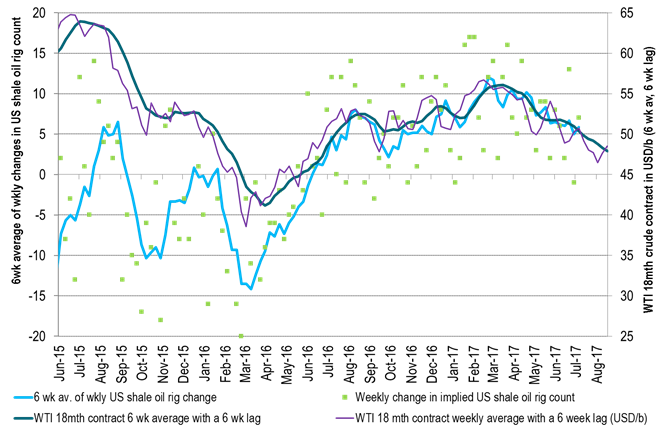
Ch2: As oil prices have a lagging impact we expect oil rigs to continue flowing into the market until late August

Ch3: Productive effect of the 35 shale oil rigs added last six weeks: +300 kb/d in December 2018
Assuming 1200 b/d/rig/mth1 and a well production decline of 60% after 12 mths

Ch4: The official US drilling productivity probably under estimates real productivity by some 40% to 60%
This is what we find when we combine wells/rig/mth with barrels/day/well/mth1
When the US EIA adjust for this in their models it should have a dramatic effect on their US oil production forecast.
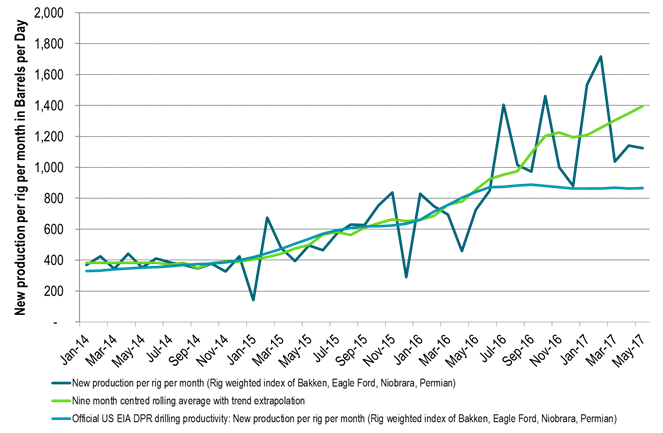

Table2: Solid draw in inventories in last week’s data
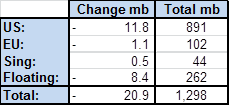

Ch5: Inventories in weekly data back on track for decline – more to come in H2-17
At the moment the market doesn’t care.
The effect should be a tightening of the time spreads at the front end of the crude curve 1 to 3 mths and 1 to 18 months.
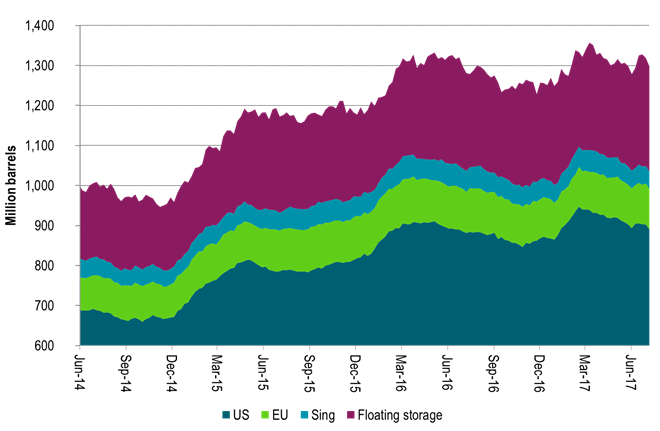
Ch6: WTI net long speculative positions slightly higher last week
Net long position still to the high side of neutral

Ch7: Crude forward curves close on Friday and one week ago
Kind regards
Bjarne Schieldrop
Chief analyst, Commodities
SEB Markets
Merchant Banking