Analys
Towards the end of the sell-off. No business below USD 70/bl


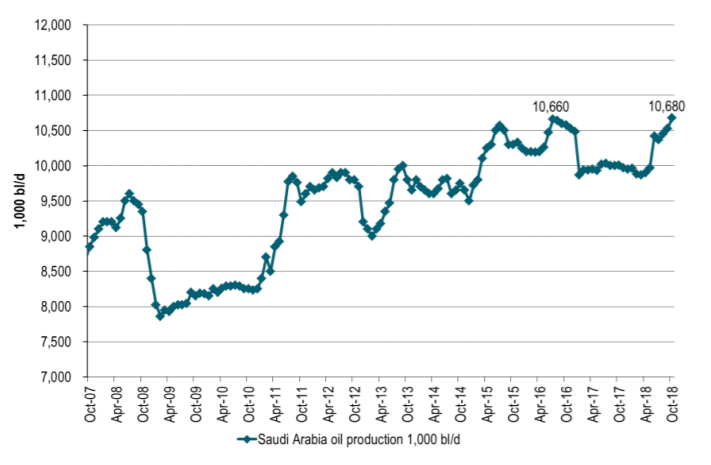
By then the speculative driven sell-off centred on US stock building will have come to an end. Iran oil sanctions will increasingly start to show in global inventory draw down in the second half of November. The normal seasonal November dollar rally will start to fade. Saudi Arabia will no longer need to pay tribute to Donald Trump’s whish for a lower oil price leading up to the US mid-term election (on Nov 6). We expect Saudi Arabia or a proxy of Saudi through some of its allies to verbally intervene in the oil market shortly after US mid-term painting a clear picture that: “Brent crude has NO business below USD 70/bl. Saudi Arabia produced at the highest level ever of 10.68 m bl/d in October and will undoubtedly pull back as needed to keep Brent above the USD 70/bl line. A brief visit to high USD 60ies/bl is of course possible on the back of normal market fluctuations. Do take note that US + EU + Sing + Floating weekly data have drawn down strongly over the past three weeks. In total 37 m bl.


Bjarne Schieldrop, Chief analyst commodities
Speculative positions (Brent + WTI) declined by 73 million barrels over the week to last Tuesday and have on average declined by 62 m bl/week over the past five weeks since the start of October. That IS the sell-off.
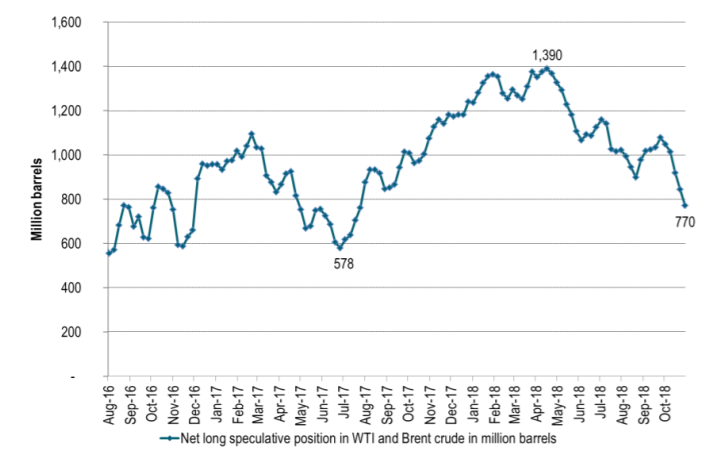
Net long speculative positions stood at 770 m bl Tuesday last week. That is almost down 50% since the peak of 1390 m bl in mid-April. Net longs probably continued lower in the second part of last week as crude sold off further.
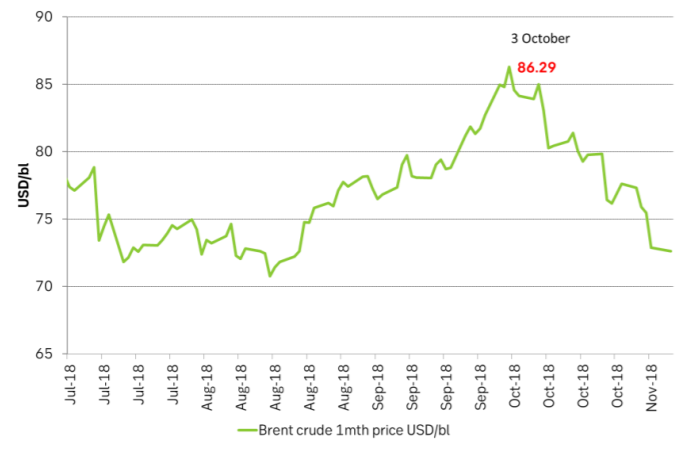
The sell-off since the start of October has been centred on US stock building where crude stocks have increased by 5.3 m bl/week on average over six consecutive weeks since late September. This due to two things: 1) Normal seasonal stock building and 2) Maxed out pipeline capacity to the US Gulf leading to backed up stocks in the US.
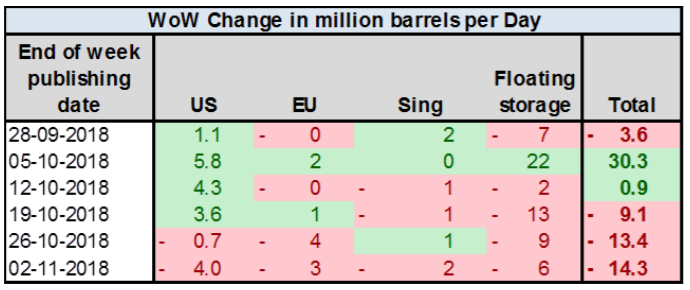
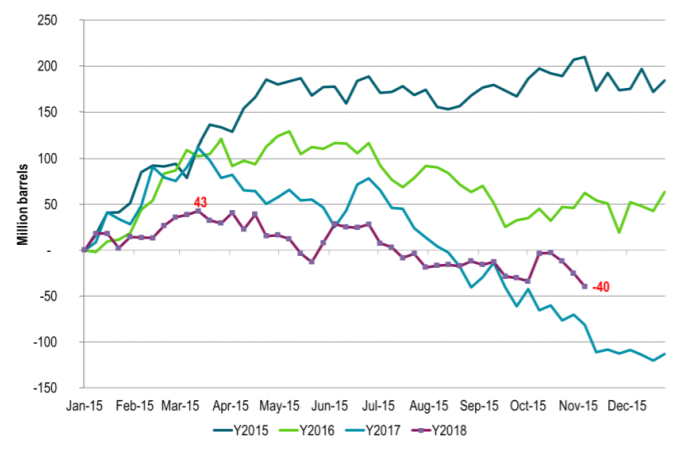
Weekly stock data for US + EU + Sing + Floating (table 1 below) have declined strongly over the past three weeks and are now down 40 m bl year to date.
Table 1: Weekly inventories have drawn down strongly last three weeks (US + EU + Sing + Float)

Ch1: Weekly inventories have drawn down strongly last three weeks (US + EU + Sing + Float)

Ch2: Brent crude sell-off started in early October. Just when US stocks started to rise

Ch3: Saudi Arabia at all-time-high in October. Saudi can easily reduce production a little to maintain USD 70/bl. Even with this high production by Saudi Arabia in October the weekly inventory data have been drawing down strongly over the past three weeks!

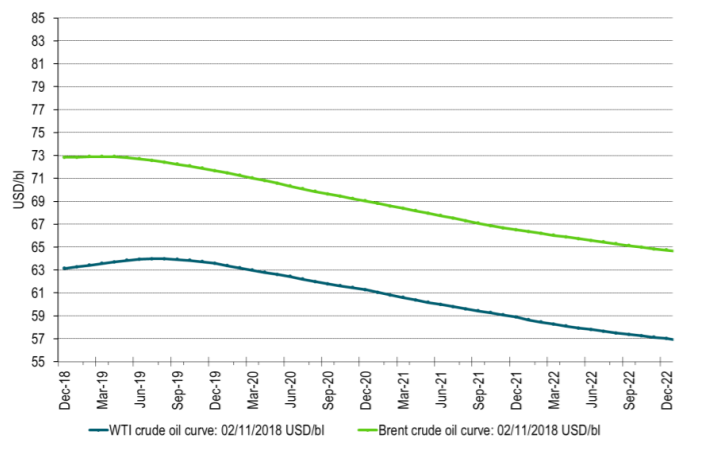
Ch4: The WTI crude curve has been pushed into contango due to US crude stock building. The Brent crude oil curve has been pulled lower by the WTI curve. Hey Brent, show some spine!

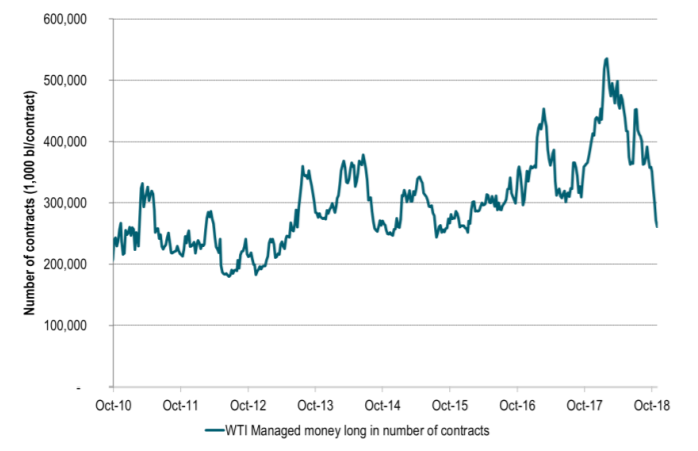
Ch5: Managed money WTI long (just long, not net-long) positions are now the lowest since January 2016

Ch6: Net long Brent + WTI in million barrels at lowest since July 2017