Analys
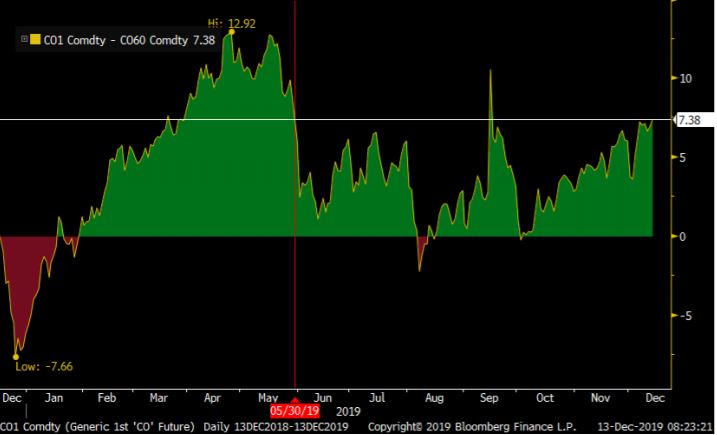
The strongest Brent crude oil curve since May-2019


Baring the attack on Saudi Arabia in September which spiked the front-end of the Brent crude oil curve up to $71.95/bl for a moment and thus pushed the Brent curve into steep backwardation for a short period, we now have the strongest Brent crude oil curve since the end of May 2019. The Brent front month contract now trades at a $7.4/bl premium over the 5-year contract which is the highest level since late May.


The Since a low-point at the start of October the Brent crude oil curve has just become stronger and stronger by the day. This coincides nicely with the rebound (following a long, long decline) in the global manufacturing PMI. This is undoubtedly leading to a rebound in global oil demand growth as well or at least the end of the deterioration. It also fits well with the fact that we are now sailing right into the long-heralded IMO-2020 event which technically has a tightening effect on the global oil market. There has been much fear for a large H1-2020 oil market surplus, but OPEC has now largely eradicated that from happening. It’s anyhow predicted to be a temporary issue with a balanced marked again in H2-2020. Temporary supply gluts are easy to handle for OPEC if they choose to.
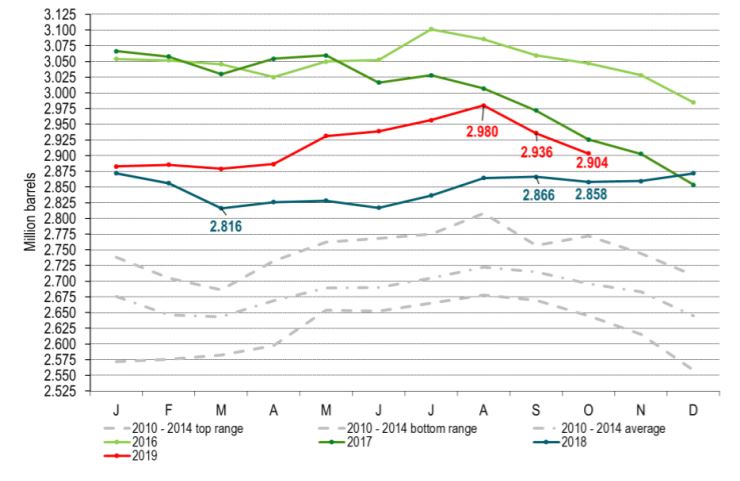
The IEA was out with its monthly Oil Market Report this week. Notable was that OECD inventories declined at the fastest pace in Sep and Oct since 2017 with crude oil inventories only 5 m barrels above last October. “Other products” (probably NGL) rose by 25 m barrels since last year.
Another notable thing was that non-OECD oil product demand rose by 1.3 m bl/d YoY to October. OECD demand declined 0.1 m bl/d YoY to October. In terms of OECD there is one very important issue. Gasoline, Jet, Diesel and LPG together grew by +0.6 m bl/d YoY to October with the first three of these growing on average 1% YoY. That is very strong. The weakness was again in the “Other” category which declined by 0.6 m bl/d YoY. So OECD demand growth weakness was in the unspecified “other” category while demand growth was solid also in the OECD region for the classic liquids.
Now add the ingredient of a large win for Boris Johnson and an “almost there” for the US – China trade war and up we go for Brent crude.
OPEC will hold the market through a potential surplus in H1-2020. Oil demand growth will likely rebound along with a rebound in global manufacturing. IMO-2020 adds strength to the oil market in H1-2020. US shale oil is probably slowing down faster than projected.
Ch1: OECD inventories by IEA falling the fastest since 2017

Ch2: The Brent crude curve has the strongest structure since late May 2019 baring the event of the attack on Saudi Arabia. Graph showing Brent 1mth contract minus the 5 year contract.