Analys
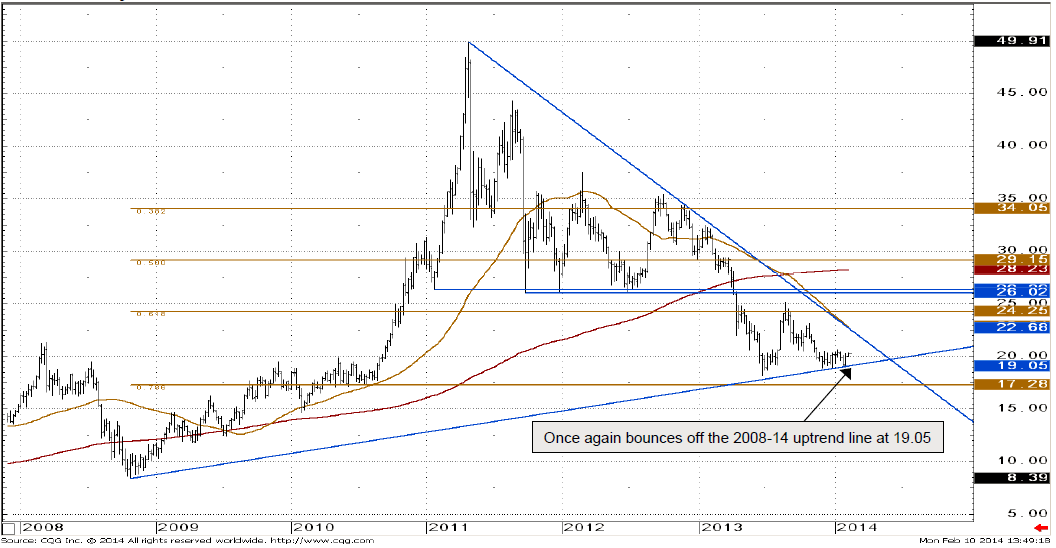
Silver is expected to retest key resistance


Is expected to retest key resistance at 20.49/65, a rise above which will eye 21.17 and above.
Silver Daily Chart
- The silver price slipped to 18.99 in late January from where it reversed its short term trend and broke through the 2012- 14 resistance line at 19.82 last week.
- The precious metal is thus back on track to reach the 20.49/65 major resistance zone, made up of the October lows and December peak as well as July highs.
- Were it to be breached on a daily chart closing basis, we would change our forecast to a bullish one with the 200 day moving average and the 38.2% Fibonacci retracement of the August-to-December descent at 21.17/24 being eyed. Over the coming weeks the 23.12 October peak would then also be targeted.
- While no daily chart close above 20.65 is made, though, we will retain our neutral outlook. The same applies to no drop below the December low at 18.82 being seen. Failure at 18.82 would open the way up for the June and July lows at 18.69 and 18.19 to be reached and make us bearish again.


Silver – Weekly Chart
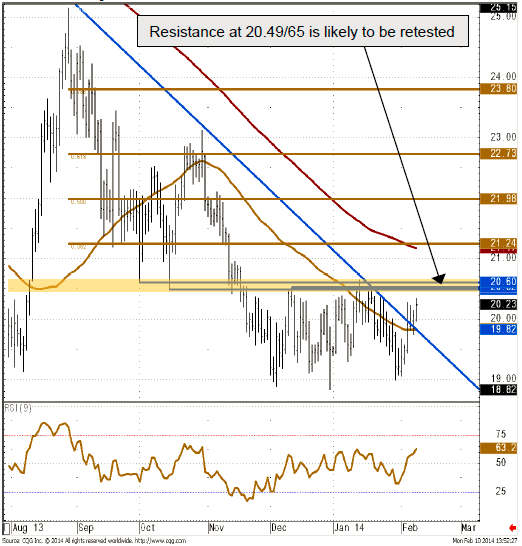
Once again bounces off the.
Silver Weekly Chart