Analys
Overdue correction on the back of equity sell-off and rising US crude production and rig count rise


More US crude oil production in 2018 is what the US STEO report will say tomorrow
Last week the US EIA released actual US crude oil production for Nov 2017. It came in at 10.038 m bl/d, just a fraction from the all-time high in 1970 of 10.044 m bl/d. The November data was 170 k bl/d higher than what EIA’s estimated in the Jan-17 STEO report which estimated it to be 9.87 k bl/d.
Last week’s data point came as little surprise to us. This is because when you look at the monthly US EIA STEO report and the monthly US EIA DPR report it is evident that the two reports are out of sync. It shows that the strong rise in US shale oil production which is spelled out very clearly in the DPR report is not reflected in the US STEO report. Neither when it comes to the latest months back to November nor the forward looking months over the coming year.
Last week’s upwards revision of 170 k bl/d to 10.038 k bl/d may seem fickle in the big scheme of things. But when you see that reason is the lack of synchronization between the STEO and the DPR reports then the error becomes systematic rather than just noise. Then one can take into account US shale oil production growth also for December, January and February. The DPR report spells out clearly that shale grew and will grow by 311 k bl/d during those three months. In addition is 60 k bl/d of production growth in GoM and Alaska. Thus a total gain of 371 k bl/d on top of the November data.
This brings us to the fact that US crude oil production is highly likely standing at 10.41 m bl/d now in February 2018. In perspective the US EIA STEO report forecasts US crude oil production to average 10.27 m bl/d in 2018. For February alone we are already 136 k bl/d above that (based on DPR data). We are also 359 k bl/d above the EIA’s February production estimate (STEO report) of 10.05 m bl/d.
All told the US monthly STEO report which is the official US crude oil production forecast is lagging US shale oil production growth both on a 2-3 months backward looking basis (vs the DPR report) as well as on a forward looking basis. After all the US EIA DPR report is showing that US shale oil production is now is growing at more than 100 k bl/d per month. Well completions are still rising and since the start of the year there has been an additional 18 drilling rigs activated in the US oil space.
Unless oil prices collapses there is little reason to believe that US shale oil production will not continue to grow by 100 k bl/d per month all through 2018 (as it has done since July 2017) rather than the 41 k bl/d/month estimated in the January EIA STEO report. We expect another solid revision higher for 2018 US crude oil production projection by the US EIA when it publishes its monthly STEO report tomorrow. It will be the 5th upwards revision in 5mths and it won’t be the last until they reach a forecast of around 10.7 to 10.8 m bl/d for 2018.
We view the current sell-off as a very good buying opportunity for forward crude contracts. Brent Dec-2020 now trades at $57.9/bl = $54.6/bl if inflation adjusted.
Chart 1: Weekly oil inventory data rising marginally rather than declining steeply
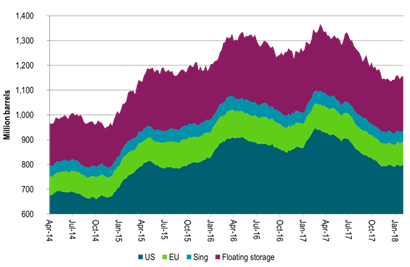

Chart 2: Dated Brent crude has shifted to a discount to Brent 1mth rather than a premium
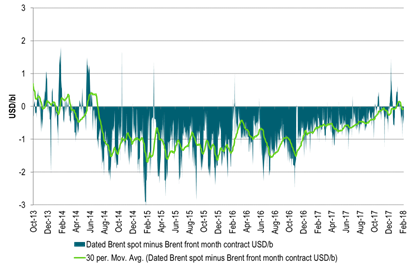
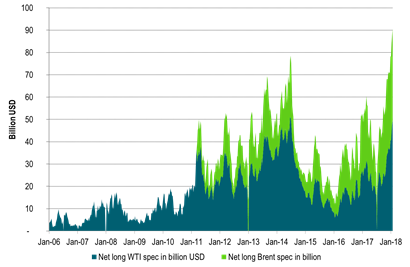
Chart 3: Net long speculative allocation to oil at all-time-high
That’s a painful position as the market now sells off
Kind regards
Bjarne Schieldrop
Chief analyst, Commodities
SEB Markets
Merchant Banking