Analys
Natural gas remains under pressure


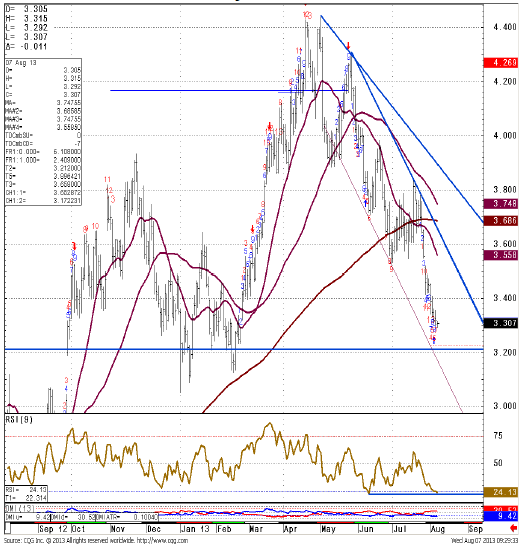
Market remains under pressure, but is expected to hold the initial test of the 3.1250/3.05 zone.
- Natural Gas has eroded the 78.6% retracement at 3.4070 together with its 200 week moving average 3.52 and this leaves it vulnerable on the downside.
- The 3.4070 support was considered to be the last defense for the 3.1250 February low and the 3.05 low charted in January. These are the next downside targets. Given that the daily RSI is already low and we have a TD perfected set up on the daily, we should see these supports hold the initial test.
- The 3.05 low in turn guards the 2.87 61.8% retracement of the move up from the 2012 low.
- Rallies face tough overhead resistance which converges 3.52/66, this is the 200 week moving average and the downtrend. A negative bias will be maintained while the market is trading below the 3.8350 July peak.
NYMEX Natural Gas Daily Continuation Chart