Analys
Market does not care about US shale, but it should. It is now growing as it did in 2014


Yesterday’s US DPR report showed that shale oil production is growing as strongly now as it did in 2014 when it grew at a monthly rate of 114 k bl/d/mth (1.4 mb/d rate).
The EIA estimates that US shale oil production will grow by 110 k bl/d from Jan to Feb which is a marginal rate of 1.3 mb/d. This is in stark contrast to EIA’s latest monthly oil report which predicted crude oil production from US lower 48 states (ex Gulf of Mexico) would only grow at a rate of 33 k bl/d in 1Q18 and on average only 42 k bl/d through 2018.
Yesterday’s DPR report shows that US shale oil production is growing 160% faster than what the US EIA uses in its STEO report assumptions for 2018 forecast. It shows that the US EIA will have to revise its US crude oil production forecast for 2018 significantly higher. It has revised it upwards in its last four reports. It is far from done doing so in our view.
US shale oil volume productivity growth (new oil per rig in operation) is in our calculations up 23% y/y 4Q17 to 4Q16. This is in strong contrast to EIA’s official productivity measure of zero growth which is not taking account of the huge build-up of DUCs.
Drilling of wells is still running significantly ahead of completions with the inventory of uncompleted wells rising by 156 wells in December. Completions are struggling to catch up. Either drilling will have to fall or completions will have to speed up in order to prevent a further build-up of DUCs. Players should kick out 100 drilling rigs in order to get drilling in line with completions. In order to draw down the DUC inventory they should kick out another 100 rigs more and thus a total 200 rigs while keeping completions at current level. The market should thus not be optimistic on prices due to a decline in US drilling rig count.
Completions of wells rose to (1091) the highest level since April 2015. However, if the number of completions is adjusted for increasing well productivity then well completions in December 2017 came in at the highest level since these data started in Jan 2014 and 27% higher than well completions on average in 2014.
In our view it seems reasonable to assume that US shale oil production will grow at its current speed through 2018 which means a total growth of 1.32 mb/d from Dec-17 to Dec-18. In addition comes a growth of 180 k bl/d from non-shale bringing the total US crude oil growth in 2018 to 1.5 mb/d. This will place US crude oil production at 10.68 mb/d on average for 2018 which is up 1.38 mb/d from 2017 average of 9.3 mb/d. In addition comes a 0.5 mb/d growth in US NGLs bringing total US liquids growth to 1.88 mb/d y/y average 2017 to average 2018.
Chart 1: US shale oil production to a new all-time-high in February
Growing like it did in 2014.
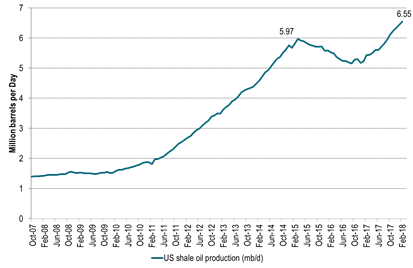

Chart 2: US shale oil production growing as strongly as it did in 2014
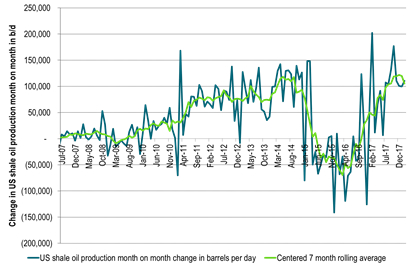

Chart 3: The number of drilled but uncompleted wells is still growing briskly
Thus drilling is running ahead of completions. Completions trying to catch up.
Players should kick out 200 drilling rigs in order to draw down the DUCs
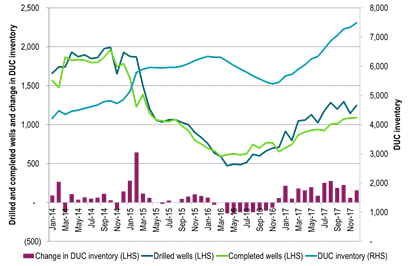

Chart 4: US volume drilling productivity is up 23% from 4Q16 to 4Q17 in our calculations
That is very different from the official US EIA drilling productivity measure which does not take account of the shifts in the DUC inventory
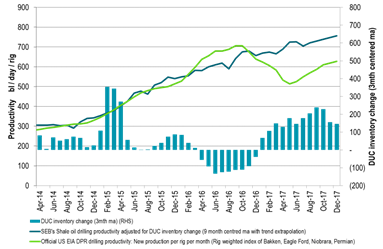

Chart 5: Thus US shale oil volume drilling productivity per rig never really declined y/y
Instead it has stayed at a pretty solid level of around +-20% y/y
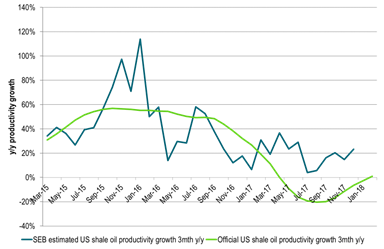

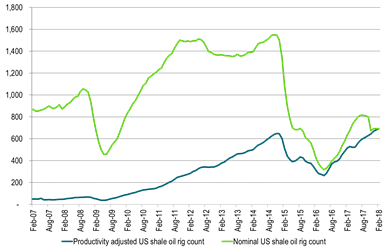
Chart 6: Today’s drilling rig count is 21% above the average 2014 count in real terms
Adjusting historical rig count with today’s official US EIA drilling productivity
Official US drilling productivity is today 2.6 times as high as it was on average in 2014

Kind regards
Bjarne Schieldrop
Chief analyst, Commodities
SEB Markets
Merchant Banking