Analys
Iran protests drives Brent yet closer to $70/bl


As of yet there is no deep seated concern for a disruption of Iran’s 3.8 mb/d crude oil production. However, if it was to happen it would have a huge impact on the global crude oil prices. A full disruption of such a magnitude would immediately drive the Brent crude oil price above the $100/bl mark. The current production cuts by OPEC, Russia and their allies of some 1.5 to 2 mbl/d would of course help to soften the blow but would not be enough to prevent a strong rise in crude oil prices.
Geopolitical risks are clearly back on the crude oil agenda after having been absent almost entirely since the oil market ran into a surplus in second half of 2014. Geopolitical risks started to impact the oil price again last autumn as production cuts then had drawn inventories significantly lower.
The Kurdistan vote for independence on September 25 last year drove Brent to a temporary high of $59.49/bl at the time. The partial disruption of the Kirkuk-Ceyhan (600 kbl/d capacity) pipeline later in October then helped to drive Brent crude yet higher.
In December a pipeline in Libya carrying oil to the Es Sider terminal was damaged by an explosion and reduced oil flows by some 100 kbl/d. Versus Libya’s total production of about 1 mbl/d it was not such a big deal. However, it places a huge question mark over the stability of Libya’s oil production. Its production increased surprisingly from 400 kbl/d in 2016 to its current level of about 1 mbl/d. The market’s concern is that we could see a reversal of this again.
The Brent crude oil price is now getting closer and closer to the high print of 2015 of $69.63/bl and it works like a magnet on the market price as it now trades only a little more than two dollars below at $67.2/bl. Once the $69.63/bl price is broken we will have to look back all the way to 2014 in order to find comparable price levels.
In general we expect volatility to rise across markets in 2018 as central banks starts to pull back stimulus. This should apply to crude oil prices as well. We expect OPEC and its companions to stay the course in 2018 in terms of production cuts leading to further draw downs in inventories but less than in 2017. Lower inventories should make the oil price more sensitive to geopolitical risks and disruptions.
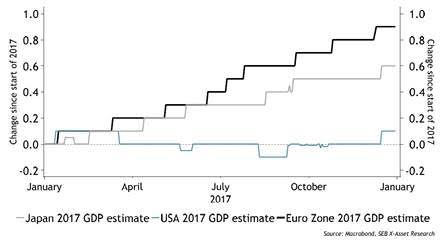
Through 2017 the Brent crude oil price had an almost continuous support from global growth outlooks being revised higher and higher. Though global growth is likely to be marginally higher in 2018 than in 2017 the markets expectations are unlikely to be revised higher and higher as central banks starts to reduce stimulus. Thus 2018 should be less of a one way street then 2017.
As we enter 2018 the net long speculative allocation to Brent and WTI crude oil stands at more than $70bn and it has only been higher once in history which was back in mid-2014 when it peaked at $77bn. If we count the amount of net long speculative Brent and WTI crude contracts in barrels it now stands at close to 1,200 million barrels versus a 2014 high of 715 million barrels.
Not having at least one solid correction to the downside in 2018 with such a mega bullish allocation to start with would probably be the biggest surprise of all in 2018. If that is on the back of normally rising US crude oil inventories from week 1 to 20 of some 35 million barrels, continued strong rise in US shale oil production or an emerging fear of a global recession in 2019 or something else remains to be seen.
Chart1: Net long speculative positions in Brent crude and WTI crude oil in billion USD
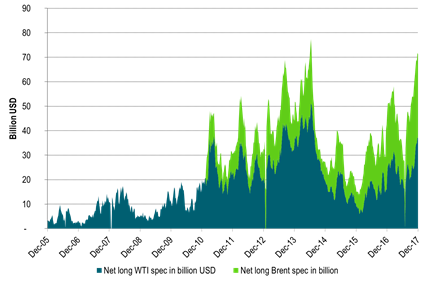

Chart2: Cumulative change in US crude oil inventories from week one in the year
US crude oil inventories normally rise some 35 mb from week 1 to 20
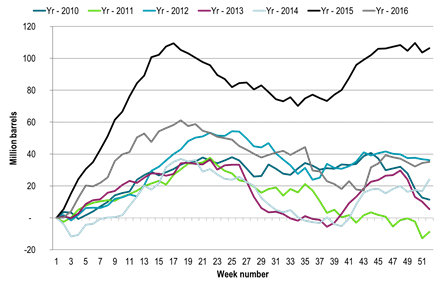

Chart3: Growth expectations was a one way street upwards in 2017

Kind regards
Bjarne Schieldrop
Chief analyst, Commodities
SEB Markets
Merchant Banking