Nyheter
Gold Stocks vs. Bullion in a Gold Bull Market


Over the past few weeks, we have received questions about whether gold or gold stocks are the best way to access the current bull market so we thought it would be helpful to review how this bull market compares with those of the past.
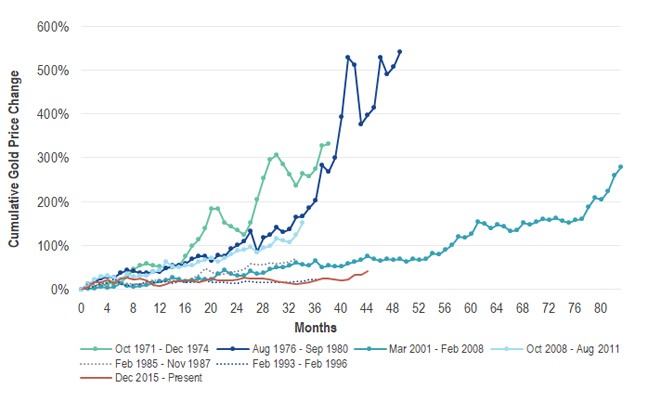
Bull markets can be classified as either secular (long term) or cyclical (bull phases within an overall bear market). Before its $1,400 per ounce breakout in June, gold appeared to be tracking, on a technical basis, similar to its 36-month cyclical bull market from 1993 to 1996. However, its current $1,500 price level hints at a potentially longer, sustained rally—perhaps more similar to the secular gold bull market of 2001 to 2008.
Historical Gold Bull Market Rallies Have Come in All Shapes and Sizes

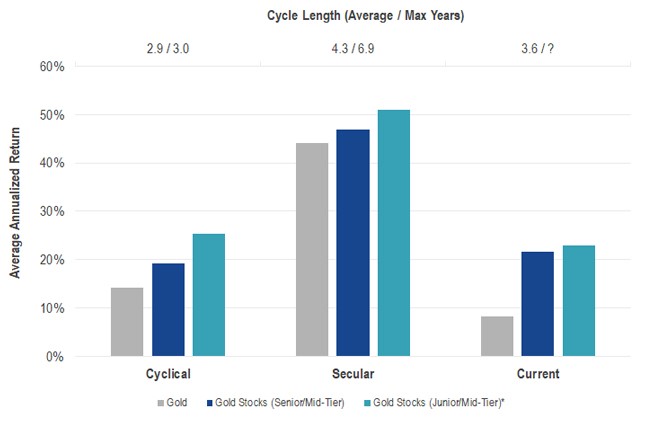
Gold stocks, on average, have historically outperformed gold during gold bull market cycles in the past—including through both cyclical and secular periods. This typically occurs because of their optionality to gold through earnings and resource leverage.
Gold Stocks Have Outperformed Gold in Past Bull Market Cycles

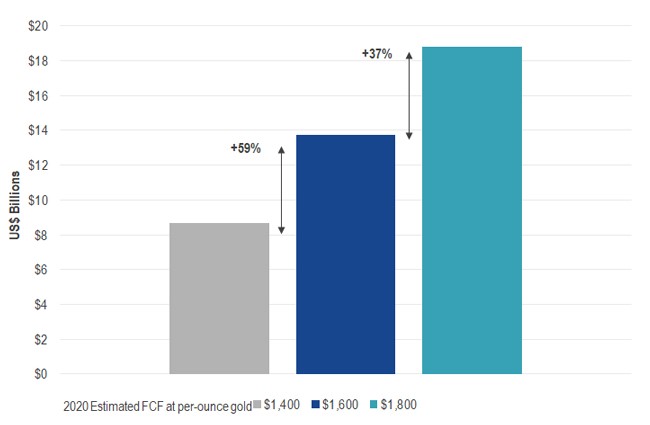
However, the greatest difference between the last bull market cycle (2008 to 2011) and the current cycle is the lengths to which these companies have gone to reduce costs and capital expenditures and to avoid mistakes of the past (such as “hedging” their production—i.e., buying futures contracts to ensure delivery of their gold at a fixed price at a later date in time—in a rising gold price environment). For senior or mid-tier miners, these efforts could translate to nearly 60% increases in free cash flow, on average, for a gold price move from $1,400 to $1,600. We believe that this makes a compelling case for gold stocks at the moment and, in particular, given their attractive valuation on both an absolute and relative basis.
Some Gold Senior and Mid-tier Miners Exhibit Favorable Leverage to Higher Gold Prices