Analys
Crude oil price action – Falling back below the $50/b line


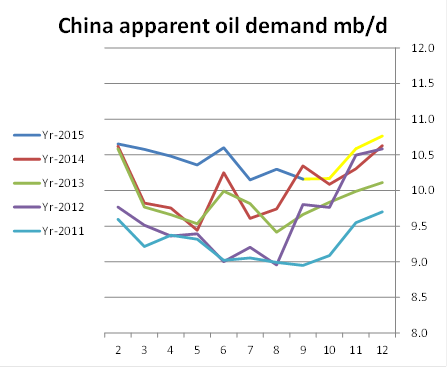
- China apparent oil demand growth down 1.8% y/y in September
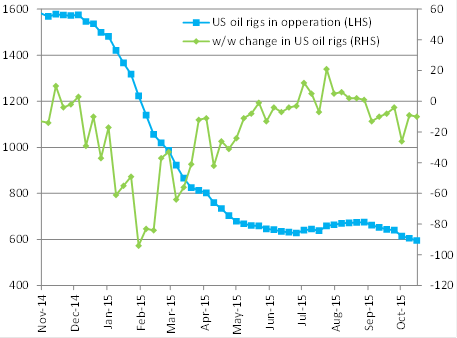
- US oil rig count fell by 10 last week – Down 7 weeks in a row totalling a decline of 80
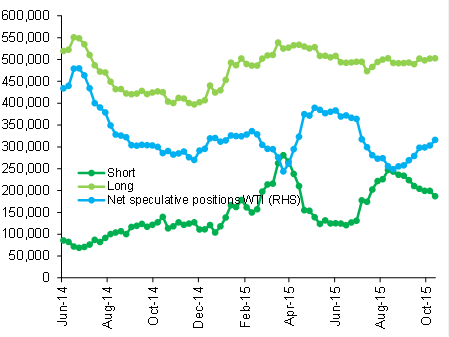
- WTI spec positioning increased over week ending Oct 13
- From last week:
– US crude oil production fell 76 kb/d w/w in last week’s data
– US EIA projected crude oil production – close to sideways rest of year due to increasing GOM production

Price action – Falling back below the $50/b line
Brent crude fell back 4.6% last week to $50.46/b. The sell-off started Friday the week before and then accelerated at the beginning of last week. This time it was not about the USD which actually weakened over the period. News last Monday from OPEC that its September oil production reached the highest level in three years (31.57 mb/d) probably helped to push the price down. A solid rise in US crude oil stocks (+7.6 mb) and fairly bearish oil market reports from IEA and EIA (oil market in surplus throughout 2016) added bearish sentiment during the week. Chinese imports (total economy) falling 17.7% y/y in September did not help on the sentiment either. Industrial metals were mixed but overall down 0.7% last week. This morning Brent crude is down 1.2% to $49.9/b with industrial metals also in the red both oil and metals obviously unimpressed by slightly better than expected China Q3 GDP growth of 6.9%. Disappointing this morning is China apparent oil demand falling 1.8% y/y in September. Still falling US rig count on Friday (US oil rigs down 10 to 595) has not yet been able to push the price higher this morning.
China apparent oil demand growth down 1.8% y/y in September
This places ytd y/y demand growth indicatively at 4.6%. If we extrapolate the rest of the year with the average m/m growth rates for the last 4 years we get a projected total 2015 y/y China oil demand growth of 3.8%. SEB’s latest projected China oil demand growth (Aug) for 2015 stood at 5% which may now look too high.
Yellow line is projection according to last 4 year’s average % changes.

US oil rig count fell by 10 last week – Down 7 weeks in a row totalling a decline of 80
This more than erases the rise in US oil rigs during July and August of 47 rigs

WTI spec positioning increased over week ending Oct 13
As short positioning was reduced and long positioning increased

US crude oil production fell 76 kb/d w/w in last week’s data
The average decline in weekly data since start of July now stands at minus 33 kb/d/week.
Extrapolating this to the end of the year places US crude oil production at about 8.7 mb/d end of year versus 9.6 mb/d in April.
Note however that due to an expected increase in US GOM production the EIA expects US crude oil production to end the year at 9.0 mb/d.
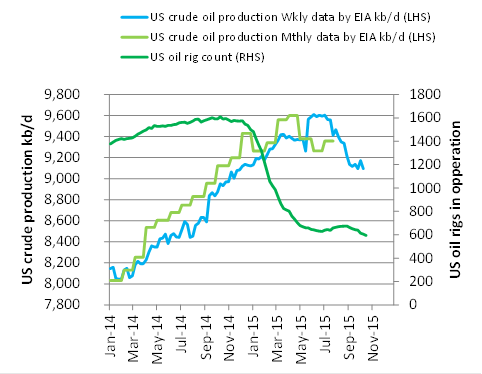

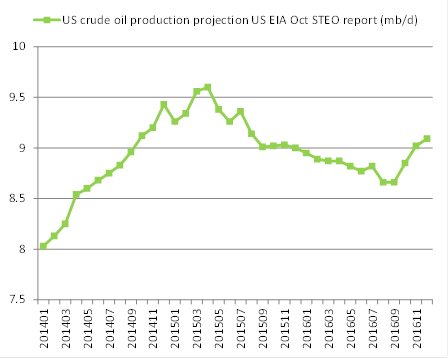
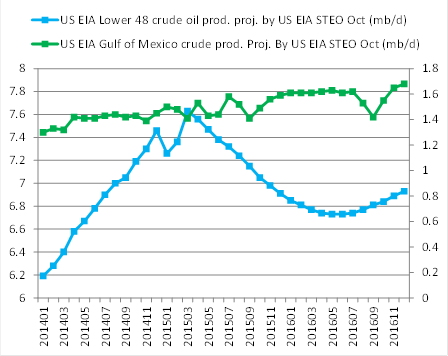
US EIA projected crude oil production – close to sideways rest of year due to increasing GOM production
In its monthly Short Term Energy Outlook last week the US EIA projected that US crude oil production will stay fairly steady for the rest of the year. This looks mostly like a result of a projected increase in Gulf of Mexico (US).


From last week:
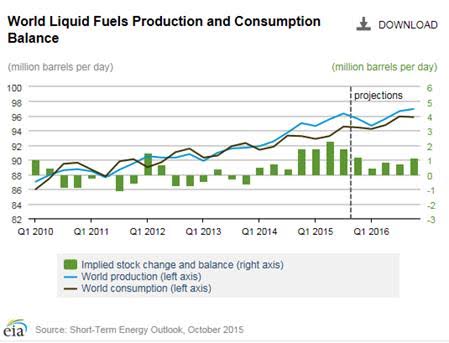
EIA – Global oil to remain oversupplied in 2016 as demand slows and Iranian exports recover
Demand growth likely to revert to long term trend in 2016 after a boost to oil demand growth in 2015 due to a steep y/y fall in oil prices it said. Global market to remain in surplus despite falling US production.

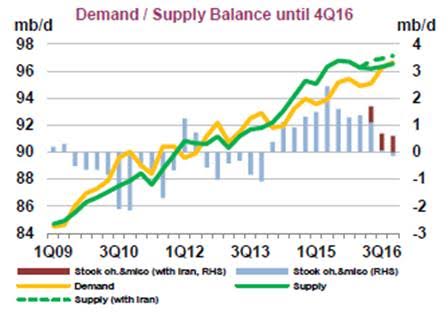
IEA – Global oil market to remain in surplus throughout 2016 if Iran returns to market
Reduced IMF growth outlook for 2016 (from 3.8% to 3.6%) leads to reduced oil demand growth for 2016. Strong demand growth did however continue into 3Q15.

Bjarne Schieldrop
Chief analyst, Commodities
SEB Markets
Merchant Banking