Analys
Crude oil comment – Surplus stored here or there?


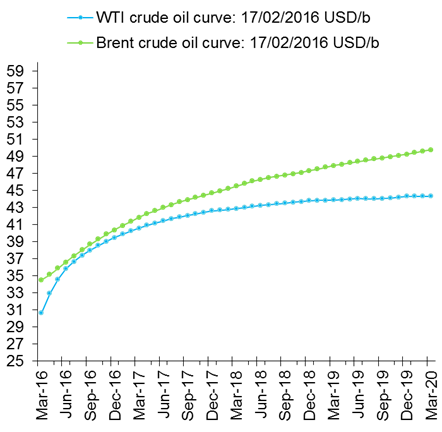
- Graph 1: Deep WTI contango – Costly or impractical to store oil in the US mid-continent
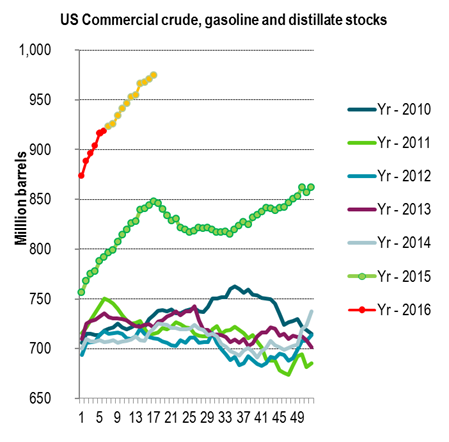
- Graph 2: US crude, gasoline and distillate stocks

Crude oil comment – Surplus stored here or there?
Today we will have the publishing of US oil inventory data at 17.00 CET. Since the start of August last year total commercial US crude and product stocks have increased by 102 million barrels. During that period we have only seen 5 weeks with declines in the net change in stocks constituted by crude + gasoline + distillates. The general take has been that the US holds a substantial capacity of the yet remaining free storage capacity for oil globally. Thus not surprisingly that has also been where we have seen the solid accumulation in oil inventories. The US is a huge net importer of oil, still the second biggest oil importer in the world. Thus when we see consistently increasing oil inventories in the US it basically means that the US is importing more oil than it needs. This has of course been impacted by logistical issues within the US regarding location of production versus consumption and crude qualities and refinery specs in combination with the earlier crude oil export ban.
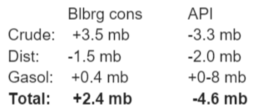
In last week’s data release we saw that the net increase of crude, gasoline and distillates only came in at a +1.8 mb gain. That was the lowest gain since late December since which the average weekly gain has been running at about +10 mb per week. The Bloomberg consensus for today’s US oil inventory data released points to a total rise of 2.4 mb. The partial data set aggregated by API from its members in the US oil space did however point to a solid total decline of 4.6 mb with a significant decline in US crude stocks as well as distillates:

So what is driving this change in pattern? No more stock building in the US? On paper it looks like the US Pad II should still hold a substantial amount of free, available storage capacity for both crude and products. However, what the deep contango in the WTI curve is telling us is that it is becoming very expensive to store oil in the US mid-continent. Yes, crude stocks in Cushing Oklahoma are close to full. As such the contango in the WTI crude oil curve should be deep. However, if there was a substantial amount of storage capacity which was low cost to use, easy logistics and easily operational readily available in the vicinity of Cushing and in the Pad II region, then the close to capacity and deep contango in the WTI curve should drive oil away from Cushing and into other storage facilities in Pad II. Thus again, the deep WTI contango probably tells the market that the remaining available storage capacity in Pad II in the US may not be very cheap to utilize. This could be thus be due to several issues like cumbersome logistics or old age or that storage space is there but it is not really operationally available.
Looking at the WTI forward curve in comparison with the Brent curve the WTI curve’s accelerating, deepening contango this year is basically shouting out: It is becoming increasingly expensive to store oil in the US mid-continent. Go and store oil somewhere else.
If we today see that total US oil stocks are actually declined in the US last week as indicated by the API numbers then it is likely to have a bullish impact on oil prices. Especially if it is combined with for example a further decline in US crude oil production (data to be published together with inventory data today) in combination with the current ongoing oil price rebound on the back of the OPEC + Russia talks on production freeze. It is going to be perceived as bullish partly because it may be interpreted as if the global oil market is less in surplus now than 3-4 weeks ago. This we think is the wrong interpretation. The market is still running a surplus of some 1.5 mbpd which needs to be stored somewhere. If stocks don’t continue to rise in the US it basically means that stocks will need to rise outside of the US. It does mean that the deep contango in the WTI curve may ease a bit while the contango in the Brent curve will deepen. As such it is on the margin supportive for the WTI front month prices versus a bearish impact for the Brent front month price.
Thus do not jump on the conclusion that declining stocks in the US means that there is no global surplus. It basically means that surplus is stored somewhere else.
Graph 1: Deep WTI contango – Costly or impractical to store oil in the US mid-continent

Graph 2: US crude, gasoline and distillate stocks
Yellow line is if further inventory rise follows last year’s trende from here.
Normally total US crude, gasoline and distillate stocks don’t increase much.
Thus the increase last year and so far this year is a reflection of the global surplus
Thus if it is becoming increasingly costly to store oil in the US then the stock building has to take plase somewhere else.

Kind regards
Bjarne Schieldrop
Chief analyst, Commodities
SEB Markets
Merchant Banking