Analys
Copper under pressure

![]()

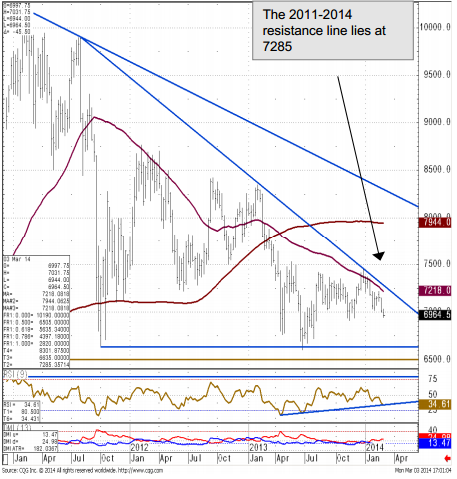
- The LME Copper chart has deteriorated following its recent rejection from the 2011-2014 resistance line, this currently cuts in at 7285. While capped here, our negative bias remains entrenched and we should see support offered by the 6910 November low re-tested.
- Directly above here, resistance extends to 7534 (May 2013 high) and while capped here, the late July low at 6721 will continue to be targeted.
- Only a daily close above 7534 however would mean a continuation of the August advance and target the 61.8% Fibonacci retracement at 7680 and introduce potential for the 200 week ma at 7944.
- Failure at 6721 will shift attention back to major support at 6635/02 (October 2011 low, 50% retracement of the move up from 2008 to 2011 and June trough).
- Below 6635/02 would trigger another leg lower to 6037.50, the low seen in 2010.
LME Copper Weekly Chart