Analys
Biggest Brent/WTI curve-shape-divergence since Feb 2016


Brent crude traded down 1.0% yesterday to $61.51/bl following a 1% decline last week. A stronger USD was again an important negative driver as the dollar index gained 0.4% yesterday following a 1.1% gain last week. The US WTI crude benchmark has fared much worse than Brent lately. Over the past 7 days the WTI marker is down 3.9% while Brent is only down 1.6%. I.e. there has been a tremendous bearish sell-pressure on the WTI benchmark which has dragged Brent crude along lower as well.


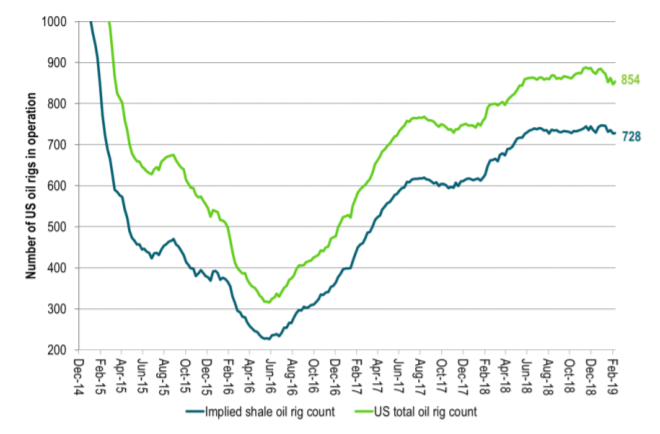
There has been a rapidly increasing curve-shape-divergence between the global Brent crude benchmark and the more land-locked WTI benchmark. OPEC+ has been successful in cutting back production since its peak production in November last year. The Brent market has thus firmed up which has shifted the Brent curve into mostly into backwardation up to 2022. The WTI curve has however moved into deep contango at the front end of the curve until Jan 2020 before joining Brent’s curve shape thereafter. The deepening of the front end WTI contango is probably a combination of 1) Rising US stocks, 2) Investors selling WTI on the back of weakening global growth indicators and 3) Very limited reduction in US shale oil drilling rig count as a in response to lower prices since October 2018.
We think that the current large curve-shape-divergence between the Brent and WTI crude curves are unlikely to hold. The curve shapes are likely to converge. Either the Brent curve will bend to the WTI contango or the WTI contango will bend to Brent.
Ch1: A large curve-shape-divergence between the Brent and the WTI crude curves has developed

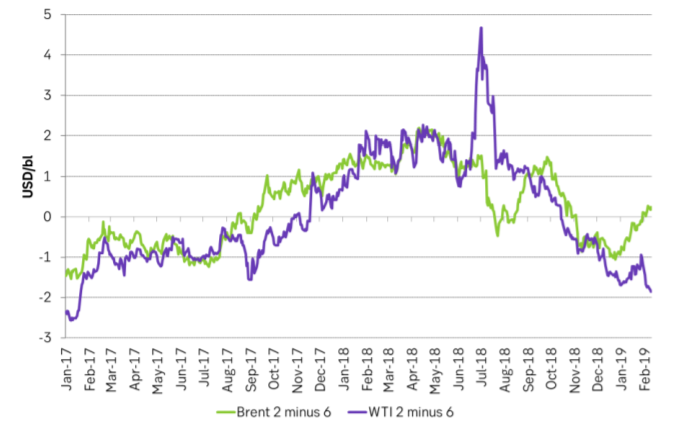
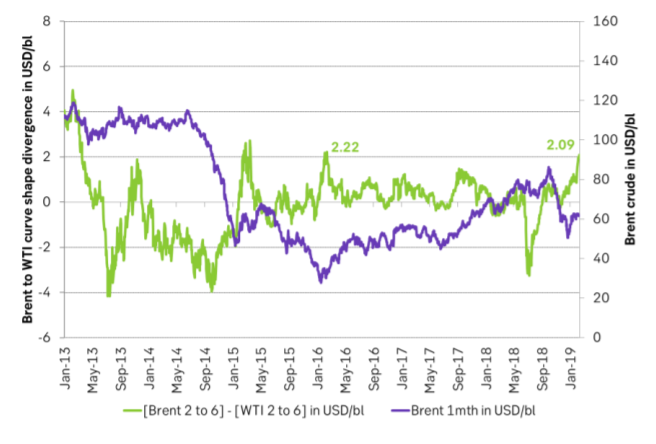
Ch2: [Brent 2 to 6 mth] minus [WTI 2 to 6 month]. The curve-shape-divergence is now as large as it was in early 2016. Was all the way up to more than $4/bl in early 2013 but that was when Brent traded around $120/bl

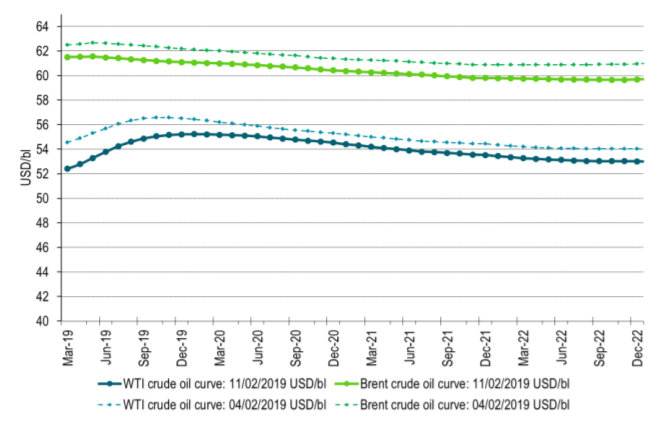
Ch3: Brent and WTI crude curves. WTI bending lower on rising US inventories, weakening global macro indicators, stronger dollar (investors selling crude when USD is strengthening) and also very little sign that shale oil drillers are backing down despite much lower crude prices since October 2018.

Ch4: Not much reduction in US shale oil drilling activity

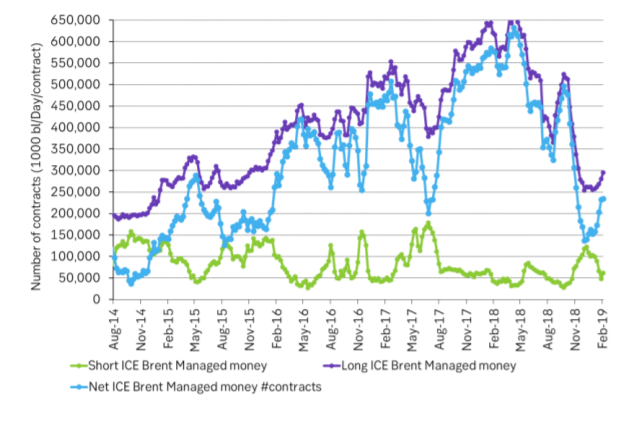
Ch5: Brent spec accounts have added length with a bullish angel on the back of the decision by OPEC+ to cut in early Dec

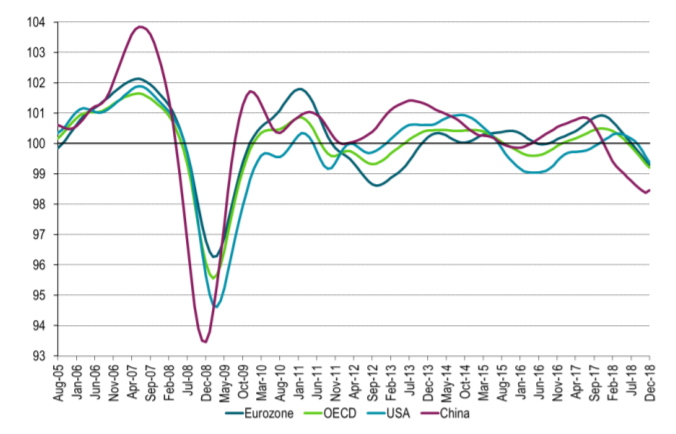
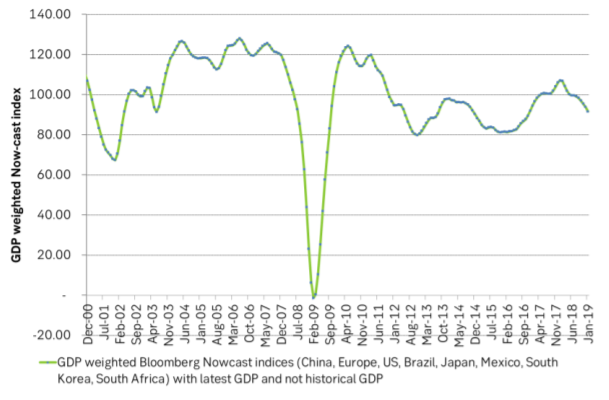
Ch6: Weakening Now-Cast. OPEC+ is fighting not just still strongly rising US shale oil production but also weakening global growth indicators.

Ch7: OECD Composite Leading Economic Indicators, mostly moving lower