

Analys
Still upside to crude oil spot prices into Q2-17 but softer again in H2-17

 We expect front month Brent crude to head higher in Q2-17 to average $57.5/b but to toutch above $60/b at times.
Refineries will move back into operation consuming more oil. OPEC is delivering on cuts and inventories will decline.
US crude production is now growing (marginally, annualized) as fast as it did between 2012 and May 2015.
We expect OPEC to end cuts after H1-17 as mission is accomplished: Inventories are steady or declining and spot crude oil prices are equal to or higher than longer dated contracts. Not much more OPEC can do.
We expect the front month Brent crude oil price to fall back in H2-17 in the face of strongly rising US shale oil production and reviving OPEC production.
Brent crude front month price to average $52.5/b in Q4-17 toutching $50/b at times.
Higher than expected US shale oil rig additions since the start of the year has softening our projected deficit in 2019. However, we still see a substantial inventory draw below normal in 2019.
From the news flow:
Exxon will use 50% of its drilling budget for 2017 on US onshore drilling with its production there growing 20% pa to 2025
Libya’s crude oil production falls back again as clashes re-erupt
IEA: OPEC will increase its production capacity by 2 mb/d from 2016 to 2022 with Iraq lifting production to 5.4 mb/d in 2022
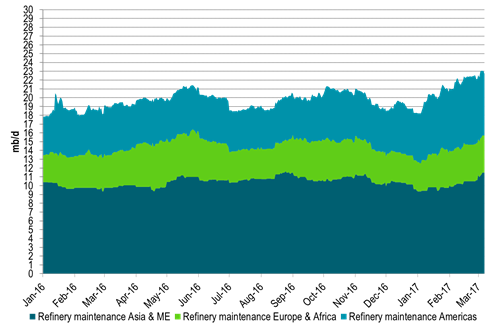
Ch1: Global refinery maintenance increased strongly in Q1-17 – Refineries soon to resume activity
A large increase in global refinery maintenance in Q1-17 left a comparble volume to be stored rather than processed
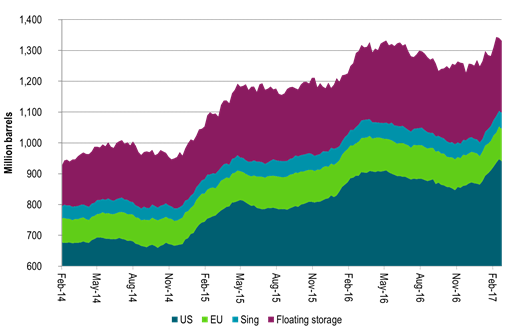
Ch2: Weekly inventories have rissen strongly in Q1-17 – Soon to decline.
OPEC also produced at record high level in Nov and Dec which has hit the market in Q1-17 along with several months of natural lag in the supply chain between production and consumption. Both helping to drive weekly inventory data up strongly in Q1-17
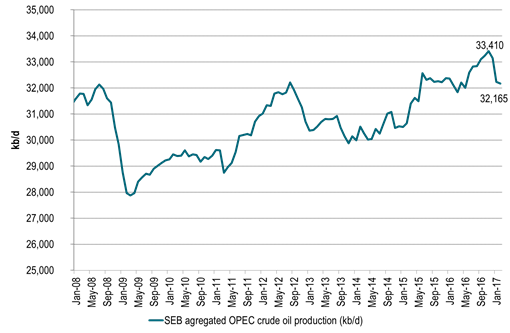
Ch3: OPEC delivers on cuts.
OPEC is delivering on its promises to cut. So when refineries move back on-line after maintenance and we also have the Nov and Dec OPEC production blob cleared out the the market we will see inventories starting to decline in Q2-17.
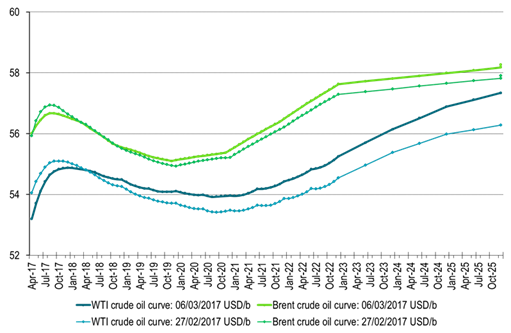
Ch4: Crude oil forward curve soon to move fully into backwardation
The forward crude curves will then move fully into backwardation with also the very front end of the curve (which is still in contango) moving into backwardation.
This is likely to lead front end Brent crude oil price up towards the $60/b mark with our expectation for an average Brent 1mth price of $57.5/b during Q2-17 touching $60/b at times.
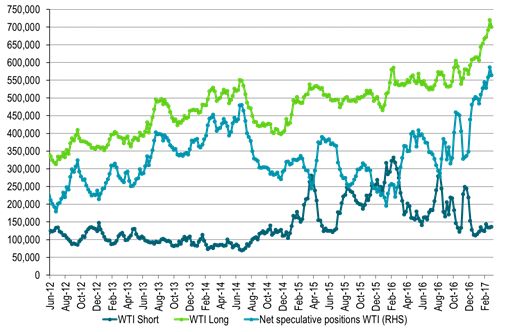
Ch5: Speculators are bullish awaiting that last move into full backwardation
And speculators are bullish accordingly – close to record high net long speculative position in WTI
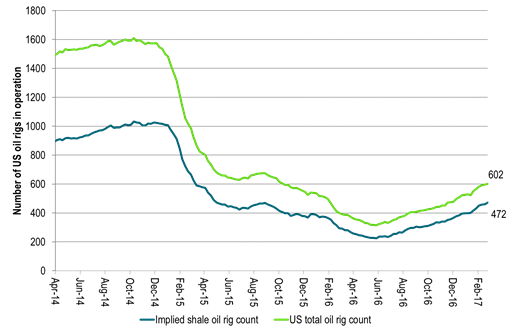
Ch6: US oil rig count moves higher and higher and higher
But US oil rigs are constantly added to the market and at a higher rate than we had expected.
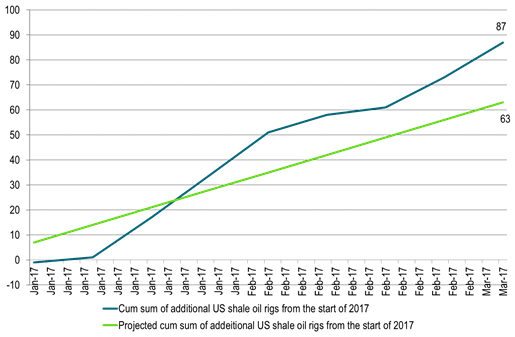
Ch7: More US shale oil rigs have been activated versus what we had expected
More shale oil rigs have been added into activity in the US shale oil space versus what we had expected
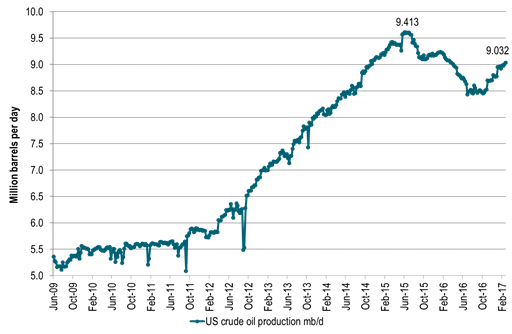
Ch8: Helping to shift US crude oil production growth back into full pre-2015 growth level again
US crude oil production is now on rising trend again adding on average 30 kb/d w/w since the start of the year.
That is equal to a marginal, annualized growth rate of 30 kb/d/week * 52 week = 1560 kb/d/year (1.5 mb/d marginal, annualized growth rate).
That is back to the growth rate seen between 2012 to June 2015.
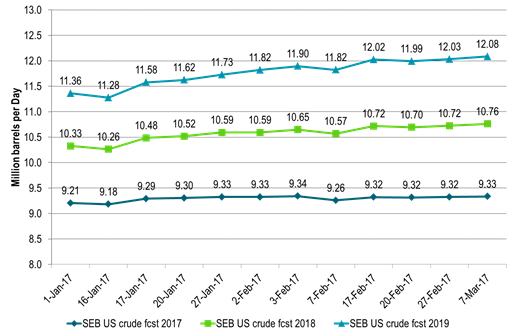
Ch9: More shale oil rigs than expected means higher forecasted US crude oil production than expected
This impacts our projected US crude oil production for 2017, 2018 and 2019 lifting it higher
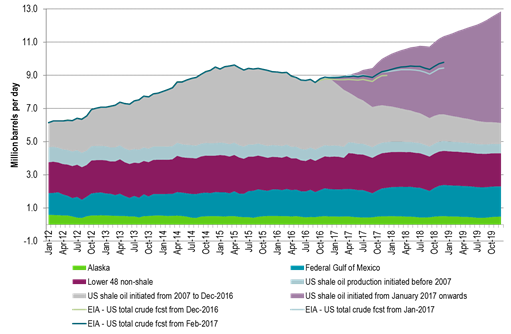
Ch10: With US crude oil production now expected to lift to close to 13 mb/d at the end of 2019
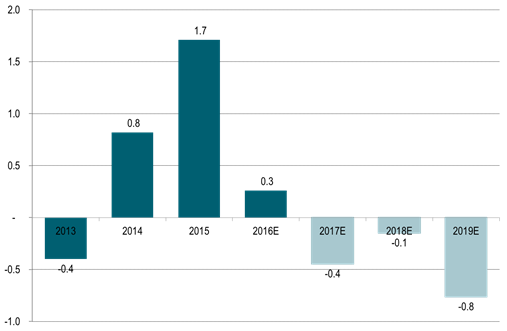
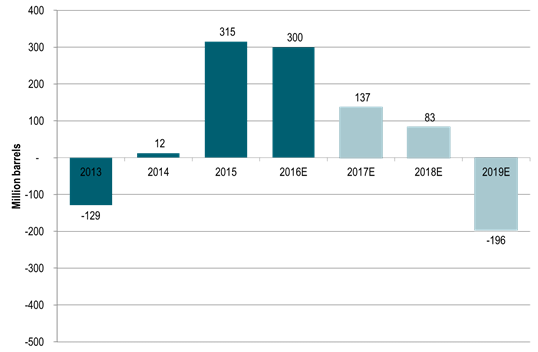
Ch11: Global supply/demand balance still in deficit next three years but not much deficit in 2018 any more
Almost constantly weakening and softening our projected supply/demand balance for the nearest three years.
With our view now that there will be almost no deficit in 2018.
But still a solid deficit and inventory draw coming in 2019 as cuts in investments in conventional supply since 2014 starts to hit the market.
Little conventional legacy investments to add additional supply in 2019 and thus little to counter natural declines in existing conventional production in 2019.
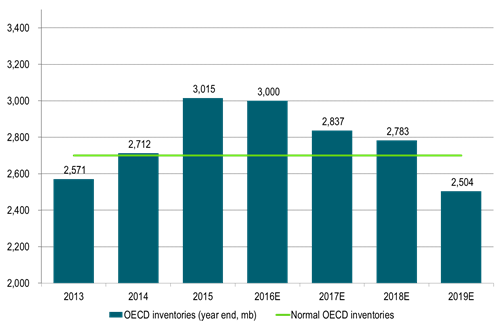
Ch12: End of year OECD inventories to draw substantially below normal in 2019
End of year OECD stocks still to draw substantially below a normal of 2700 million barrels in 2019.
But stocks are likely to end the year above normal for both 2017 and 2018.
Thus few pressure points in the global supply/demand balance during 2017 and 2018 as current elevated oil inventories provides a nice cushion
Ch13: End of year OECD inventories to stand some 200 mb below normal in December 2019
The year 2019 still looks like the year when things could happen to the oil price on the upside.
As end of year OECD inventories could draw down some 200 million barrels below normal
Unless of course demand growth weakens, US shale oil production accelerates even more or oil companies accelerate in-field drilling thus countering conventional declines.
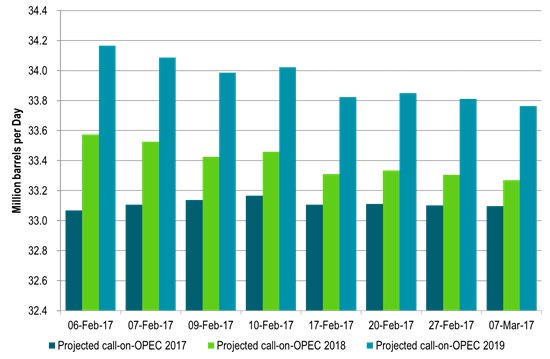
Ch14: Projected call on OPEC has declined since the start of February along with higher US crude oil production projections
As we steadily adjust our US crude oil production higher for 2017, 2018 and 2019 along with higher than expected additions of US shale oil rigs
The need for oil from OPEC declines comparably for the years to come
How far down is OPEC willing to let it slide? Probably not below 33 mb/d for 2018.
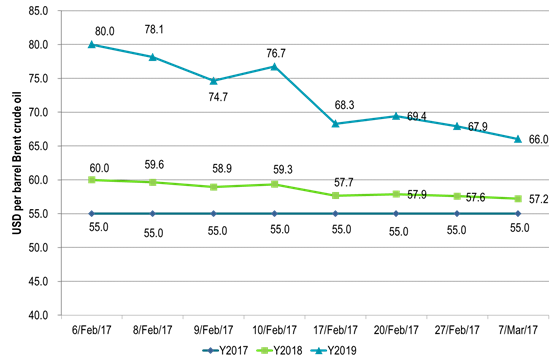
Ch15: Softer supply/demand balance naturally means softer prices
In a dynamic crude oil price forecasting frame the forecasted crude oil price declines along with with a softening forward looking supply/demand balance
(Prices in graph are mathematically extended from the $80/b forecasted at the start of February and are not new price forecast assessments)
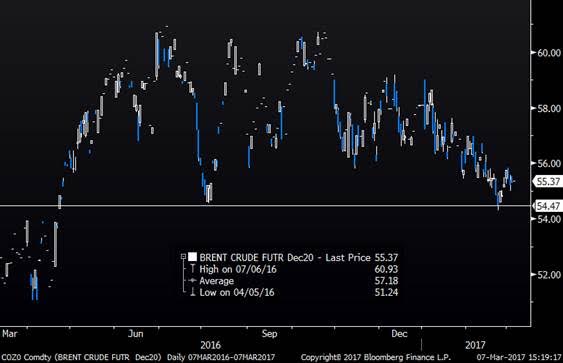
Ch16: Longer dated market prices have deteriorated since the start of the year
Longer dated contracts like Brent crude December 2020 have deteriorated since the start of the year
Probably reflecting the acceleration in US shale oil rig additions in Q1-17
In late February the contract traded at its lowest level since April 2016.
Kind regards
Bjarne Schieldrop
Chief analyst, Commodities
SEB Markets
Merchant Banking
Brent crude has fallen USD 3/b since the peak of Iran-Israel concerns last week. Still lots of talk about significant Mid-East risk premium in the current oil price. But OPEC+ is in no way anywhere close to loosing control of the oil market. Thus what will really matter is what OPEC+ decides to do in June with respect to production in Q3-24 and the market knows this very well. Saudi Arabia’s social cost-break-even is estimated at USD 100/b today. Also Saudi Arabia’s purse is hurt by 21% US inflation since Jan 2020. Saudi needs more money to make ends meet. Why shouldn’t they get a higher nominal pay as everyone else. Saudi will ask for it

Brent is down USD 3/b vs. last week as the immediate risk for Iran-Israel has faded. But risk is far from over says experts. The Brent crude oil price has fallen 3% to now USD 87.3/b since it became clear that Israel was willing to restrain itself with only a muted counter attack versus Israel while Iran at the same time totally played down the counterattack by Israel. The hope now is of course that that was the end of it. The real fear has now receded for the scenario where Israeli and Iranian exchanges of rockets and drones would escalate to a point where also the US is dragged into it with Mid East oil supply being hurt in the end. Not everyone are as optimistic. Professor Meir Javedanfar who teaches Iranian-Israeli studies in Israel instead judges that ”this is just the beginning” and that they sooner or later will confront each other again according to NYT. While the the tension between Iran and Israel has faded significantly, the pain and anger spiraling out of destruction of Gaza will however close to guarantee that bombs and military strifes will take place left, right and center in the Middle East going forward.
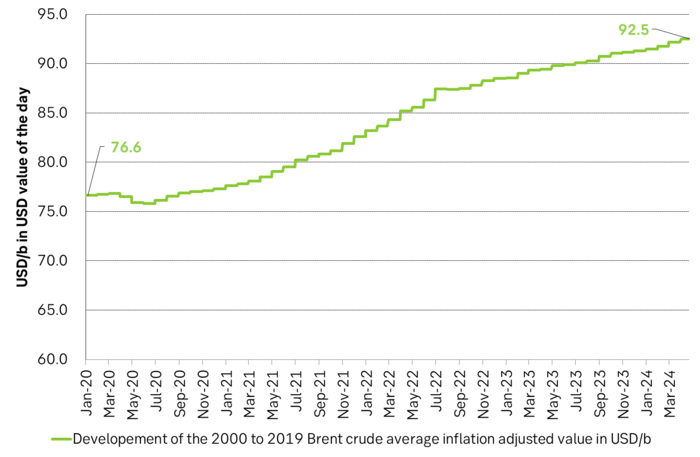
Also OPEC+ wants to get paid. At the start of 2020 the 20 year inflation adjusted average Brent crude price stood at USD 76.6/b. If we keep the averaging period fixed and move forward till today that inflation adjusted average has risen to USD 92.5/b. So when OPEC looks in its purse and income stream it today needs a 21% higher oil price than in January 2020 in order to make ends meet and OPEC(+) is working hard to get it.
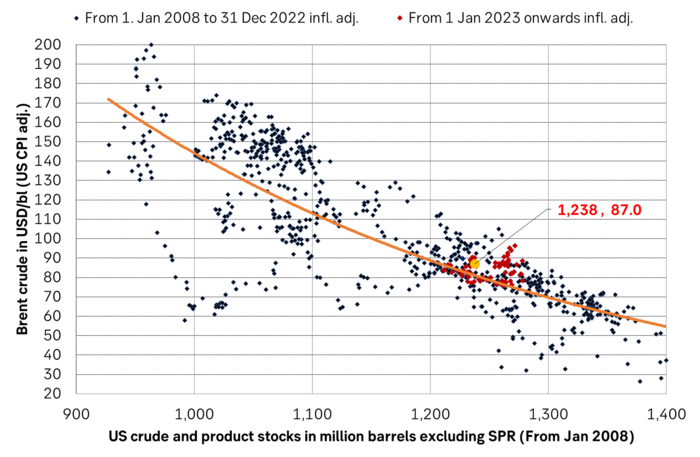
Much talk about Mid-East risk premium of USD 5-10-25/b. But OPEC+ is in control so why does it matter. There is much talk these days that there is a significant risk premium in Brent crude these days and that it could evaporate if the erratic state of the Middle East as well as Ukraine/Russia settles down. With the latest gains in US oil inventories one could maybe argue that there is a USD 5/b risk premium versus total US commercial crude and product inventories in the Brent crude oil price today. But what really matters for the oil price is what OPEC+ decides to do in June with respect to Q3-24 production. We are in no doubt that the group will steer this market to where they want it also in Q3-24. If there is a little bit too much oil in the market versus demand then they will trim supply accordingly.
Also OPEC+ wants to make ends meet. The 20-year real average Brent price from 2000 to 2019 stood at USD 76.6/b in Jan 2020. That same averaging period is today at USD 92.5/b in today’s money value. OPEC+ needs a higher nominal price to make ends meet and they will work hard to get it.
Inflation adjusted Brent crude price versus total US commercial crude and product stocks. A bit above the regression line. Maybe USD 5/b risk premium. But type of inventories matter. Latest big gains were in Propane and Other oils and not so much in crude and products
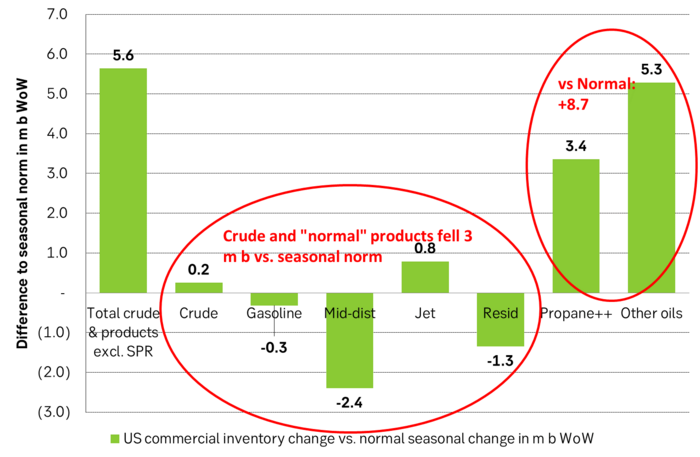
Total US commercial crude and product stocks usually rise by 4-5 m b per week this time of year. Gains have been very strong lately, but mostly in Propane and Other oils
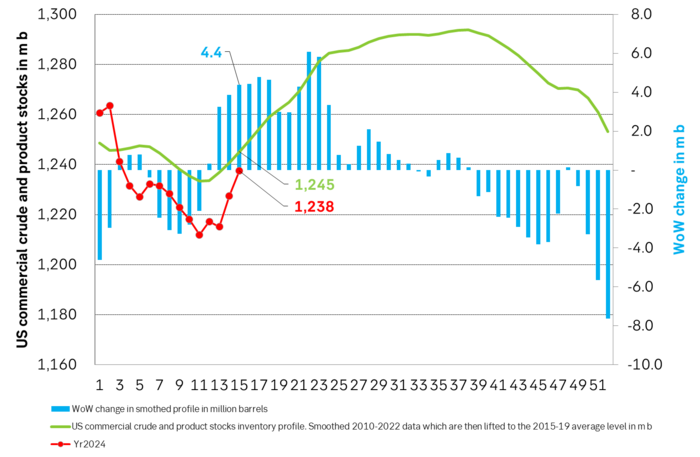
Last week’s US inventory data. Big rise of 10 m b in commercial inventories. What really stands out is the big gains in Propane and Other oils
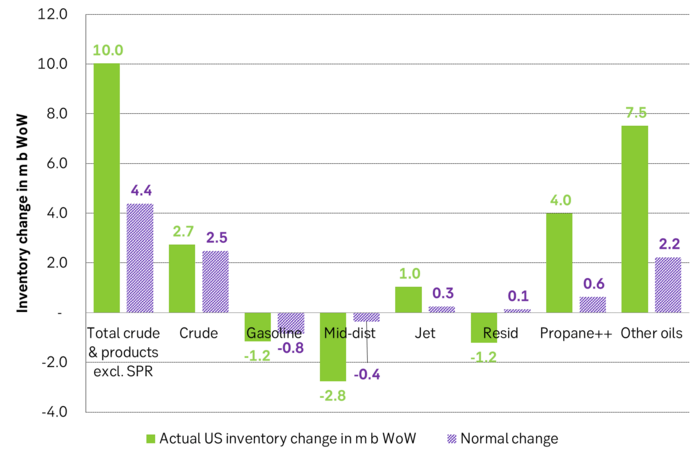
Take actual changes minus normal seasonal changes we find that US commercial crude and regular products like diesel, gasoline, jet and bunker oil actually fell 3 m b versus normal change.
Historically positive Nat gas to EUA correlation will likely switch to negative in 2026/27 onward
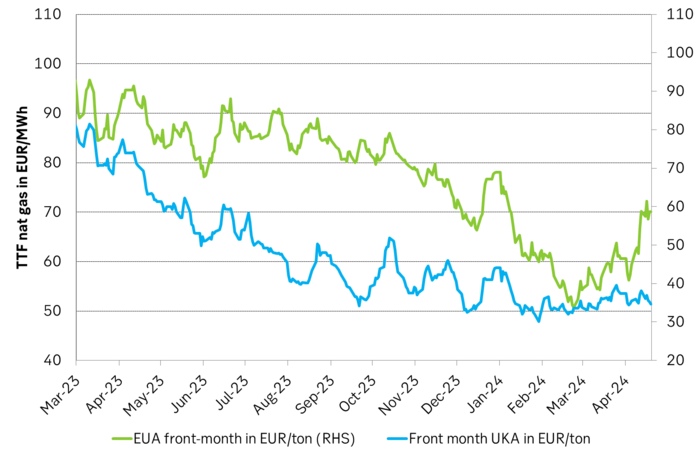
Historically there has been a strong, positive correlation between EUAs and nat gas prices. That correlation is still fully intact and possibly even stronger than ever as traders increasingly takes this correlation as a given with possible amplification through trading action.
The correlation broke down in 2022 as nat gas prices went ballistic but overall the relationship has been very strong for quite a few years.
The correlation between nat gas and EUAs should be positive as long as there is a dynamical mix of coal and gas in EU power sector and the EUA market is neither too tight nor too weak:
Nat gas price UP => ”you go black” by using more coal => higher emissions => EUA price UP
But in the future we’ll go beyond the dynamically capacity to flex between nat gas and coal. As the EUA price moves yet higher along with a tightening carbon market the dynamical coal to gas flex will max out. The EUA price will then trade significantly above where this flex technically will occur. There will still be quite a few coal fired power plants running since they are needed for grid stability and supply amid constrained local grids.
As it looks now we still have such overall coal to gas flex in 2024 and partially in 2025, but come 2026 it could be all maxed out. At least if we look at implied pricing on the forward curves where the forward EUA price for 2026 and 2027 are trading way above technical coal to gas differentials. The current forward pricing implications matches well with what we theoretically expect to see as the EUA market gets tighter and marginal abatement moves from the power sector to the industrial sector. The EUA price should then trade up and way above the technical coal to gas differentials. That is also what we see in current forward prices for 2026 and 2027.
The correlation between nat gas and EUAs should then (2026/27 onward) switch from positive to negative. What is left of coal in the power mix will then no longer be dynamically involved versus nat gas and EUAs. The overall power price will then be ruled by EUA prices, nat gas prices and renewable penetration. There will be pockets with high cost power in the geographical points where there are no other alternatives than coal.
The EUA price is an added cost of energy as long as we consume fossil energy. Thus both today and in future years we’ll have the following as long as we consume fossil energy:
EUA price UP => Pain for consumers of energy => lower energy consumption, faster implementation of energy efficiency and renewable energy => lower emissions
The whole idea with the EUA price is after all that emissions goes down when the EUA price goes up. Either due to reduced energy consumption directly, accelerated energy efficiency measures or faster switch to renewable energy etc.
Let’s say that the coal to gas flex is maxed out with an EUA price way above the technical coal to gas differentials in 2026/27 and later. If the nat gas price then goes up it will no longer be an option to ”go black” and use more coal as the distance to that is too far away price vise due to a tight carbon market and a high EUA price. We’ll then instead have that:
Nat gas higher => higher energy costs with pain for consumers => weaker nat gas / energy demand & stronger drive for energy efficiency implementation & stronger drive for more non-fossil energy => lower emissions => EUA price lower
And if nat gas prices goes down it will give an incentive to consume more nat gas and thus emit more CO2:
Cheaper nat gas => Cheaper energy costs altogether, higher energy and nat gas consumption, less energy efficiency implementations in the broader economy => emissions either goes up or falls slower than before => EUA price UP
Historical and current positive correlation between nat gas and EUA prices should thus not at all be taken for granted for ever and we do expect this correlation to switch to negative some time in 2026/27.
In the UK there is hardly any coal left at all in the power mix. There is thus no option to ”go black” and burn more coal if the nat gas price goes up. A higher nat gas price will instead inflict pain on consumers of energy and lead to lower energy consumption, lower nat gas consumption and lower emissions on the margin. There is still some positive correlation left between nat gas and UKAs but it is very weak and it could relate to correlations between power prices in the UK and the continent as well as some correlations between UKAs and EUAs.
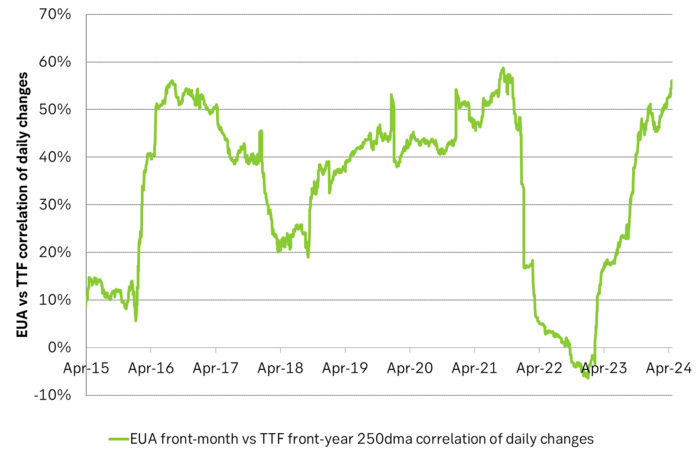
Correlation of daily changes in front month EUA prices and front-year TTF nat gas prices, 250dma correlation.
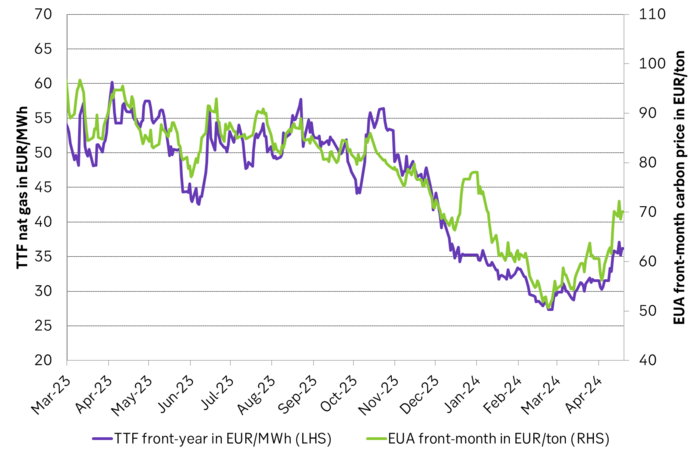
EUA price vs front-year TTF nat gas price since March 2023
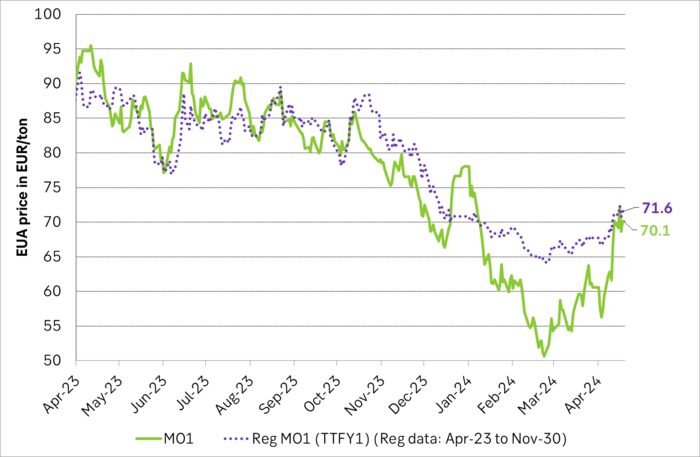
Front-month EUA price vs regression function of EUA price vs. nat gas derived from data from Apr to Nov last year.
The EUA price vs the UKA price. Correlations previously, but not much any more.
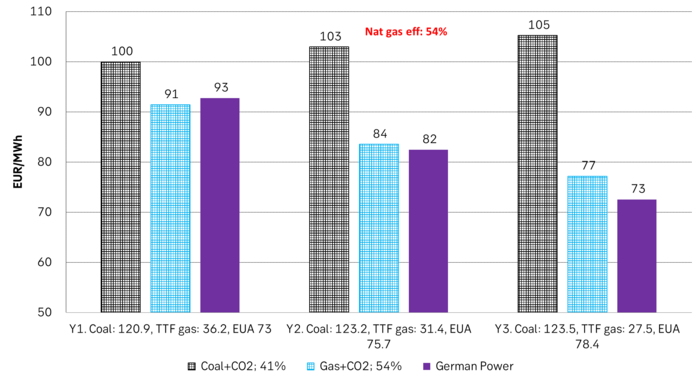
Forward German power prices versus clean cost of coal and clean cost of gas power. Coal is totally priced out vs power and nat gas on a forward 2026/27 basis.
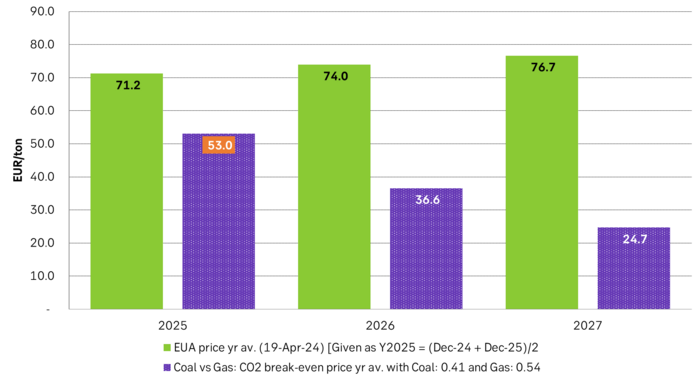
Forward price of EUAs versus technical level where dynamical coal to gas flex typically takes place. EUA price for 2026/27 is at a level where there is no longer any price dynamical interaction or flex between coal and nat gas. The EUA price should/could then start to be negatively correlated to nat gas.
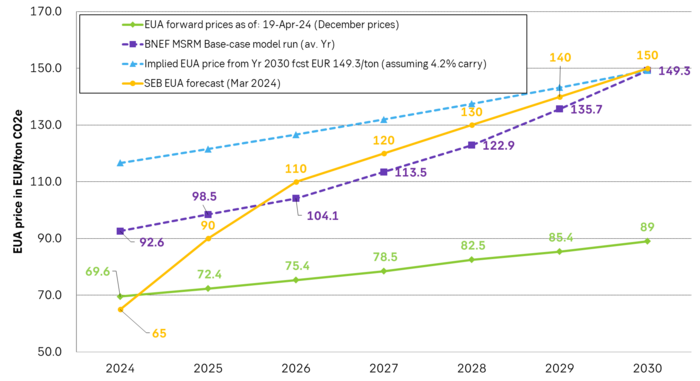
Forward EAU price vs. BNEF base model run (look for new update will come in late April), SEB’s EUA price forecast.
Brent crude spikes to USD 90.75/b before falling back as Iran plays it down. Brent crude fell sharply on Wednesday following fairly bearish US oil inventory data and yesterday it fell all the way to USD 86.09/b before a close of USD 87.11/b. Quite close to where Brent traded before the 1 April attack. This morning Brent spiked back up to USD 90.75/b (+4%) on news of Israeli retaliatory attack on Iran. Since then it has quickly fallen back to USD 88.2/b, up only 1.3% vs. ydy close.
The fear is that we are on an escalating tit-for-tat retaliatory path. Following explosions in Iran this morning the immediate fear was that we now are on a tit-for-tat escalating retaliatory path which in the could end up in an uncontrollable war where the US unwillingly is pulled into an armed conflict with Iran. Iran has however largely diffused this fear as it has played down the whole thing thus signalling that the risk for yet another leg higher in retaliatory strikes from Iran towards Israel appears low.
The hope is that the retaliatory strikes will be fading in magnitude and then fizzle out. What we can hope for is that the current tit-for-tat retaliatory strikes are fading in magnitude rather than rising in magnitude. Yes, Iran may retaliate to what Israel did this morning, but the hope if it does is that it is of fading magnitude rather than escalating magnitude.
Israel is playing with ”US house money”. What is very clear is that neither the US nor Iran want to end up in an armed conflict with each other. The US concern is that it involuntary is dragged backwards into such a conflict if Israel cannot control itself. As one US official put it: ”Israel is playing with (US) house money”. One can only imagine how US diplomatic phone lines currently are running red-hot with frenetic diplomatic efforts to try to defuse the situation.
It will likely go well as neither the US nor Iran wants to end up in a military conflict with each other. The underlying position is that both the US and Iran seems to detest the though of getting involved in a direct military conflict with each other and that the US is doing its utmost to hold back Israel. This is probably going a long way to convince the market that this situation is not going to fully blow up.
The oil market is nonetheless concerned as there is too much oil supply at stake. The oil market is however still naturally concerned and uncomfortable about the whole situation as there is so much oil supply at stake if the situation actually did blow up. Reports of traders buying far out of the money call options is a witness of that.


Also OPEC+ wants to get compensation for inflation

Oljan letar efter en högre botten

Börsveckan ger en köprekommendation till aktien i oljeservicebolaget Beerenberg
Nat gas to EUA correlation will likely switch to negative in 2026/27 onward

AI ökar det totala elbehovet i USA med 100 % kommande 15 år

Guldpriset når nytt all time high och bryter igenom 2300 USD

Lundin Mining får köprekommendation av BMO

Vertikal prisuppgång på kakao – priset toppar nu 9000 USD

Centralbanker fortsatte att köpa guld under februari

USAs stigande konsumtion av naturgas
-
 Nyheter3 veckor sedan
Guldpriset når nytt all time high och bryter igenom 2300 USD
-
 Nyheter4 veckor sedan
Lundin Mining får köprekommendation av BMO
-
 Nyheter4 veckor sedan
Vertikal prisuppgång på kakao – priset toppar nu 9000 USD
-
 Nyheter3 veckor sedan
Centralbanker fortsatte att köpa guld under februari
-
 Nyheter2 veckor sedan
USAs stigande konsumtion av naturgas
-

 Nyheter2 veckor sedan
Kakaomarknaden är extrem för tillfället
-

 Nyheter3 veckor sedan
Hur mår den svenska skogsbraschen? Två favoritaktier
-

 Nyheter4 veckor sedan
Boliden på 20 minuter