

Analys
SHB Råvarubrevet 12 augusti 2014

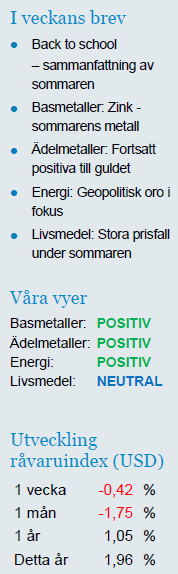 Back to school
– sammanfattning av sommaren
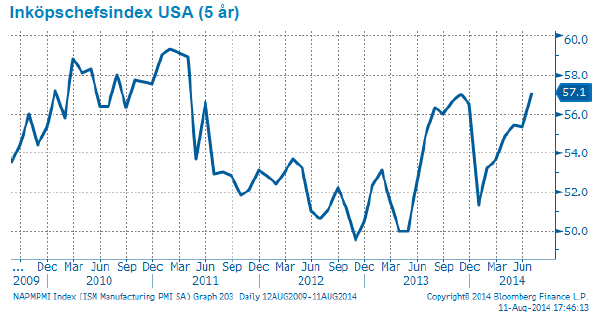
Makromässigt har sommarens data från USA varit stabil och något över förväntan, främst inköpschefsindex som sköt upp till årshögsta i juli ligger i en fin stigande trend efter bottenkänningen under den smällkalla februari.
Kinadata har visat tecken på återhämtning efter den extremt svaga våren. Kinesiska ledare sjösatte dock en serie av ministimulanser och de positiva effekterna från dessa kan nu skönjas i makrodata. Europadata har däremot varit fortsatt sämre än väntat men utan ytterligare dramatik.
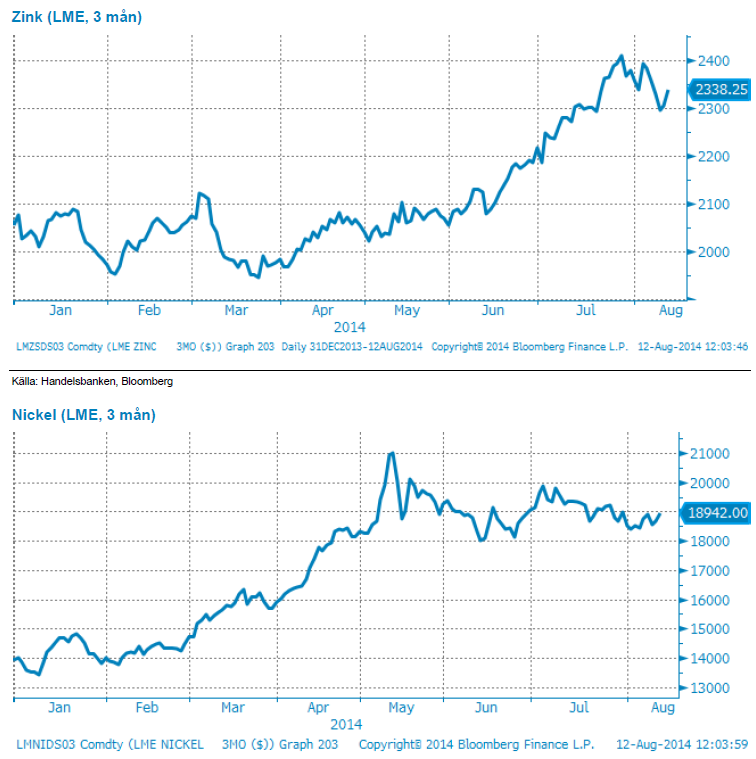
Basmetaller: Zink – sommarens metall
Under sommaren har dock råvarorna handlats relativt lite på makrodata och desto mer på den geopolitiska utvecklingen. För metallmarknaden är det Ryssland/Ukraina som är viktigast medan oljan handlas upp och ner med utvecklingen kring Irak i centrum.
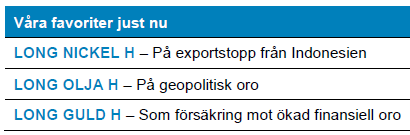
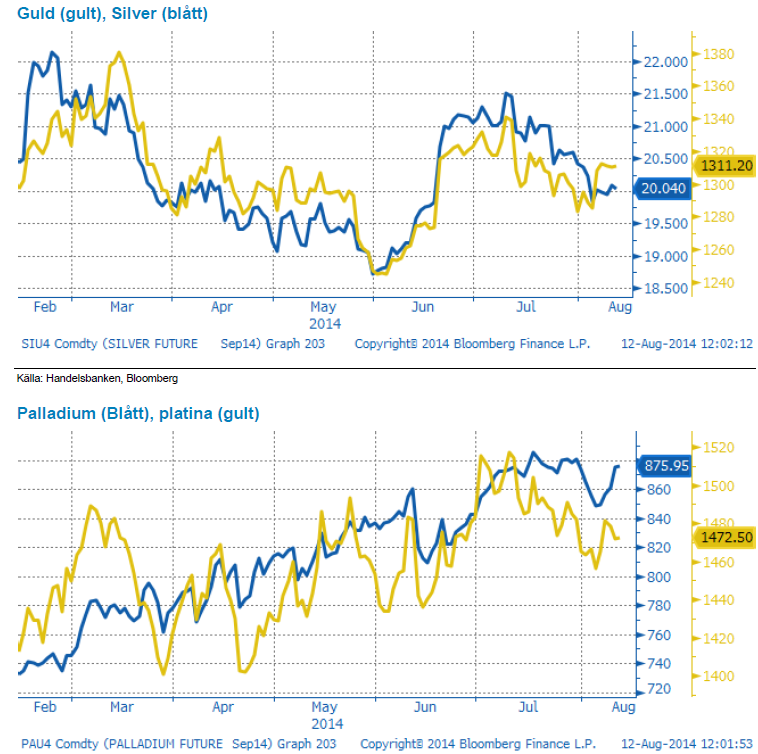
Zink har varit sommarens basmetall och stigit drygt 10 % över semestern, nu verkar dock rallyt ha gått i stå. Zink har en allt tightare utbudsbalans framför sig men vi tror det dröjer något före rallyt går vidare. Nickel var vårens raket men har handlats lugnt över sommaren. Indonesiens exportförbud består och vi tror att det kommer driva nickelpriset vidare uppåt. Indonesiens presidentval är avklarat men den nyvalde Jakowi tillträder inte förrän i oktober. Före dess sannolikt inget nytt på nickelmarknaden.
Ädelmetaller: Fortsatt positiva till guldet
Guldpriset har stigit under sommaren, men den största anledningen är inte geopolitisk oro, utan framför allt fortsatt fallande räntor globalt. Den största uppgången för guldet under sommaren kom efter att Fed var mer duvaktiga vid sitt möte i mitten av juni, och de senaste veckornas geopolitiska oro har bara haft marginell påverkan på ädelmetallerna.
Vi har fortfarande en positiv syn på guldet, men det kommer att vara den känsliga balansen mellan geopolitiska spänningar och dess konsekvenser å ena sidan, och löneutveckling och därtill kopplad räntepolitik i USA å andra sidan som avgör vart priset går. Det är viktigt att ha i bakhuvudet att september brukar vara en månad då väldigt mycket händer, och att risknivån generellt i marknaden är hög för tillfället. En lång guldposition kan visa sig vara en nyttig försäkring om finansmarknaderna blir mer turbulenta under höstens inledning.
Energi: Geopolitisk oro i fokus
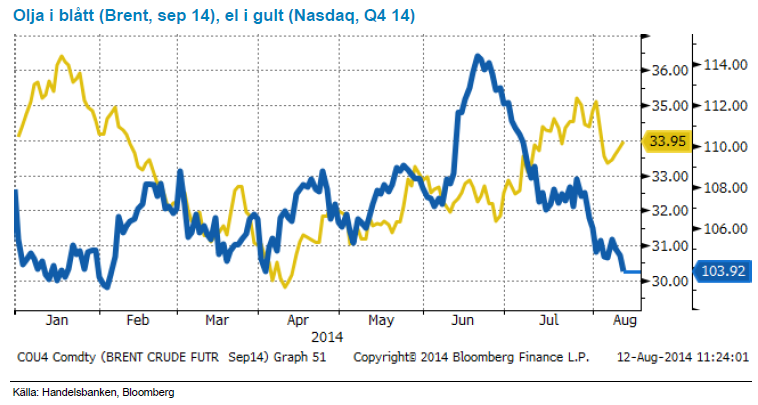
I oljemarknaden har den politiska utvecklingen i Ryssland/Ukraina samt Mellanöstern överskuggat den normalt starka efterfrågan under sommaren från ”driving season”, och både brent och den USA-handlade WTI har fallit kraftigt sedan toppen i juni.
Trots ett flertal pågående geopolitiska konflikter fortsätter oljan att falla och Brent handlas nu på niomånaders lägsta nivå bl.a. efter att amerikanska luftangrepp mot terrororganisationen IS i Irak anses minska risken för utbudsstörningar (90 procent av Iraks produktion är i landets södra delar och långt från oroligheterna). Att oljan nu handlas på lägre nivå än innan dessa två konflikter visar att fler tror på en bättre balans. Visst kan Saudi fortsatt skjuta till om det krisar och USA:s ökade produktion är även den starkt bidragande till tron om en bättre balans, hade det inte varit för skifferboomen i USA hade oljan handlas uppemot 30 dollar högre enligt vissa estimat. Libyen och Irak fortsätter dock att vara två stora frågetecken (Irak står för ca 3.6% av global produktion, har stora reserver och produktionskostnaderna är bland de lägsta i världen där man räknar med att kunna dubbla produktionen inom de närmsta 20 åren till närmare 7.9 miljoner fat per dag). Vi tror att risken för utbudsstörningar är fortsatt stor och lägg därtill den säsongsmässigt starka efterfrågan under Q3. Vi tror därför att en riskpremie, större än vad som prisats in, är motiverad vilket gör oljan köpvärd på dessa nivåer.
Elmarknaden handlas relativt oförändrat över sommaren men steg tillfälligt på en förnyad oro för Ryssland/Ukraina och Europas energileveranser som gav anledning till att täcka korta positioner på främst energikol och gas. Den uppgången kom dock av sig efter att Putin meddelat att energi inte skulle inkluderas i Rysslands sanktionslista. Utsläppsrätterna har stigit fyra veckor i rad och noterades på EUR 6.36 som högst (EUR 5.10 början av juni) efter att EU Kommissionen överväger att driva igenom en snabbare lösning på överskottsproblemet samtidigt som auktionsnivåerna/intresset från energibolagen varit höga. Inget konkret har noterats samtidigt som marginalen från att köra kol i förhållande till gas gör att efterfrågan minskar och vi är nu tillbaka kring 6 nivån. Ett torrt väder gav också stöd åt elmarknaden under juli där underskottet var närmare 8 TWh som mest vid månadsskiftet. Efter de två senaste veckornas nederbörd och med prognoserna som ligger bör underskottet nu vara reducerat till ca 4 TWh. Och bara för att nämna kärnkraften så är den svenska nu på väg uppåt och opererar med 76 procent av kapaciteten tillsammans med den finska. Vi förväntar oss att elmarknaden handlas neutralt till negativt på kort sikt eftersom det utan bränsleprisuppgångar är svårt att se vad som skall driva marknaden uppåt.
Livsmedel: Stora prisfall under sommaren
Tidigare prognoser om stora spannmålsskördar har infriats – avkastningen på både vete och korn och även oljeväxter har generellt sett varit hög på norra halvklotet. Än så länge finns heller inga skäl att misstro höga förväntningar om en stor kommande amerikansk majsskörd, som startar om bara några veckor. Samma gäller för den amerikanska sojaskörden som ser ut att bli den största någonsin.
International Grains Council, IGC, beräknar i sin senaste prognos den totala globala spannmålsskörden säsongen 2014/15 till 1.959 miljoner ton – upp 10 miljoner ton jämfört med 2013/14 som också var en bra skördesäsong. Globala sojaproduktionen uppskattar IGC till rekordhöga 304 miljoner ton. Intressant är att produktionsnivå för Ukraina, vilket varit ett orosmoment hela våren, uppskattas till ungefär densamma som förra året och exportvolymen t.o.m. något högre.
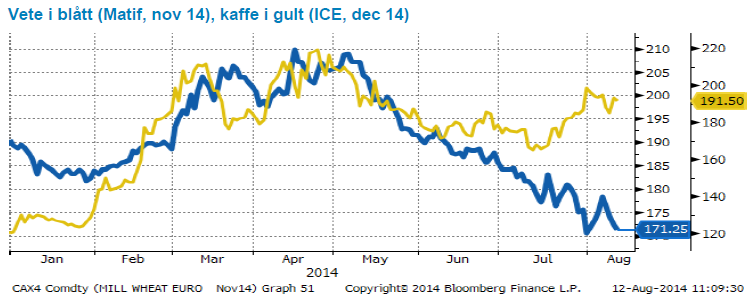
Dessa volymer innebär stigande lagernivåer och följaktligen även fallande priser – vilket vi fått se under de senaste månaderna. Mycket nederbörd i inte minst Frankrike och Tyskland har visserligen lett till omfattande kvalitetsproblem för vetet men stora spannmålsvolymer totalt och bättre kvalitet på annat håll har pressat ned även det europeiska kvarnvetet (underliggande till våra vetecertifikat). Vi fick se en tillfällig uppgång i vetepriset efter meddelande från Ryssland i förra veckan om importbegränsningar av olika livsmedel från sanktionsförande länder. Prisuppgången raderas dock snabbt och visar på hur känslig vetemarknaden är för politisk oro. Efter att ha trott på lägre spannmålspriser i flera månader intar vi nu en neutral vy i väntan på höstsådden.
För kaffe har priset däremot stigit under sommaren till följd av nederbörd över normalen i Brasiliens viktigaste kafferegion, Minas Gerais. I dessa kaffeintensiva delar möts kaffeplantorna normalt av en regnperiod i början av året (sommar i regionen) följt av torrare och varmare klimat (mognadsfasen). Under vintermånaderna regnar det normalt mindre som också lämnar plats för skördearbetet. Vädret i år har minst sagt varit avvikande från det normala. Terminspriserna på Arabicakaffe har i år stigit över 85 procent, efter extrem torka under årets första månader och omfattningen av produktionsbortfallet har varit ett hett ämne under våren. Under mognadsperioden fick Brasiliens sydöstra delar till slut viss sol – priserna backade, och efter en tid med sidledes priser har nu senaste tidens skyfall försenat skördearbetet.
I juni publicerade amerikanska jordbruksdepartementet, USDA, sin prognos över 2014/2015 världsproduktionen av kaffe (arabica & robusta) som väntas landa på 148,7 miljoner bags (1 bag=60 kg), en minskning på 1,5 miljoner jämfört med föregående kaffeår. Konsumtionen och exporten väntas enligt rapporten att stiga. Brasilien som svarar för 70 procent av världens kaffeproduktion väntas minska sin produktion, medan Robustakaffe väntas nå rekordskördar för säsongen 2014/2015. Orsaken till dessa förväntningar är ökad avkastning som följd av nya kaffesorter samt ökad areal i framför allt Vietnam. Vädersituationen känns fortfarande instabil för årets skörd, varför vi är svagt positiva till neutrala på kort sikt. Ser till dagens prognoser för nästa års skörd tror vi däremot på handel kring 180 dollar/Ib under de kommande månaderna.
Handelsbankens råvaruindex (USD)
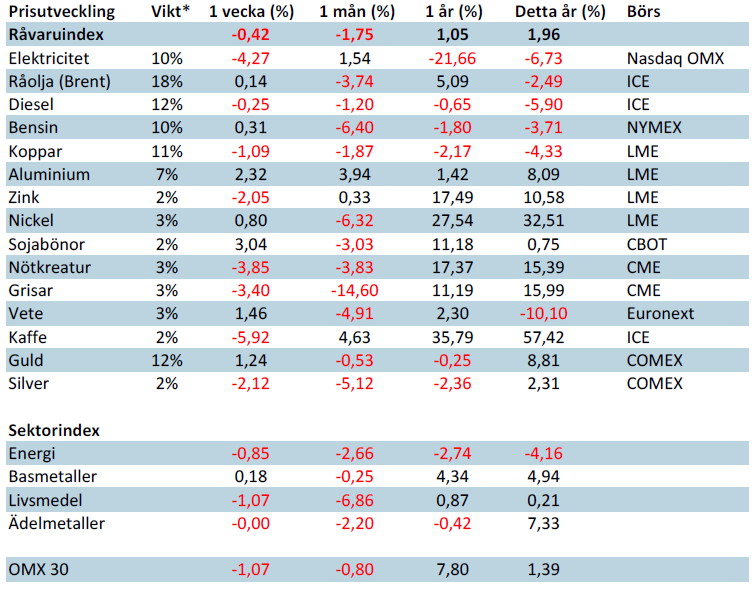
*Uppdaterade vikter från 29 november 2013
Handelsbankens råvaruindex består av de underliggande indexen för respektive råvara. Vikterna är bestämda till hälften från värdet av nordisk produktion (globala produktionen för sektorindex) och till hälften från likviditeten i terminskontrakten.
[box]SHB Råvarubrevet är producerat av Handelsbanken och publiceras i samarbete och med tillstånd på Råvarumarknaden.se[/box]
Ansvarsbegränsning
Detta material är producerat av Svenska Handelsbanken AB (publ) i fortsättningen kallad Handelsbanken. De som arbetar med innehållet är inte analytiker och materialet är inte oberoende investeringsanalys. Innehållet är uteslutande avsett för kunder i Sverige. Syftet är att ge en allmän information till Handelsbankens kunder och utgör inte ett personligt investeringsråd eller en personlig rekommendation. Informationen ska inte ensamt utgöra underlag för investeringsbeslut. Kunder bör inhämta råd från sina rådgivare och basera sina investeringsbeslut utifrån egen erfarenhet.
Informationen i materialet kan ändras och också avvika från de åsikter som uttrycks i oberoende investeringsanalyser från Handelsbanken. Informationen grundar sig på allmänt tillgänglig information och är hämtad från källor som bedöms som tillförlitliga, men riktigheten kan inte garanteras och informationen kan vara ofullständig eller nedkortad. Ingen del av förslaget får reproduceras eller distribueras till någon annan person utan att Handelsbanken dessförinnan lämnat sitt skriftliga medgivande. Handelsbanken ansvarar inte för att materialet används på ett sätt som strider mot förbudet mot vidarebefordran eller offentliggörs i strid med bankens regler.


Brent crude has fallen USD 3/b since the peak of Iran-Israel concerns last week. Still lots of talk about significant Mid-East risk premium in the current oil price. But OPEC+ is in no way anywhere close to loosing control of the oil market. Thus what will really matter is what OPEC+ decides to do in June with respect to production in Q3-24 and the market knows this very well. Saudi Arabia’s social cost-break-even is estimated at USD 100/b today. Also Saudi Arabia’s purse is hurt by 21% US inflation since Jan 2020. Saudi needs more money to make ends meet. Why shouldn’t they get a higher nominal pay as everyone else. Saudi will ask for it

Brent is down USD 3/b vs. last week as the immediate risk for Iran-Israel has faded. But risk is far from over says experts. The Brent crude oil price has fallen 3% to now USD 87.3/b since it became clear that Israel was willing to restrain itself with only a muted counter attack versus Israel while Iran at the same time totally played down the counterattack by Israel. The hope now is of course that that was the end of it. The real fear has now receded for the scenario where Israeli and Iranian exchanges of rockets and drones would escalate to a point where also the US is dragged into it with Mid East oil supply being hurt in the end. Not everyone are as optimistic. Professor Meir Javedanfar who teaches Iranian-Israeli studies in Israel instead judges that ”this is just the beginning” and that they sooner or later will confront each other again according to NYT. While the the tension between Iran and Israel has faded significantly, the pain and anger spiraling out of destruction of Gaza will however close to guarantee that bombs and military strifes will take place left, right and center in the Middle East going forward.
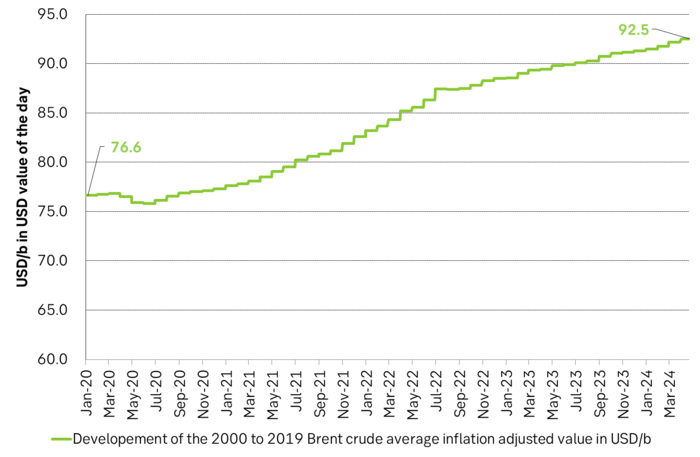
Also OPEC+ wants to get paid. At the start of 2020 the 20 year inflation adjusted average Brent crude price stood at USD 76.6/b. If we keep the averaging period fixed and move forward till today that inflation adjusted average has risen to USD 92.5/b. So when OPEC looks in its purse and income stream it today needs a 21% higher oil price than in January 2020 in order to make ends meet and OPEC(+) is working hard to get it.
Much talk about Mid-East risk premium of USD 5-10-25/b. But OPEC+ is in control so why does it matter. There is much talk these days that there is a significant risk premium in Brent crude these days and that it could evaporate if the erratic state of the Middle East as well as Ukraine/Russia settles down. With the latest gains in US oil inventories one could maybe argue that there is a USD 5/b risk premium versus total US commercial crude and product inventories in the Brent crude oil price today. But what really matters for the oil price is what OPEC+ decides to do in June with respect to Q3-24 production. We are in no doubt that the group will steer this market to where they want it also in Q3-24. If there is a little bit too much oil in the market versus demand then they will trim supply accordingly.
Also OPEC+ wants to make ends meet. The 20-year real average Brent price from 2000 to 2019 stood at USD 76.6/b in Jan 2020. That same averaging period is today at USD 92.5/b in today’s money value. OPEC+ needs a higher nominal price to make ends meet and they will work hard to get it.
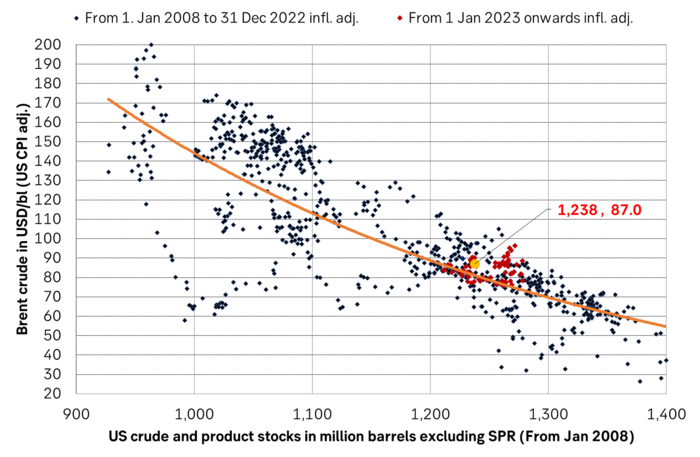
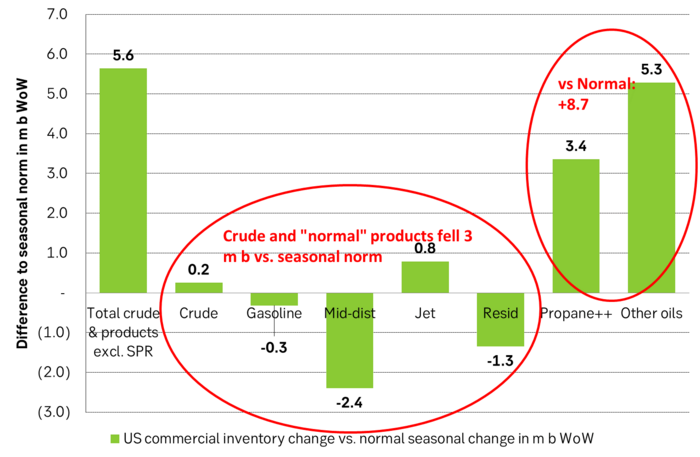
Inflation adjusted Brent crude price versus total US commercial crude and product stocks. A bit above the regression line. Maybe USD 5/b risk premium. But type of inventories matter. Latest big gains were in Propane and Other oils and not so much in crude and products
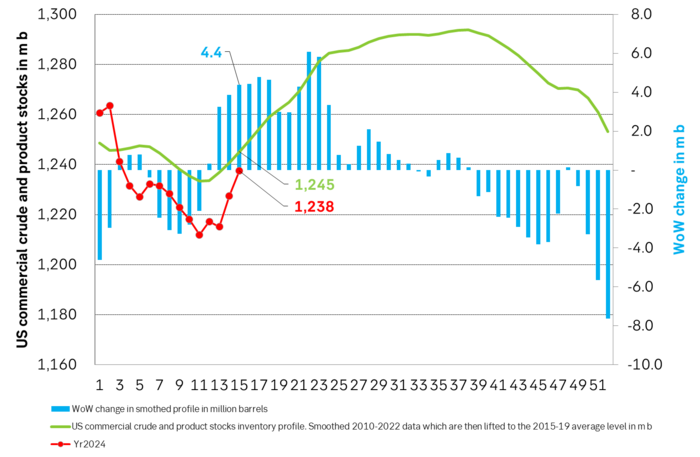
Total US commercial crude and product stocks usually rise by 4-5 m b per week this time of year. Gains have been very strong lately, but mostly in Propane and Other oils
Last week’s US inventory data. Big rise of 10 m b in commercial inventories. What really stands out is the big gains in Propane and Other oils
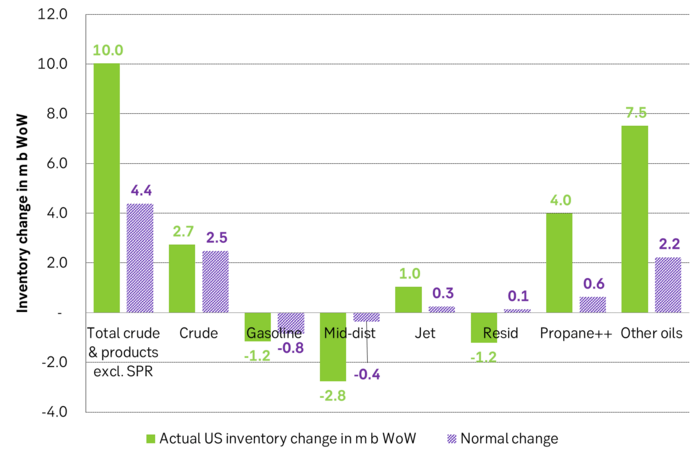
Take actual changes minus normal seasonal changes we find that US commercial crude and regular products like diesel, gasoline, jet and bunker oil actually fell 3 m b versus normal change.
Historically positive Nat gas to EUA correlation will likely switch to negative in 2026/27 onward
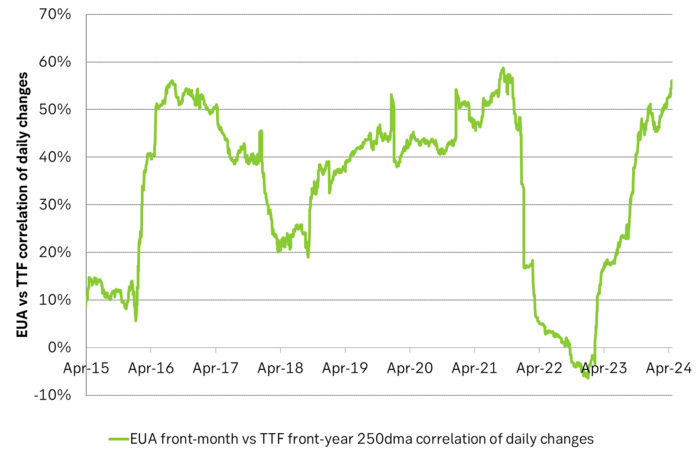
Historically there has been a strong, positive correlation between EUAs and nat gas prices. That correlation is still fully intact and possibly even stronger than ever as traders increasingly takes this correlation as a given with possible amplification through trading action.
The correlation broke down in 2022 as nat gas prices went ballistic but overall the relationship has been very strong for quite a few years.
The correlation between nat gas and EUAs should be positive as long as there is a dynamical mix of coal and gas in EU power sector and the EUA market is neither too tight nor too weak:
Nat gas price UP => ”you go black” by using more coal => higher emissions => EUA price UP
But in the future we’ll go beyond the dynamically capacity to flex between nat gas and coal. As the EUA price moves yet higher along with a tightening carbon market the dynamical coal to gas flex will max out. The EUA price will then trade significantly above where this flex technically will occur. There will still be quite a few coal fired power plants running since they are needed for grid stability and supply amid constrained local grids.
As it looks now we still have such overall coal to gas flex in 2024 and partially in 2025, but come 2026 it could be all maxed out. At least if we look at implied pricing on the forward curves where the forward EUA price for 2026 and 2027 are trading way above technical coal to gas differentials. The current forward pricing implications matches well with what we theoretically expect to see as the EUA market gets tighter and marginal abatement moves from the power sector to the industrial sector. The EUA price should then trade up and way above the technical coal to gas differentials. That is also what we see in current forward prices for 2026 and 2027.
The correlation between nat gas and EUAs should then (2026/27 onward) switch from positive to negative. What is left of coal in the power mix will then no longer be dynamically involved versus nat gas and EUAs. The overall power price will then be ruled by EUA prices, nat gas prices and renewable penetration. There will be pockets with high cost power in the geographical points where there are no other alternatives than coal.
The EUA price is an added cost of energy as long as we consume fossil energy. Thus both today and in future years we’ll have the following as long as we consume fossil energy:
EUA price UP => Pain for consumers of energy => lower energy consumption, faster implementation of energy efficiency and renewable energy => lower emissions
The whole idea with the EUA price is after all that emissions goes down when the EUA price goes up. Either due to reduced energy consumption directly, accelerated energy efficiency measures or faster switch to renewable energy etc.
Let’s say that the coal to gas flex is maxed out with an EUA price way above the technical coal to gas differentials in 2026/27 and later. If the nat gas price then goes up it will no longer be an option to ”go black” and use more coal as the distance to that is too far away price vise due to a tight carbon market and a high EUA price. We’ll then instead have that:
Nat gas higher => higher energy costs with pain for consumers => weaker nat gas / energy demand & stronger drive for energy efficiency implementation & stronger drive for more non-fossil energy => lower emissions => EUA price lower
And if nat gas prices goes down it will give an incentive to consume more nat gas and thus emit more CO2:
Cheaper nat gas => Cheaper energy costs altogether, higher energy and nat gas consumption, less energy efficiency implementations in the broader economy => emissions either goes up or falls slower than before => EUA price UP
Historical and current positive correlation between nat gas and EUA prices should thus not at all be taken for granted for ever and we do expect this correlation to switch to negative some time in 2026/27.
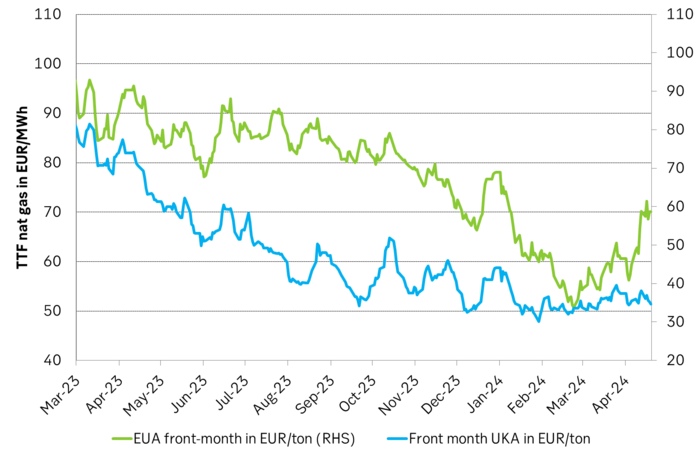
In the UK there is hardly any coal left at all in the power mix. There is thus no option to ”go black” and burn more coal if the nat gas price goes up. A higher nat gas price will instead inflict pain on consumers of energy and lead to lower energy consumption, lower nat gas consumption and lower emissions on the margin. There is still some positive correlation left between nat gas and UKAs but it is very weak and it could relate to correlations between power prices in the UK and the continent as well as some correlations between UKAs and EUAs.
Correlation of daily changes in front month EUA prices and front-year TTF nat gas prices, 250dma correlation.
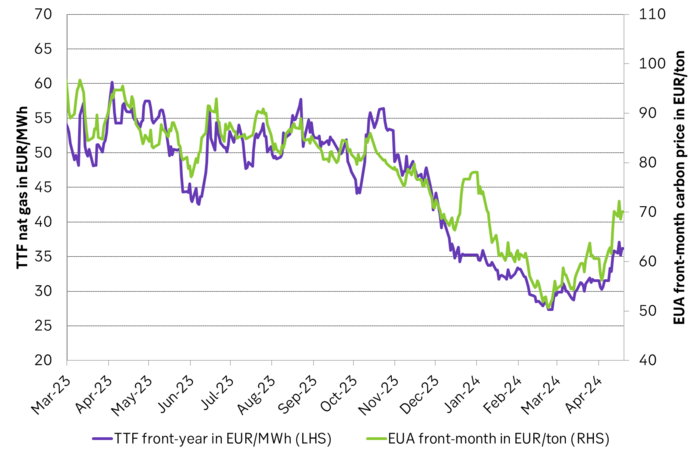
EUA price vs front-year TTF nat gas price since March 2023
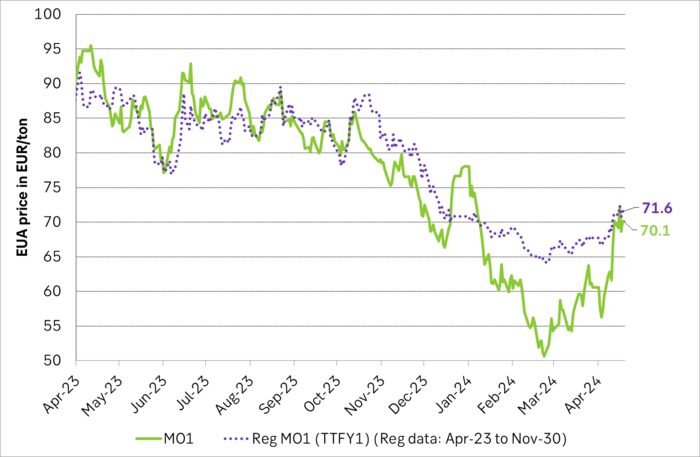
Front-month EUA price vs regression function of EUA price vs. nat gas derived from data from Apr to Nov last year.
The EUA price vs the UKA price. Correlations previously, but not much any more.
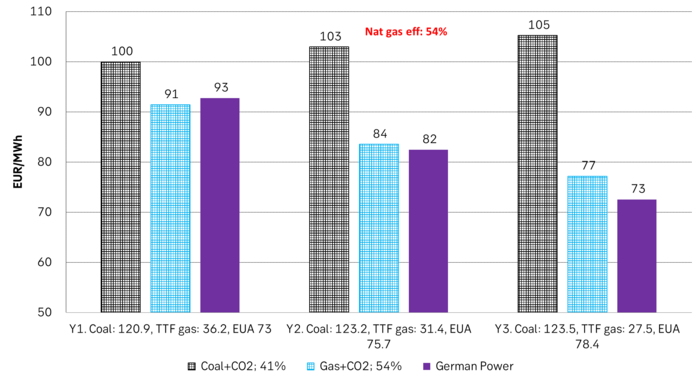
Forward German power prices versus clean cost of coal and clean cost of gas power. Coal is totally priced out vs power and nat gas on a forward 2026/27 basis.
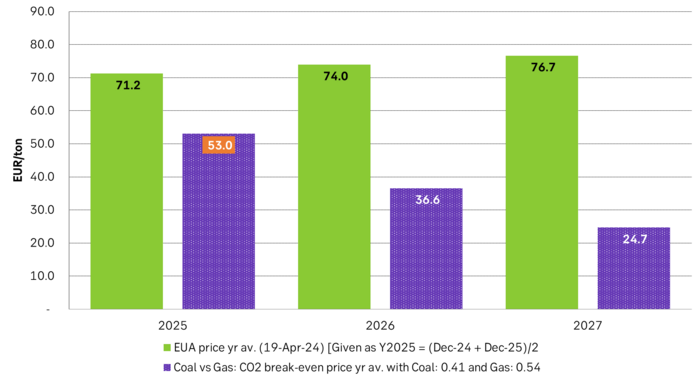
Forward price of EUAs versus technical level where dynamical coal to gas flex typically takes place. EUA price for 2026/27 is at a level where there is no longer any price dynamical interaction or flex between coal and nat gas. The EUA price should/could then start to be negatively correlated to nat gas.
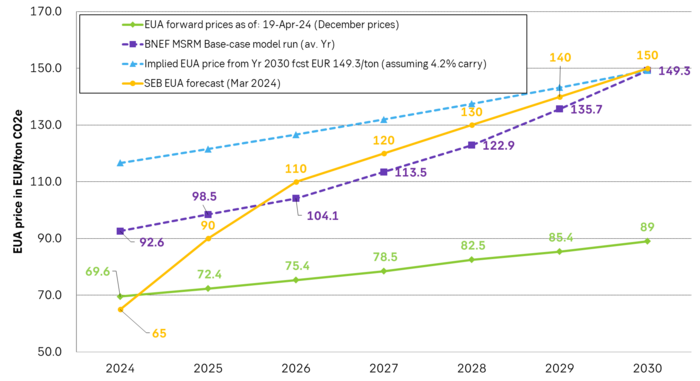
Forward EAU price vs. BNEF base model run (look for new update will come in late April), SEB’s EUA price forecast.
Brent crude spikes to USD 90.75/b before falling back as Iran plays it down. Brent crude fell sharply on Wednesday following fairly bearish US oil inventory data and yesterday it fell all the way to USD 86.09/b before a close of USD 87.11/b. Quite close to where Brent traded before the 1 April attack. This morning Brent spiked back up to USD 90.75/b (+4%) on news of Israeli retaliatory attack on Iran. Since then it has quickly fallen back to USD 88.2/b, up only 1.3% vs. ydy close.
The fear is that we are on an escalating tit-for-tat retaliatory path. Following explosions in Iran this morning the immediate fear was that we now are on a tit-for-tat escalating retaliatory path which in the could end up in an uncontrollable war where the US unwillingly is pulled into an armed conflict with Iran. Iran has however largely diffused this fear as it has played down the whole thing thus signalling that the risk for yet another leg higher in retaliatory strikes from Iran towards Israel appears low.
The hope is that the retaliatory strikes will be fading in magnitude and then fizzle out. What we can hope for is that the current tit-for-tat retaliatory strikes are fading in magnitude rather than rising in magnitude. Yes, Iran may retaliate to what Israel did this morning, but the hope if it does is that it is of fading magnitude rather than escalating magnitude.
Israel is playing with ”US house money”. What is very clear is that neither the US nor Iran want to end up in an armed conflict with each other. The US concern is that it involuntary is dragged backwards into such a conflict if Israel cannot control itself. As one US official put it: ”Israel is playing with (US) house money”. One can only imagine how US diplomatic phone lines currently are running red-hot with frenetic diplomatic efforts to try to defuse the situation.
It will likely go well as neither the US nor Iran wants to end up in a military conflict with each other. The underlying position is that both the US and Iran seems to detest the though of getting involved in a direct military conflict with each other and that the US is doing its utmost to hold back Israel. This is probably going a long way to convince the market that this situation is not going to fully blow up.
The oil market is nonetheless concerned as there is too much oil supply at stake. The oil market is however still naturally concerned and uncomfortable about the whole situation as there is so much oil supply at stake if the situation actually did blow up. Reports of traders buying far out of the money call options is a witness of that.


Also OPEC+ wants to get compensation for inflation

Oljan letar efter en högre botten

Börsveckan ger en köprekommendation till aktien i oljeservicebolaget Beerenberg
Nat gas to EUA correlation will likely switch to negative in 2026/27 onward

AI ökar det totala elbehovet i USA med 100 % kommande 15 år

Guldpriset når nytt all time high och bryter igenom 2300 USD

Lundin Mining får köprekommendation av BMO

Vertikal prisuppgång på kakao – priset toppar nu 9000 USD

Centralbanker fortsatte att köpa guld under februari

USAs stigande konsumtion av naturgas
-
 Nyheter3 veckor sedan
Guldpriset når nytt all time high och bryter igenom 2300 USD
-
 Nyheter4 veckor sedan
Lundin Mining får köprekommendation av BMO
-
 Nyheter4 veckor sedan
Vertikal prisuppgång på kakao – priset toppar nu 9000 USD
-
 Nyheter3 veckor sedan
Centralbanker fortsatte att köpa guld under februari
-
 Nyheter2 veckor sedan
USAs stigande konsumtion av naturgas
-

 Nyheter3 veckor sedan
Hur mår den svenska skogsbraschen? Två favoritaktier
-

 Nyheter2 veckor sedan
Kakaomarknaden är extrem för tillfället
-

 Nyheter3 veckor sedan
Boliden på 20 minuter