

Analys
Oil and Dollar – A self-reinforcing feedback loop

 There is an intimate relationship between the oil price and the USD. Looking back at the crude oil price and the USD Index since 2013 they are mirror images of each other. We argue that it is not only a one way street from a weaker USD to a nominally higher crude oil price. There is also likely a link from a stronger crude oil price to a weaker USD as well. In addition we also have that OPEC & Co is forcing the oil price higher through their cuts while Donald Trump is promoting a softer USD amid a global economy which is reviving. We are currently in a Merry-go-round circle which is feeding on itself pushing crude prices higher, the USD lower which again is bullish for Emerging Markets which is bullish again for commodity demand,… If the circle is not stopped by verbal intervention from either OPEC & Co on the oil price or ECB on the Eurodollar side then this circle could spiral higher with Brent crude rising another 10% to $77/bl while the USD Index moves back to its 2014 level of 80 points. But both the dollar and crude prices are technically very stretch at the moment and ripe for corrections.
Price action – Higher on a softer USD and bullish WTI on Cushing draw
Yesterday the USD Index fell 1% while the Brent 1mth contract gained 0.8% to $70.53/bl. Brent crude thus actually fell 0.2% in real terms. The dollar was trading lower and lower all through the day. Brent crude also traded in bearish territory most of the day while it normally should have taken a bullish queue from the softer USD. The view that Brent has gone too far already probably weighted on the crude oil price. Brent was trying to move lower while the softening USD Index pulled stronger and stronger in the bullish direction.
Brent crude caved in to bullish push from the weaker dollar when the US inventory data came in at 16:30 CET. It showed that US crude stocks declined 1.1 m bl last week while the market had feared a gain of 4.8 m bl following the indicative numbers from API on Tuesday evening. Great relief. No decline. In addition the crude stocks in Cushing declined a full 3.2 m bl which gave a real boost to WTI crude prices relative to Brent crude. All in all for crude, gasoline and middle distillates there was a rise of 3.6 m bl which is not really all bullish. However, it was clearly bullish for WTI crude prices versus Brent and the whole mood just turned bullish. The Brent bears caved in to the bullish push from WTI and the strong bullish push from the weaker USD and up it went. This morning we have some follow-through as the USD Index declines another 0.2% while Brent trades 0.5% higher at $70.9/bl.
A higher crude oil price is dollar bearish – The feedback loop
A pure 50% devaluation of the USD would obviously lead to a doubling of the nominal crude oil price. The dollar is just a unit of measure. If the yardstick shrinks by 50% then the amount measured will have to double.
There is also another effect in reverse. If the crude oil price increases strongly then it is also dollar bearish and if it falls strongly it is dollar bullish. This is probably why we have such an incredible mirror image of the USD Index and the Brent crude oil price since 2013. The huge drop in the Brent crude oil price from mid-2014 was not driven by a weaker USD but by surplus crude and OPEC moving from a price game to a market share game.
In 2014 the US had a net petroleum import of 5 m bl/d and China imported of 6 m bl/d. Every dollar increase in the crude oil price results in a $4bn increase in the yearly expenditure of USD for China and US crude imports.
From mid-2014 the crude oil price moved from $110/bl to a low of $27/bl in early 2016. That is a decline of 83 dollar per barrel. If this difference sustained for a full year it would have and impact of $333bn. In comparison the US trade deficit is roughly $500bn per year. So the oil price drop equaled a 70% drop in the US trade deficit in terms of magnitude.
When the US spends USD on oil imports it receives crude oil and sends USD into the global market place. First into the pockets of global oil producers like Russia and OPEC. Then these dollars are spent in the global market place by them. A high crude oil price results in a larger flow of dollar from the US into the global market place and is thus dollar bearish. Russia for example will have a good dollar situation when the oil price is high as it receives a lot of USDs. A sharp decline in the oil price leads to less dollar being sent out of the US to global oil producers and into the global market place and is thus dollar bullish.
Most other countries than the US do not have this impact on the dollar cycle because they do not have dollar as their currency. When Europe for example purchases and imports crude oil it has to first buy the dollars in the global market place in exchange for euros. Then it spends the dollar for oil sending them to Russia and OPEC which then sends them back into the global market place when they spend it. Thus Europe’s oil imports are dollar neutral in terms of varying crude oil prices.
China is however a different case than most other countries. It has a dollar surplus to start with due to its trade surplus with the US. Normally this surplus of dollars are recirculated back into the US as China buys US treasuries, different bonds, equities or other US assets. A part of China’s dollar surplus is however spent on its crude oil imports and is thus fed to Russia or OPEC and then into the global market. China does not need to go into the market in the first place to purchase the dollar which it spends on crude oil imports. When the price of crude oil falls sharply then China will spend less of its surplus of dollar on crude oil and instead recirculate it back into the US by purchasing US assets. So a sharply lower oil price means China will feed a significantly lower amount of dollar into the global market place. Due to its dollar surplus and dollar recycling China is not dollar neutral in its crude oil import as Europe is.
The crude oil price has moved higher since early 2016 and sharply higher since June 2017. It has probably had an impact on the USD as it means a larger flow of dollar from the US and from China being fed into the global offshore dollar market via global oil producers like OPEC and Russia. It has relieved a dollar shortage among the world’s oil producers
At the moment there is thus likely a self-reinforcing cycle feeding a higher crude oil price and a softer USD. The USD is of course primed for weakness due to other reasons as well. That is also the case for Brent crude for which OPEC & Co has set the market up for tightness. So crude oil moves higher, the dollar moves lower which again implies a higher nominal crude price. The softer dollar is also EM bullish as it reduces their dollar payment burden of debt. So softer dollar leads to more bullish EM which again means stronger commodity demand and again a higher oil price. That’s a great Merry go round circle!
In the shorter term we are likely set for a correction in the dollar weakening. Verbal intervention from the ECB is probable. That would also likely be a trigger for a correction in Brent crude as it now has the most technically stretched level since 2011.
However, if there really is significant relationship going from the crude oil price to to dollar it means that the current crude oil price revival is now pointing us in the direction of a dollar Index level which we last saw back in 2014 which is another 10% lower at an index level of 80. A 10% softer USD also means a 10% nominally higher crude oil price. The current [oil to dollar] feeding cycle can thus go upwards/downwards to $77/bl for Brent crude oil and to 80 for the dollar index unless OPEC & Co stops the oil rally or the ECB stops the euro appreciation and the dollar weakening.
Chart 1: US dollar and oil – The mirror image
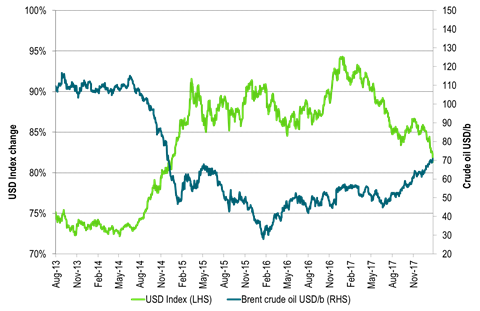
Chart 2: The market is tight as in 2013/14 shown by Brent spot versus Brent 1mth contract
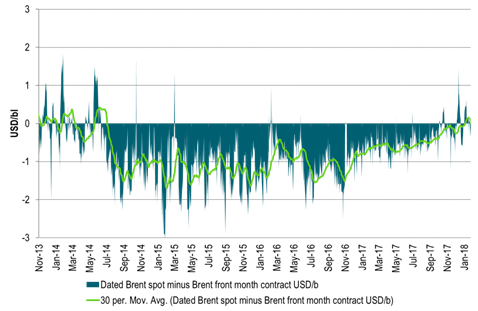
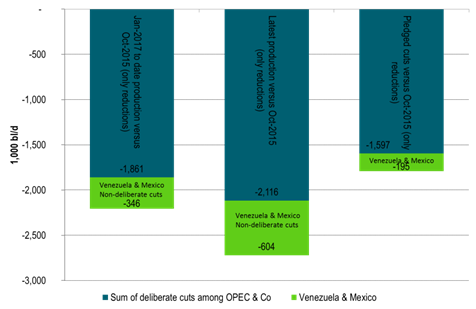
Chart 3: Deliberate OPEC & Co production cuts of 2.1 m bl/d
Sum of cuts not including gains by Libya, Nigeria etc
Kind regards
Bjarne Schieldrop
Chief analyst, Commodities
SEB Markets
Merchant Banking
Historically positive Nat gas to EUA correlation will likely switch to negative in 2026/27 onward

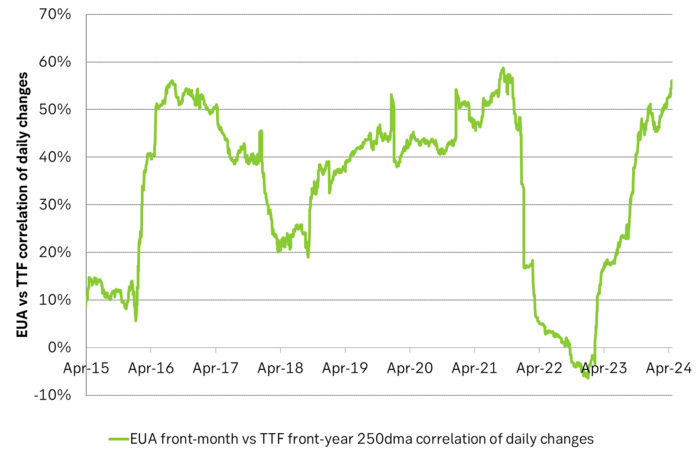
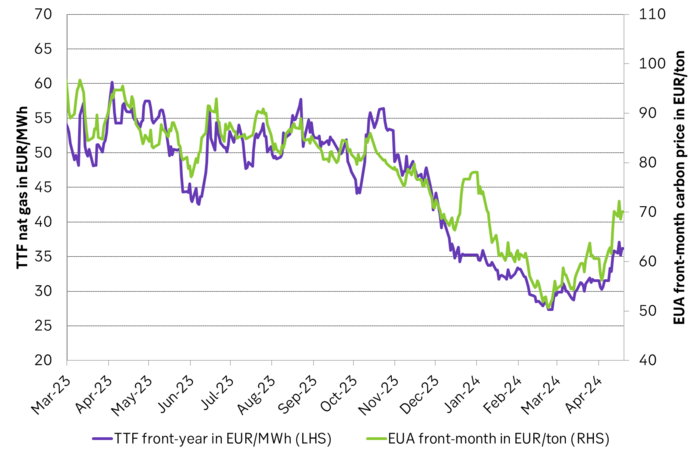
Historically there has been a strong, positive correlation between EUAs and nat gas prices. That correlation is still fully intact and possibly even stronger than ever as traders increasingly takes this correlation as a given with possible amplification through trading action.
The correlation broke down in 2022 as nat gas prices went ballistic but overall the relationship has been very strong for quite a few years.
The correlation between nat gas and EUAs should be positive as long as there is a dynamical mix of coal and gas in EU power sector and the EUA market is neither too tight nor too weak:
Nat gas price UP => ”you go black” by using more coal => higher emissions => EUA price UP
But in the future we’ll go beyond the dynamically capacity to flex between nat gas and coal. As the EUA price moves yet higher along with a tightening carbon market the dynamical coal to gas flex will max out. The EUA price will then trade significantly above where this flex technically will occur. There will still be quite a few coal fired power plants running since they are needed for grid stability and supply amid constrained local grids.
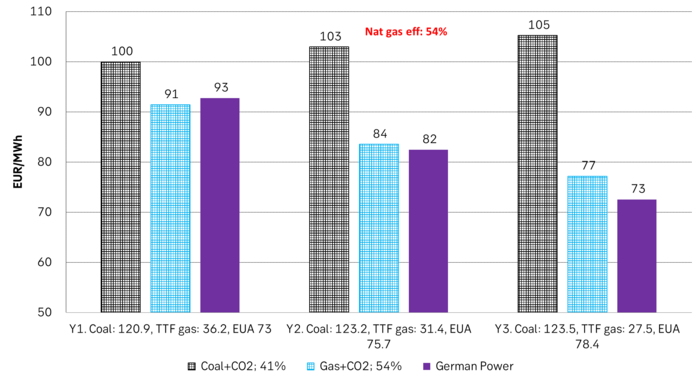
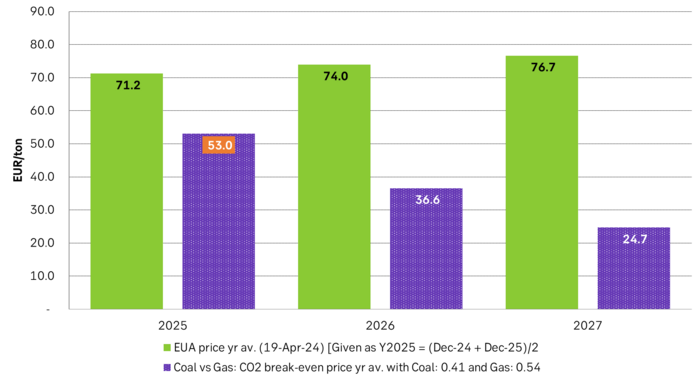
As it looks now we still have such overall coal to gas flex in 2024 and partially in 2025, but come 2026 it could be all maxed out. At least if we look at implied pricing on the forward curves where the forward EUA price for 2026 and 2027 are trading way above technical coal to gas differentials. The current forward pricing implications matches well with what we theoretically expect to see as the EUA market gets tighter and marginal abatement moves from the power sector to the industrial sector. The EUA price should then trade up and way above the technical coal to gas differentials. That is also what we see in current forward prices for 2026 and 2027.
The correlation between nat gas and EUAs should then (2026/27 onward) switch from positive to negative. What is left of coal in the power mix will then no longer be dynamically involved versus nat gas and EUAs. The overall power price will then be ruled by EUA prices, nat gas prices and renewable penetration. There will be pockets with high cost power in the geographical points where there are no other alternatives than coal.
The EUA price is an added cost of energy as long as we consume fossil energy. Thus both today and in future years we’ll have the following as long as we consume fossil energy:
EUA price UP => Pain for consumers of energy => lower energy consumption, faster implementation of energy efficiency and renewable energy => lower emissions
The whole idea with the EUA price is after all that emissions goes down when the EUA price goes up. Either due to reduced energy consumption directly, accelerated energy efficiency measures or faster switch to renewable energy etc.
Let’s say that the coal to gas flex is maxed out with an EUA price way above the technical coal to gas differentials in 2026/27 and later. If the nat gas price then goes up it will no longer be an option to ”go black” and use more coal as the distance to that is too far away price vise due to a tight carbon market and a high EUA price. We’ll then instead have that:
Nat gas higher => higher energy costs with pain for consumers => weaker nat gas / energy demand & stronger drive for energy efficiency implementation & stronger drive for more non-fossil energy => lower emissions => EUA price lower
And if nat gas prices goes down it will give an incentive to consume more nat gas and thus emit more CO2:
Cheaper nat gas => Cheaper energy costs altogether, higher energy and nat gas consumption, less energy efficiency implementations in the broader economy => emissions either goes up or falls slower than before => EUA price UP
Historical and current positive correlation between nat gas and EUA prices should thus not at all be taken for granted for ever and we do expect this correlation to switch to negative some time in 2026/27.
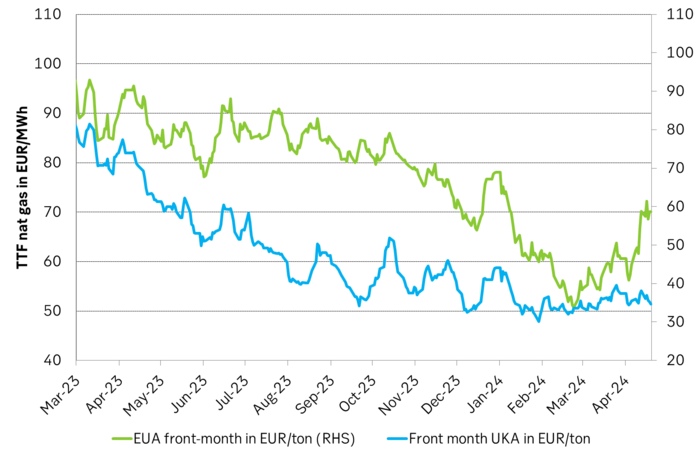
In the UK there is hardly any coal left at all in the power mix. There is thus no option to ”go black” and burn more coal if the nat gas price goes up. A higher nat gas price will instead inflict pain on consumers of energy and lead to lower energy consumption, lower nat gas consumption and lower emissions on the margin. There is still some positive correlation left between nat gas and UKAs but it is very weak and it could relate to correlations between power prices in the UK and the continent as well as some correlations between UKAs and EUAs.
Correlation of daily changes in front month EUA prices and front-year TTF nat gas prices, 250dma correlation.
EUA price vs front-year TTF nat gas price since March 2023
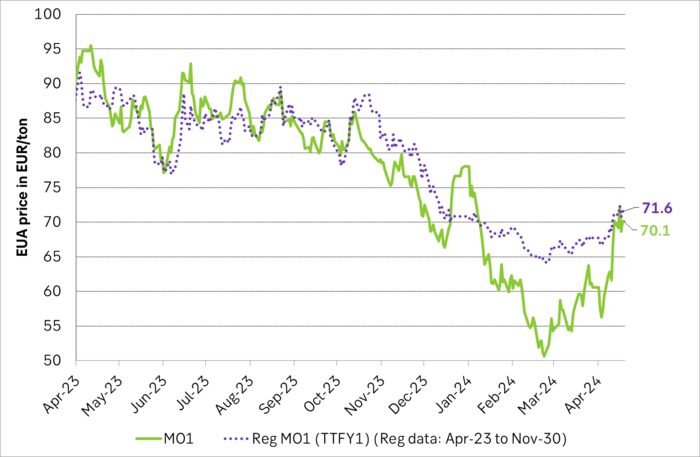
Front-month EUA price vs regression function of EUA price vs. nat gas derived from data from Apr to Nov last year.
The EUA price vs the UKA price. Correlations previously, but not much any more.
Forward German power prices versus clean cost of coal and clean cost of gas power. Coal is totally priced out vs power and nat gas on a forward 2026/27 basis.
Forward price of EUAs versus technical level where dynamical coal to gas flex typically takes place. EUA price for 2026/27 is at a level where there is no longer any price dynamical interaction or flex between coal and nat gas. The EUA price should/could then start to be negatively correlated to nat gas.
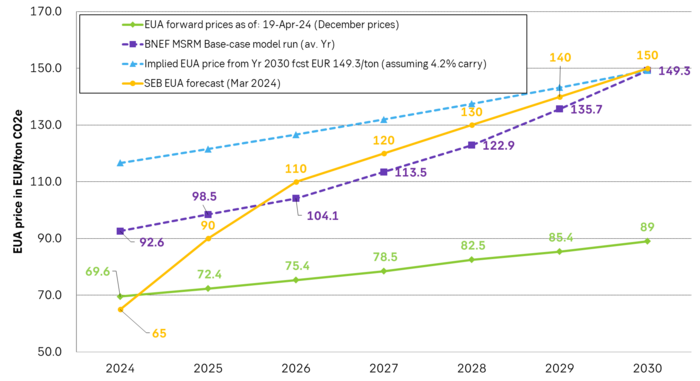
Forward EAU price vs. BNEF base model run (look for new update will come in late April), SEB’s EUA price forecast.
Brent crude spikes to USD 90.75/b before falling back as Iran plays it down. Brent crude fell sharply on Wednesday following fairly bearish US oil inventory data and yesterday it fell all the way to USD 86.09/b before a close of USD 87.11/b. Quite close to where Brent traded before the 1 April attack. This morning Brent spiked back up to USD 90.75/b (+4%) on news of Israeli retaliatory attack on Iran. Since then it has quickly fallen back to USD 88.2/b, up only 1.3% vs. ydy close.
The fear is that we are on an escalating tit-for-tat retaliatory path. Following explosions in Iran this morning the immediate fear was that we now are on a tit-for-tat escalating retaliatory path which in the could end up in an uncontrollable war where the US unwillingly is pulled into an armed conflict with Iran. Iran has however largely diffused this fear as it has played down the whole thing thus signalling that the risk for yet another leg higher in retaliatory strikes from Iran towards Israel appears low.
The hope is that the retaliatory strikes will be fading in magnitude and then fizzle out. What we can hope for is that the current tit-for-tat retaliatory strikes are fading in magnitude rather than rising in magnitude. Yes, Iran may retaliate to what Israel did this morning, but the hope if it does is that it is of fading magnitude rather than escalating magnitude.
Israel is playing with ”US house money”. What is very clear is that neither the US nor Iran want to end up in an armed conflict with each other. The US concern is that it involuntary is dragged backwards into such a conflict if Israel cannot control itself. As one US official put it: ”Israel is playing with (US) house money”. One can only imagine how US diplomatic phone lines currently are running red-hot with frenetic diplomatic efforts to try to defuse the situation.
It will likely go well as neither the US nor Iran wants to end up in a military conflict with each other. The underlying position is that both the US and Iran seems to detest the though of getting involved in a direct military conflict with each other and that the US is doing its utmost to hold back Israel. This is probably going a long way to convince the market that this situation is not going to fully blow up.
The oil market is nonetheless concerned as there is too much oil supply at stake. The oil market is however still naturally concerned and uncomfortable about the whole situation as there is so much oil supply at stake if the situation actually did blow up. Reports of traders buying far out of the money call options is a witness of that.
Throughout this week, the Brent Crude price has experienced a decline of USD 3 per barrel, despite ongoing turmoil in the Middle East. Price fluctuations have ranged from highs of USD 91 per barrel at the beginning of the week to lows of USD 87 per barrel as of yesterday evening.

Following the release of yesterday’s US inventory report, Brent Crude once again demonstrated resilience against broader macroeconomic concerns, instead focusing on underlying market fundamentals.
Nevertheless, the recent drop in prices may come as somewhat surprising given the array of conflicting signals observed. Despite an increase in US inventories—a typically bearish indicator—we’ve also witnessed escalating tensions in the Middle East, coupled with the reinstatement of US sanctions on Venezuela. Furthermore, there are indications of impending sanctions on Iran in response to the recent attack on Israel.
Treasury Secretary Janet Yellen has indicated that new sanctions targeting Iran, particularly aimed at restricting its oil exports, could be announced as early as this week. As previously highlighted, we maintain the view that Iran’s oil exports remain vulnerable even without further escalation of the conflict. It appears that Israel is exerting pressure on its ally, the US, to impose stricter sanctions on Iran, an action that is unfolding before our eyes.
Iran’s current oil production stands at close to 3.2 million barrels per day. Considering additional condensate production of about 0.8 million barrels per day and subtracting domestic demand of roughly 1.8 million barrels per day, the net export of Iranian crude and condensate is approximately 2.2 million barrels per day.
However, the uncertainty surrounding the enforcement of such sanctions casts doubt on the likelihood of a complete ending of Iranian exports. Approximately 80% of Iran’s exports are directed to independent refineries in China, suggesting that US sanctions may have limited efficacy unless China complies. The prospect of China resisting US pressure on its oil imports from Iran poses a significant challenge to US sanctions enforcement efforts.
Furthermore, any shortfall resulting from sanctions could potentially be offset by other OPEC nations with spare capacity. Saudi Arabia and the UAE, for instance, can collectively produce an additional almost 3 million barrels of oil per day, although this remains a contingency measure.
In addition to developments related to Iran, the Biden administration has re-imposed restrictions on Venezuelan oil, marking the end of a six-month reprieve. This move is expected to impact flows from the South American nation.
Meanwhile, US crude inventories (excluding SPR holdings) surged by 2.7 million barrels last week (page 11 attached), reaching their highest level since June of last year. This increase coincided with a decline in measures of fuel demand (page 14 attached), underscoring a slightly weaker US market.
In summary, while geopolitical tensions persist and new rounds of sanctions are imposed, our market outlook remains intact. We maintain our forecast of an average Brent Crude price of USD 85 per barrel for the year 2024. In the short term, however, prices are expected to hover around the USD 90 per barrel mark as they navigate through geopolitical uncertainties and fundamental factors.


Nat gas to EUA correlation will likely switch to negative in 2026/27 onward

AI ökar det totala elbehovet i USA med 100 % kommande 15 år
Fear that retaliations will escalate but hopes that they are fading in magnitude
Fundamentals trump geopolitical tensions

Fortum och Vargön Alloys tecknar femårigt avtal om kärnkraftsel

Guldpriset når nytt all time high och bryter igenom 2300 USD

Lundin Mining får köprekommendation av BMO

Vertikal prisuppgång på kakao – priset toppar nu 9000 USD

Centralbanker fortsatte att köpa guld under februari

Kaffepriserna stiger på lågt utbud och stark efterfrågan
-
 Nyheter3 veckor sedan
Guldpriset når nytt all time high och bryter igenom 2300 USD
-
 Nyheter3 veckor sedan
Lundin Mining får köprekommendation av BMO
-
 Nyheter4 veckor sedan
Vertikal prisuppgång på kakao – priset toppar nu 9000 USD
-
 Nyheter2 veckor sedan
Centralbanker fortsatte att köpa guld under februari
-
 Nyheter4 veckor sedan
Kaffepriserna stiger på lågt utbud och stark efterfrågan
-

 Nyheter2 veckor sedan
Hur mår den svenska skogsbraschen? Två favoritaktier
-

 Nyheter3 veckor sedan
Boliden på 20 minuter
-

 Nyheter2 veckor sedan
Kakaomarknaden är extrem för tillfället